
[vc_row][vc_column][vc_separator border_width=”5″][/vc_column][/vc_row][vc_row][vc_column][vc_column_text]
EURUSD
[/vc_column_text][/vc_column][/vc_row][vc_row][vc_column][vc_separator border_width=”5″][/vc_column][/vc_row][vc_row][vc_column width=”1/2″][vc_custom_heading text=”BEFORE” use_theme_fonts=”yes”][vc_column_text]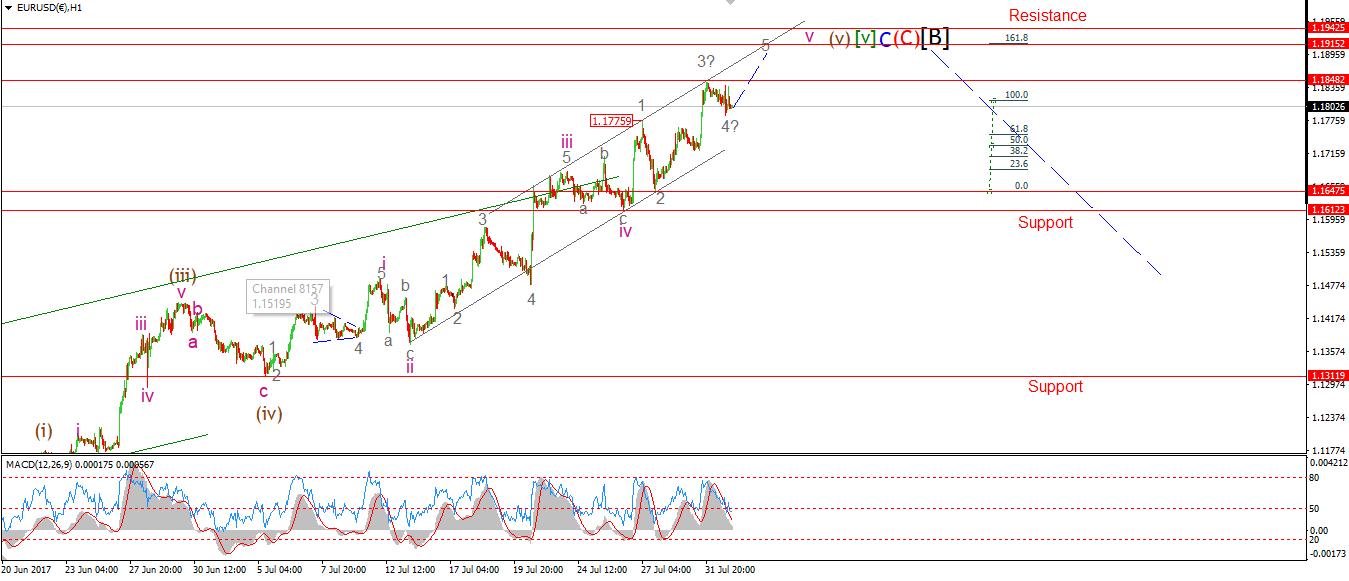 [/vc_column_text][/vc_column][vc_column width=”1/2″][vc_custom_heading text=”AFTER” use_theme_fonts=”yes”][vc_column_text]
 [/vc_column_text][/vc_column][/vc_row][vc_row][vc_column][vc_column_text]
There are times when the Elliott wave perspective provides a glimpse of the future with stunning accuracy!
Last week I sent out a free update to you guys which proposed a rally to a top for EURUSD, and a rally out of a correction to new highs for the DOW.
Here is an example within the last week of how two simple Elliott wave counts provided insight which called a rise and then complete U-TURN in EURUSD which totaled 300 points in market movement!
And a rally out of a correction in the DOW which resulted in an almost 200 point rally to new all time highs again today!
As a result, both wave counts predicted market moves totaling over 500 points in the last week alone.
Here’s what I proposed for EURUSD shown on the chart above:
“the extended nature of this structure leaves it open to a quick collapse.
And that is worth keeping in mind as wave ‘5’ grey completes this week.
The price corrected today in a possible wave ‘4’ grey,
This leaves wave ‘5’ grey left to complete the larger structure.
The target range for wave ‘5’ grey lies between 1.1915 and 1.1942.”
The price did rally and reached a high of 1.1910,
And after that high, the price turned down again and reached a low today of 1.1715, in total a move of over 300 points!
And the predictions did not end there!
[/vc_column_text][/vc_column][/vc_row][vc_row][vc_column][vc_separator][/vc_column][/vc_row][vc_row][vc_column][vc_column_text]
DOW JONES INDUSTRIALS
[/vc_column_text][/vc_column][/vc_row][vc_row][vc_column][vc_separator][/vc_column][/vc_row][vc_row][vc_column width=”1/2″][vc_custom_heading text=”BEFORE” use_theme_fonts=”yes”][vc_column_text]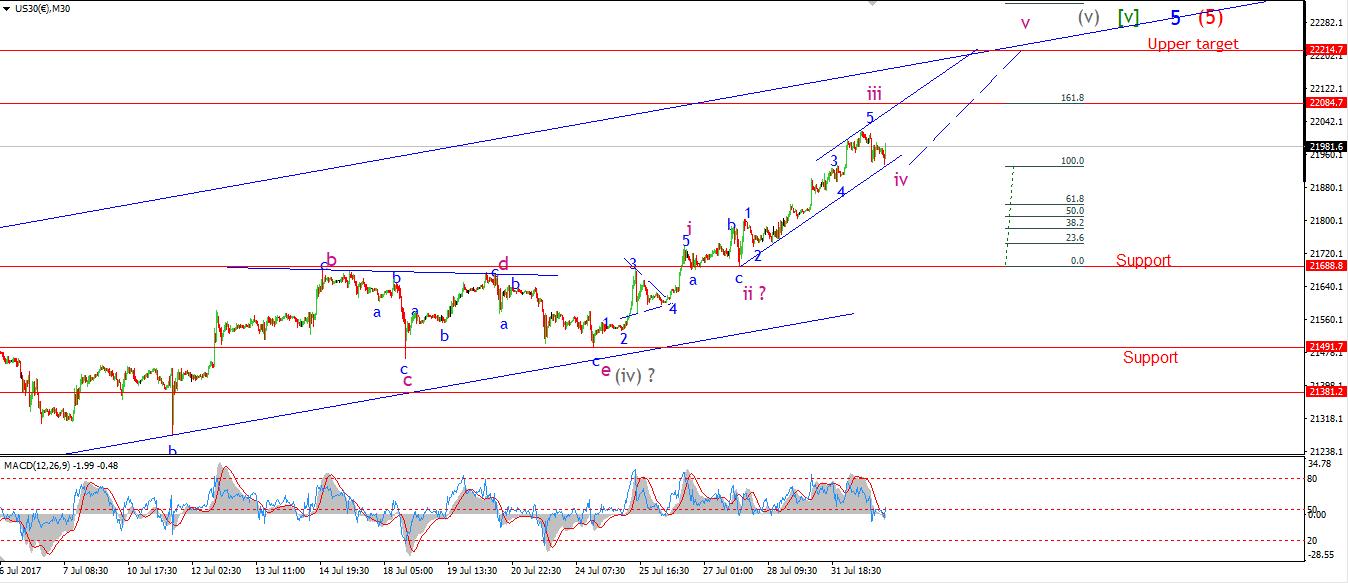 [/vc_column_text][/vc_column][vc_column width=”1/2″][vc_custom_heading text=”AFTER” use_theme_fonts=”yes”][vc_column_text]
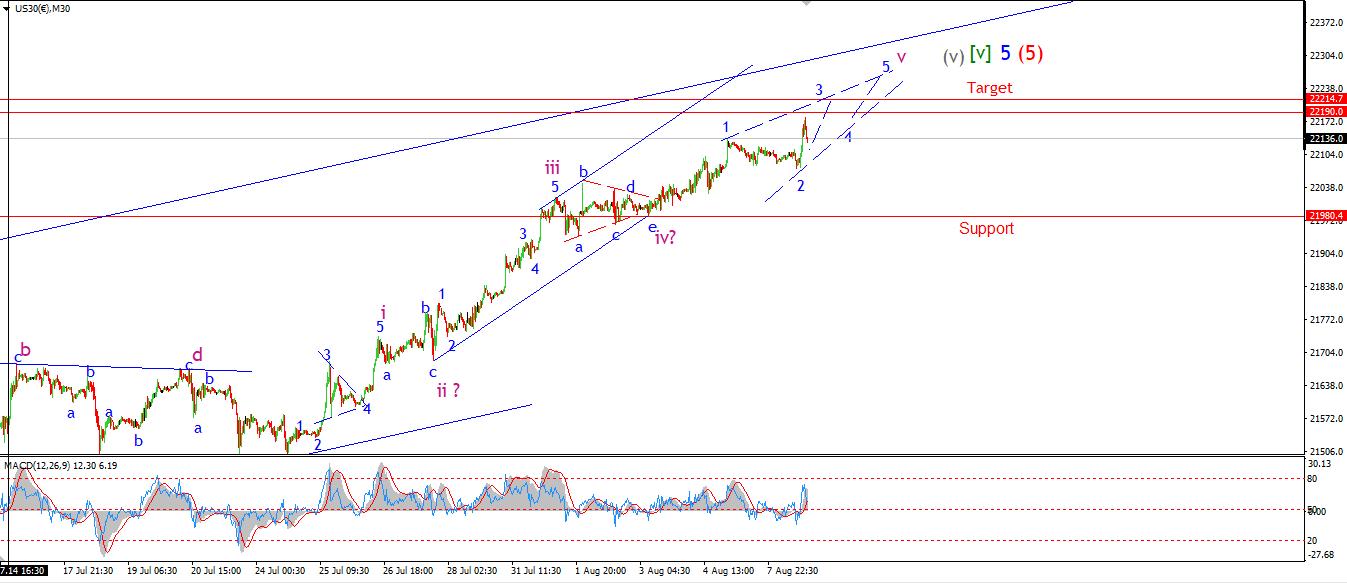 [/vc_column_text][/vc_column][/vc_row][vc_row][vc_column][vc_column_text]Last week I proposed a wave count for the DOW which was calling for the completion of a short correction and a large rally to a new all time high at about 22200.
At that time the price stood at 21980 and the market was stuck in a minor correction wave ‘iv’ pink, this is shown on the chart above left.
“I have labelled the decline as wave ‘iv’ pink,
Which leaves a further rise in wave ‘v’ to follow into the upper trendline.
A likely target for wave ‘v’ pink is at the upper trendline of the rising trend channel.
This could take the price up to about 22200 before completing the larger structure.”
Today chart is shown on the right, todays high on the DOW cash, reached 22173! – a nice 193 point rally.
But the story does not end there!!!! – Oh no no no….
The current Elliott wave counts for both the DOW and EURUSD predicts that we are sitting at a monumental turning point in these markets. A turning point which will have a major impact on the world economy and the lives of us everyday citizens.
Put simply, YOU NEED TO PREPARE!!!
The Elliott wave perspective will help you navigate the movements of the market so you always know where you stand in the larger trend
And, on top of that, Elliott wave analysis will help you minimize the impact of the market catastrophe which is facing us all in the very near future![/vc_column_text][/vc_column][/vc_row][vc_row][vc_column][vc_column_text]
If you want to stay ahead of the trend,
and see the big market moves before they happen,
CHECK OUT OUR MEMBERSHIP PLANS……
[/vc_column_text][/vc_column][/vc_row]