
In the summer of 2018 Gold was suffering through a long corrective decline,
which brought prices from over 1368 down to 1158.
This was a 15% decline and the majority of traders were super bearish at that point.
BUT;
The wave count at that time painted a completely different Bullish picture though!
Here’s is how the patterns played out.
I was counting that whole decline as a second wave correction within a much bigger advance which was set to begin.
The low of that correction hit 1160 on August 16th, here is the chart I published that night.
GOLD 4hr chart Aug 16th 2018:

Wave ‘2’ was shown as complete at the 1160 lows,
and now the wave count called for a large rally to begin off off that low.
The longer term chart called for wave ‘3’ to carry the price back up to the top of the trend channel line in the region of 1666 over the coming year.
Here is the daily chart from that night again.
Daily Gold chart Aug 16th 2018:

A few days later the short term chart showed a near complete bullish impulse wave up.
The trigger level for the bullish count lay at 1217, above that we had a long way up to go in wave ‘3’.

The price never hit that 1160 low again!
And the rally continued to build for a while.
In fact the price went from strength to strength throughout 2019.
Here is the latest long term chart from Early January 2020:
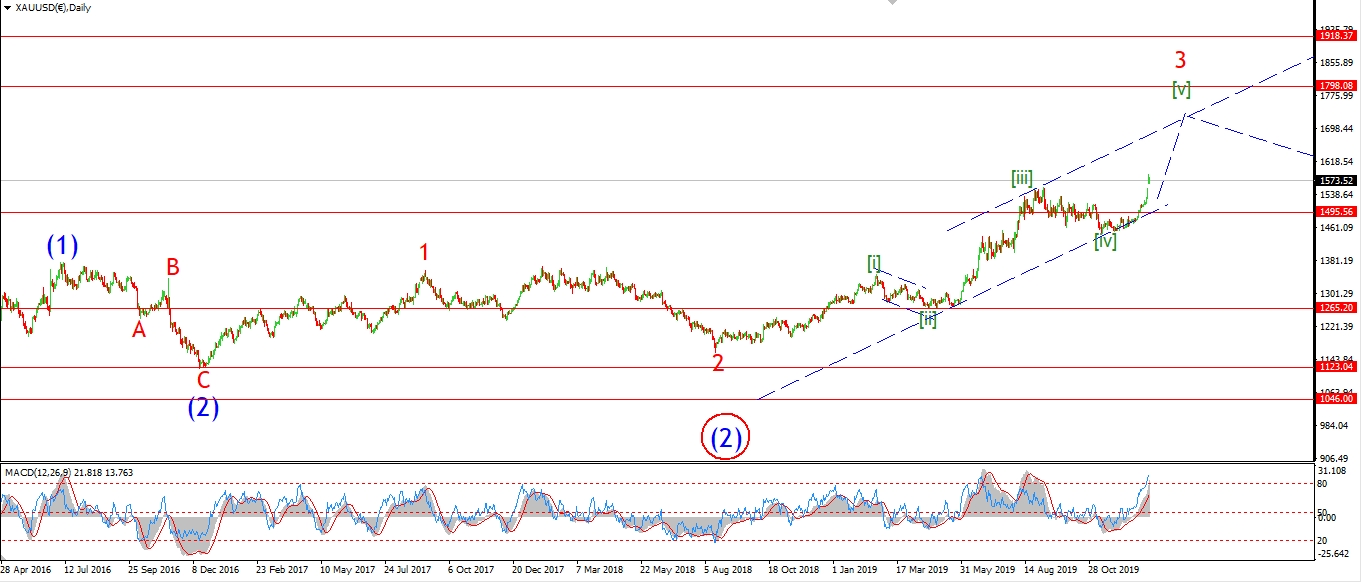
Gold has rallied 35% in wave ‘3’ so far reaching a high at 1570 as I write.
So a simple wave count predicted a solid rally which no one else could see coming back in mid 2018.
That rally continues to this day!
But – where are we going to go next in the precious metals market?
Check out bullwaves.org membership, to see what lies ahead for Gold.

Join Risk free today,
and see our predictions for the biggest markets in the world for the year ahead!