
[vc_row][vc_column][vc_separator border_width=”5″][/vc_column][/vc_row]
Elliott wave weekend review.
[vc_row][vc_column][vc_separator border_width=”5″][/vc_column][/vc_row]
[vc_row][vc_column][vc_column_text]
[/vc_column_text][/vc_column][/vc_row]
[vc_row][vc_column][vc_separator border_width=”5″][/vc_column][/vc_row]
Heres an example of a third wave in action!
On Monday night I showed this chart for Crude oil.
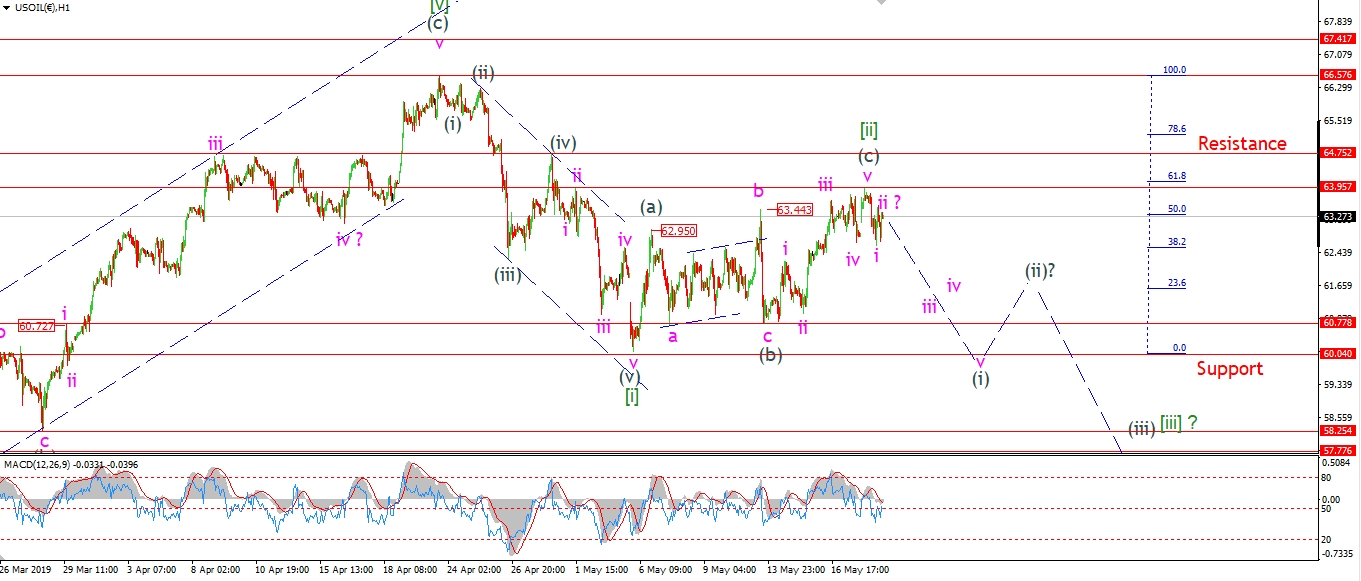
I showed a top was in place at wave [ii] and expected a large decline into wave [iii] to begin this week.
Heres the analysis from Monday:
Crude seems to be tracing out a small head and shoulders pattern over the last few sessions.
This should mark the top of wave [ii] with a lower high again as the right side shoulder.
This will likely complete as wave ‘ii’ pink,
and begin a larger decline in wave (i) grey.Wave (i) should continue to decline this week.
A break of 60.77 again at wave (b) again will confirm wave (i).
And here’s how that wave count has worked out this week.
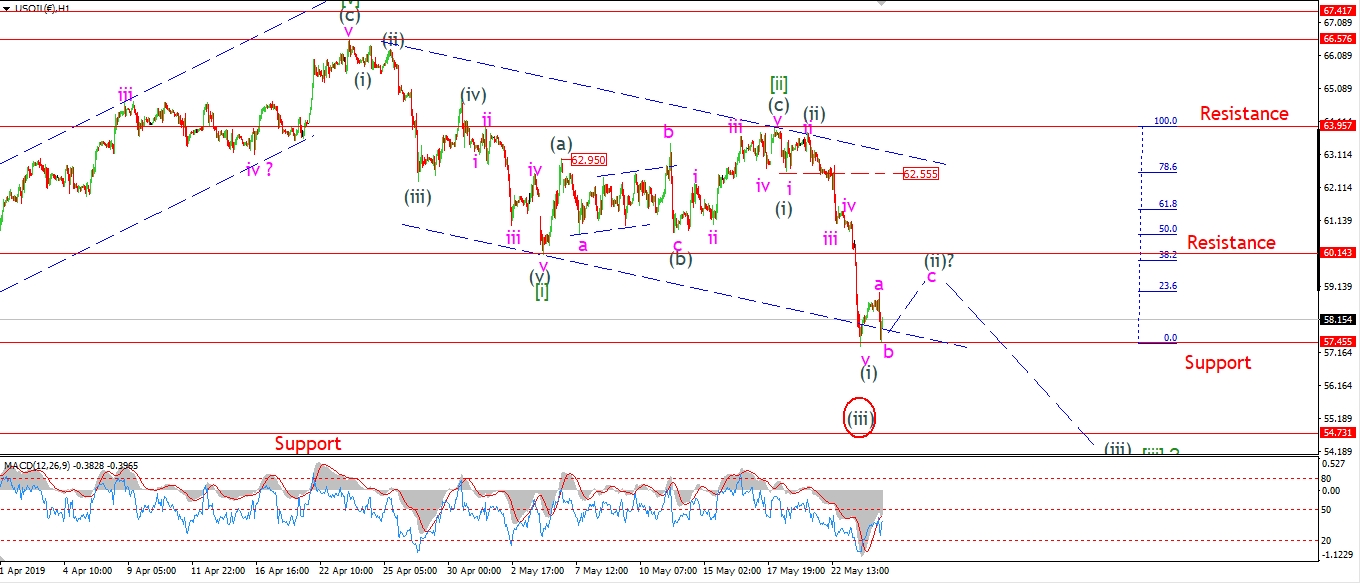
The price of Crude fell over 600 points this week alone!
And this should only be the beginning of the pain in the Crude oil market.
Don’t miss out on the nightly updates for Crude oil and many more markets!
Get instant access to more charts and analysis from tonights update,
and see what’s in store for the financial markets.
Check out Bullwaves Membership.
And stay ahead of the next BIG market move!
[vc_row][vc_column][vc_separator border_width=”5″][/vc_column][/vc_row]