
[vc_row][vc_column][vc_separator border_width=”5″][/vc_column][/vc_row][vc_row][vc_column][vc_column_text]
GBPUSD
[/vc_column_text][/vc_column][/vc_row][vc_row][vc_column][vc_separator border_width=”5″][/vc_column][/vc_row][vc_row][vc_column width=”2/3″][vc_custom_heading text=”30 min” use_theme_fonts=”yes”][vc_column_text]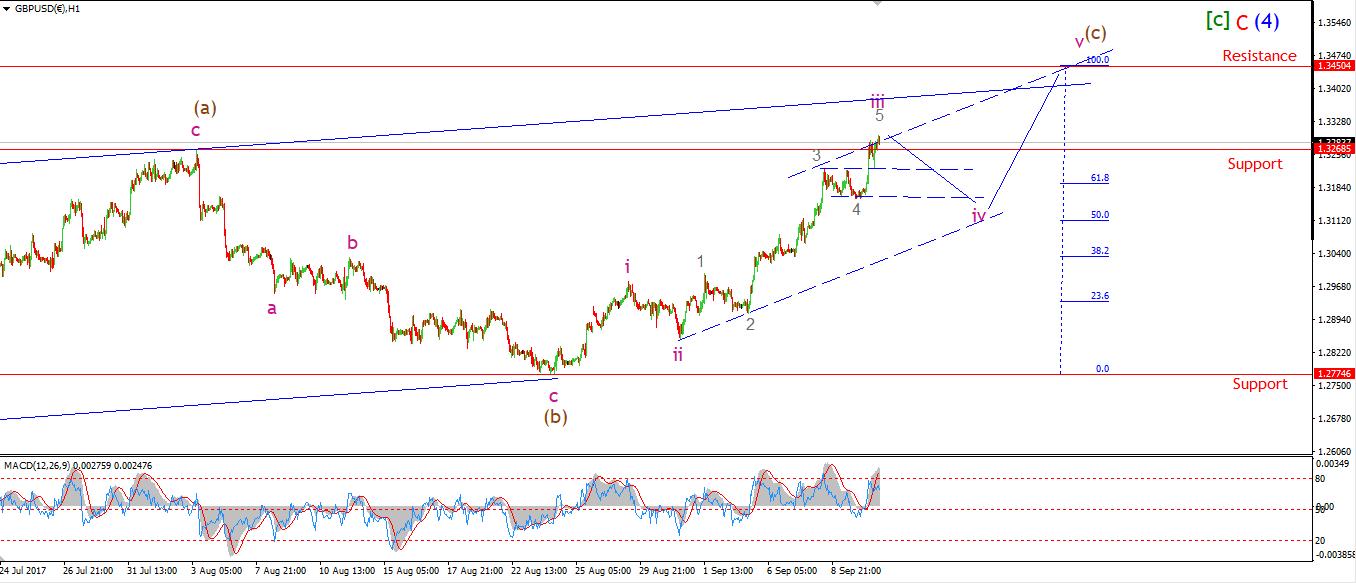 [/vc_column_text][/vc_column][vc_column width=”1/3″][vc_custom_heading text=”4 Hours” use_theme_fonts=”yes”][vc_column_text]
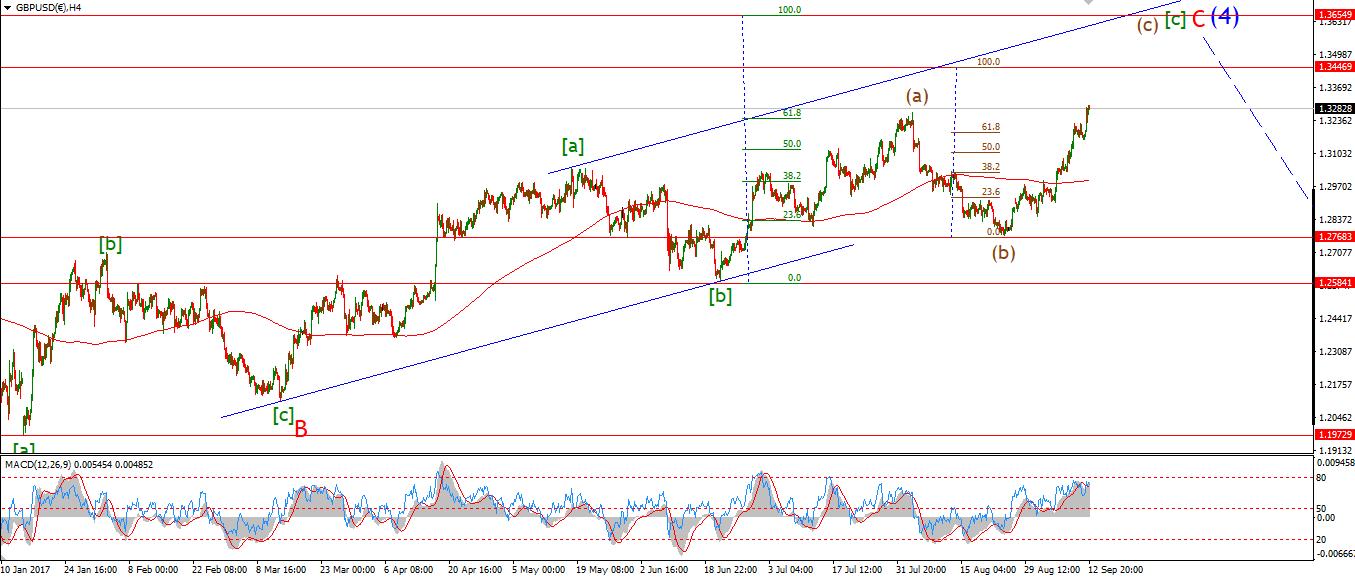 [/vc_column_text][vc_custom_heading text=”Daily” use_theme_fonts=”yes”][vc_column_text]
 [/vc_column_text][/vc_column][/vc_row][vc_row][vc_column][vc_column_text]My Bias: short below parity in wave (5).
Wave Structure: continuing impulsive structure to the downside in wave (5)
Long term wave count: decline in wave (5) blue, below parity
Important risk events: GBP: Average Earnings Index 3m/y, Unemployment Rate. USD: PPI m/m, Crude Oil Inventories.
Todays rally above resistance at 1.3268 triggered the alternate wave count in cable.
I have altered both the 4hr and the short term charts
to show a rally in wave (c) brown which is almost complete again.
The current wave count and Fibonacci extension,
project an initial target range for wave (c) brown between 1.3450 and 1.3650.
The 4hr chart shows both projections.
The trend channel in the 4hr chart suggests the higher target will be reached.
For tomorrow;
The short term count suggests that wave ‘iii’ pink is coming to an end.
A decline in wave ‘iv’ should bring price down into 1.3150 again.[/vc_column_text][/vc_column][/vc_row][vc_row][vc_column][vc_separator][/vc_column][/vc_row][vc_row][vc_column][vc_column_text]
DOW JONES INDUSTRIALS
[/vc_column_text][/vc_column][/vc_row][vc_row][vc_column][vc_separator][/vc_column][/vc_row][vc_row][vc_column width=”2/3″][vc_custom_heading text=”30 min” use_theme_fonts=”yes”][vc_column_text] [/vc_column_text][/vc_column][vc_column width=”1/3″][vc_custom_heading text=”4 Hours” use_theme_fonts=”yes”][vc_column_text]
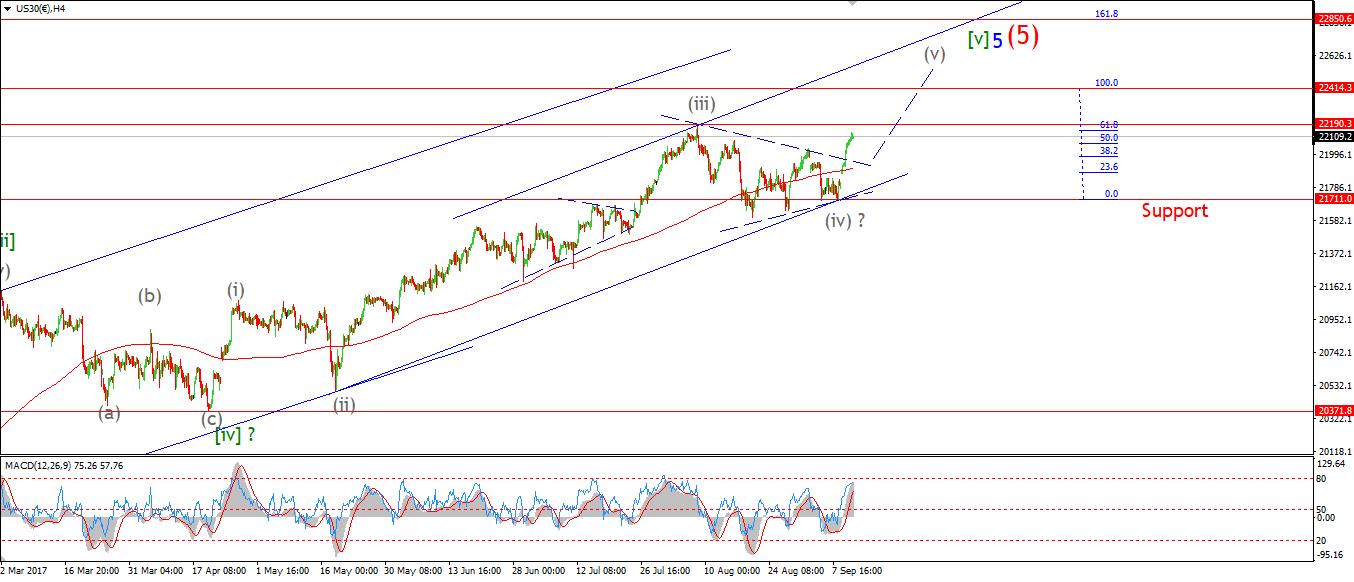 [/vc_column_text][vc_custom_heading text=”Daily” use_theme_fonts=”yes”][vc_column_text]
 [/vc_column_text][/vc_column][/vc_row][vc_row][vc_column][vc_column_text]My Bias: market topping process ongoing
Wave Structure: Impulsive 5 wave structure, possibly topping in an all time high.
Long term wave count: Possibly topped in wave (5)
Important risk events: USD: PPI m/m, Crude Oil Inventories.
I have switched to the alternate wave count today.
The impulsive looking rally off the fridays low seems to fit with a rally in wave ‘v’ pink as expalained in yesterdays post.
I have shown a possible path for prices to complete a further five wave rally into the new upper target
On the 4hr chart I have shown these higher targets as:
22414 – where wave (v) grey equals wave (i) grey.
And
22850 – where wave (v) grey equals 161.8% of wave (i) grey.
This short term bulish outlook does not change the larger bearish backdrop.
the rally in wave (5) red has meerly extended,
the outcome will be all the more painful on the far side of this wave structure.
For tomorrow;
Watch for a completing wave ‘i’ pink possibly at a new all time high,
A correction in wave ‘ii’ should begin soon.[/vc_column_text][/vc_column][/vc_row][vc_row][vc_column][vc_separator][/vc_column][/vc_row]