
[vc_row][vc_column][vc_separator border_width="5"][/vc_column][/vc_row]
[vc_row][vc_column][vc_column_text]
Good evening to you all,
I hope the day was kind to you.
[/vc_column_text][/vc_column][/vc_row]
[vc_row][vc_column][vc_separator border_width="5"][/vc_column][/vc_row][vc_row][vc_column][vc_column_text]
[/vc_column_text][/vc_column][/vc_row][vc_row][vc_column][vc_column_text]
UPCOMING RISK EVENTS:
USD: Unemployment Claims, Existing Home Sales,
EUR: ECB Monetary Policy Meeting Accounts,
GBP: BOE Gov Carney Speaks, Retail Sales m/m,
JPY: N/A.
[/vc_column_text][/vc_column][/vc_row]
[vc_row][vc_column][vc_separator border_width="5"][/vc_column][/vc_row][vc_row][vc_column][vc_column_text]
EURUSD
[/vc_column_text][/vc_column][/vc_row][vc_row][vc_column][vc_separator border_width="5"][/vc_column][/vc_row][vc_row][vc_column width="2/3"][vc_custom_heading text="30 min" use_theme_fonts="yes"][vc_column_text]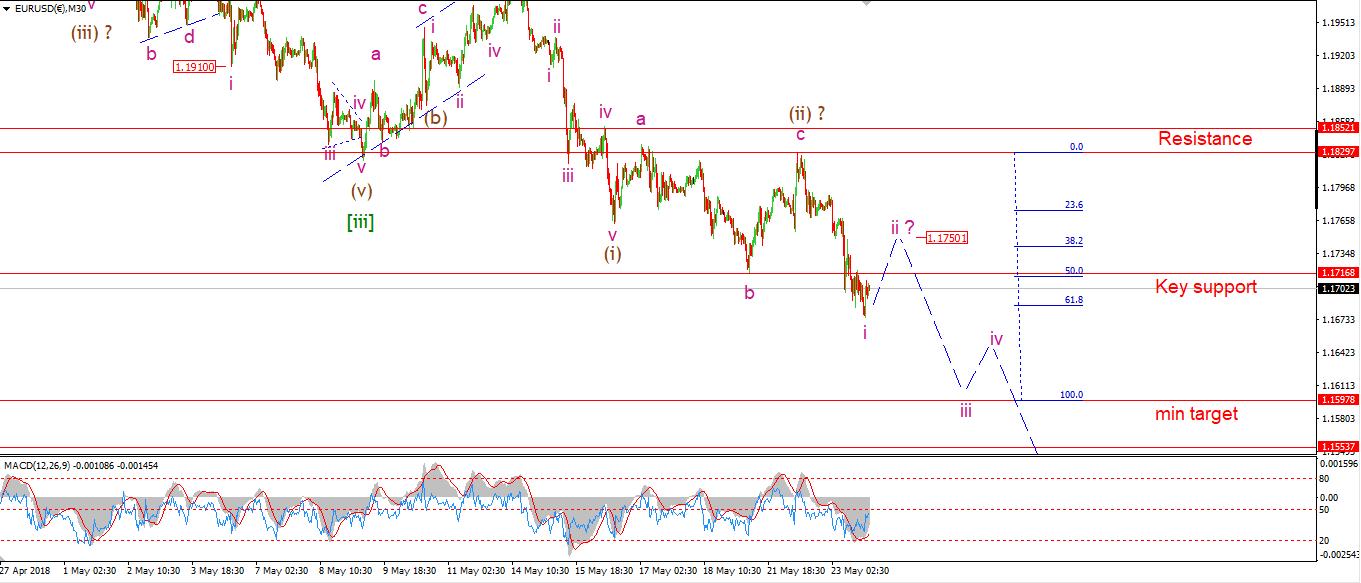 [/vc_column_text][/vc_column][vc_column width="1/3"][vc_custom_heading text="4 Hours" use_theme_fonts="yes"][vc_column_text]
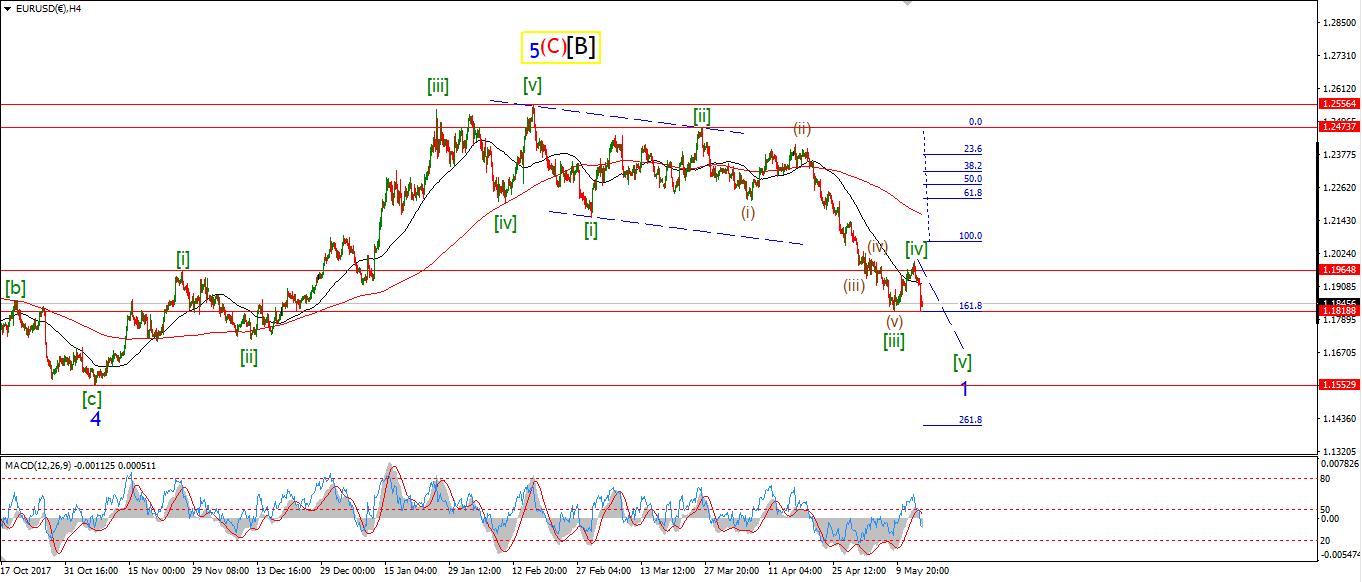 [/vc_column_text][vc_custom_heading text="Daily" use_theme_fonts="yes"][vc_column_text]
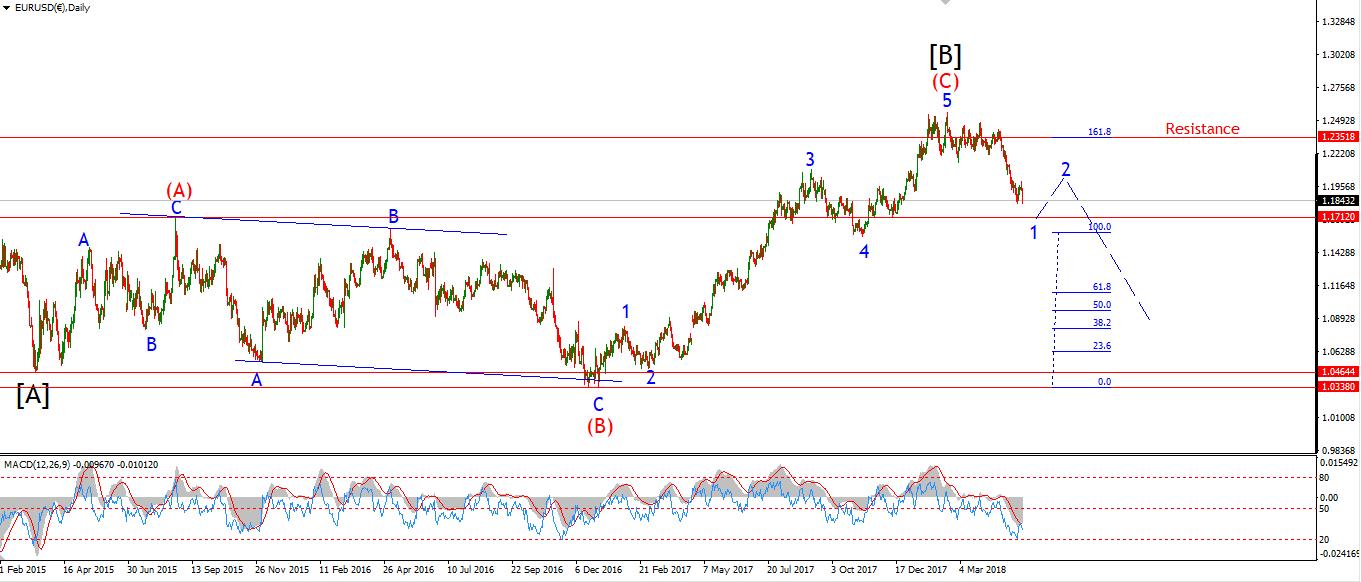 [/vc_column_text][/vc_column][/vc_row][vc_row][vc_column][vc_column_text]My Bias: long term bearish
Wave Structure: Topped in wave [B] black.
Long term wave count: lower in wave [C] black.
The idea of a running flat wave (ii) brown is working well after further declines in todays session.
Price broke down below key support at 1.1716,
This is the low of the previous wave [ii] green way back last December.
Off the wave (ii) high at 1.1829,
the price has declined in another five wave form,
I have labelled wave 'i' of (iii) complete at the lows.
Wave 'ii' should retrace in three waves to about 1.1750.
Tomorrow;
Watch for a three wave rise in wave 'ii' of (iii).
[/vc_column_text][/vc_column][/vc_row]
[vc_row][vc_column][vc_separator border_width="5"][/vc_column][/vc_row][vc_row][vc_column][vc_column_text]
GBPUSD
[/vc_column_text][/vc_column][/vc_row][vc_row][vc_column][vc_separator border_width="5"][/vc_column][/vc_row][vc_row][vc_column width="2/3"][vc_custom_heading text="30 min" use_theme_fonts="yes"][vc_column_text]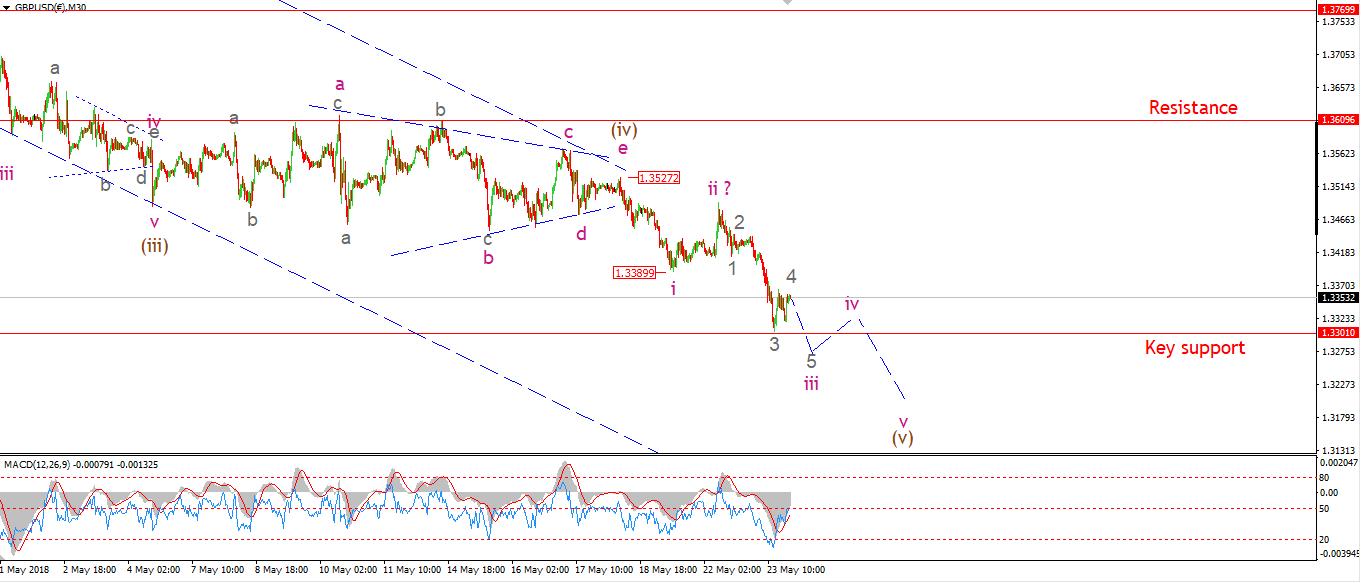 [/vc_column_text][/vc_column][vc_column width="1/3"][vc_custom_heading text="4 Hours" use_theme_fonts="yes"][vc_column_text]
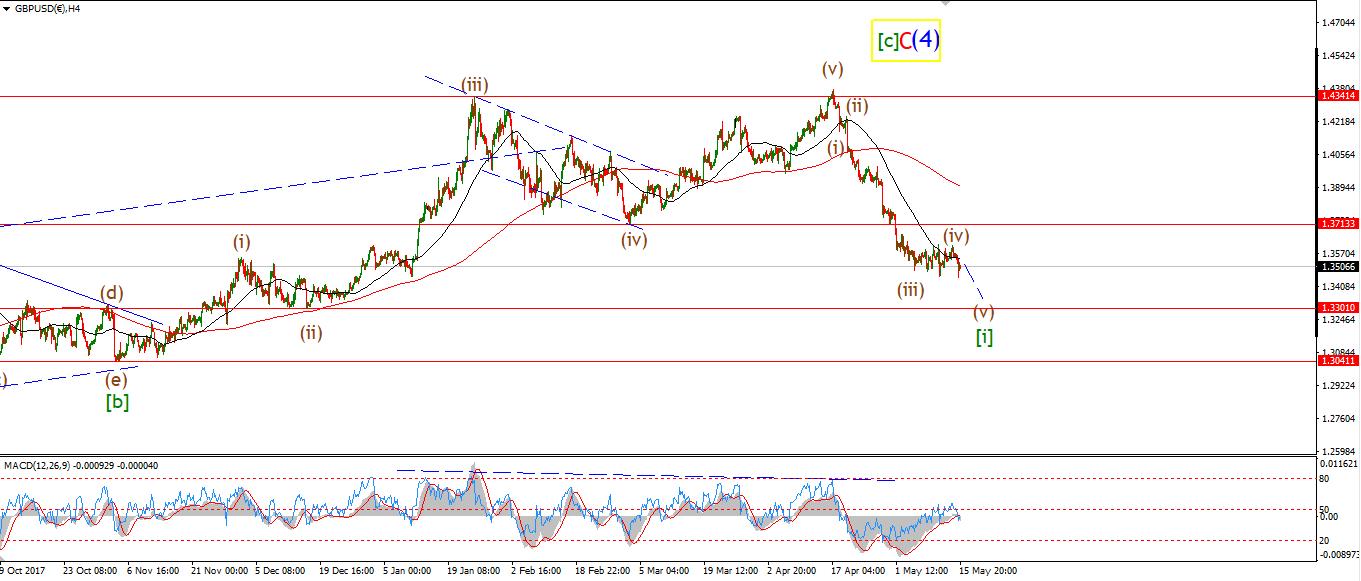 [/vc_column_text][vc_custom_heading text="Daily" use_theme_fonts="yes"][vc_column_text]
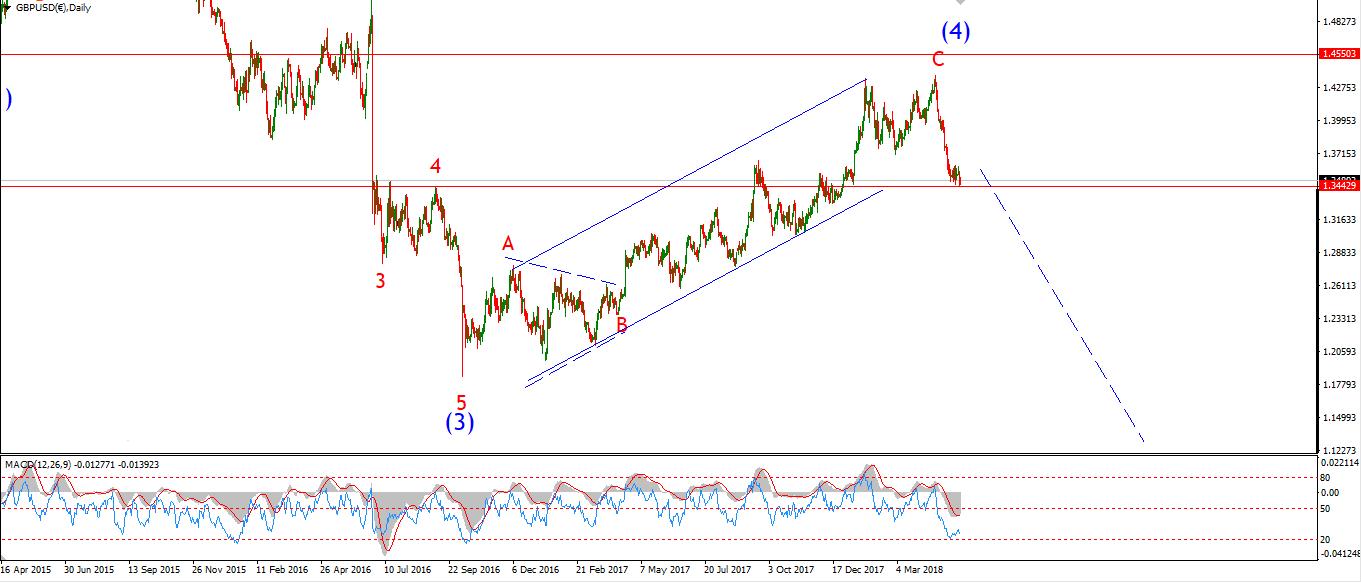 [/vc_column_text][/vc_column][/vc_row][vc_row][vc_column][vc_column_text]My Bias: short below parity in wave (5).
Wave Structure: completed wave (4) blue correction higher.
Long term wave count: decline in wave (5) blue, below parity
Cable returned to declines today in a possible wave 'iii' of (v).
The price low reached 1.3304,
just 3 pips above key support at 1.3301,
another wave (ii) low of the previous rise on December 15th last.
Key support can been seen on the 4hr chart.
Tomorrow;
Wave (v) brown has yet to complete five internal sub-divisions.
I expect price to break key support at 1.3301 tomorrow.
to complete wave 'iii' of (v).
Price must not break above 1.3389.
[/vc_column_text][/vc_column][/vc_row]
[vc_row][vc_column][vc_separator border_width="5"][/vc_column][/vc_row][vc_row][vc_column][vc_column_text]
USDJPY
[/vc_column_text][/vc_column][/vc_row][vc_row][vc_column][vc_separator border_width="5"][/vc_column][/vc_row][vc_row][vc_column width="2/3"][vc_custom_heading text="30 min" use_theme_fonts="yes"][vc_column_text]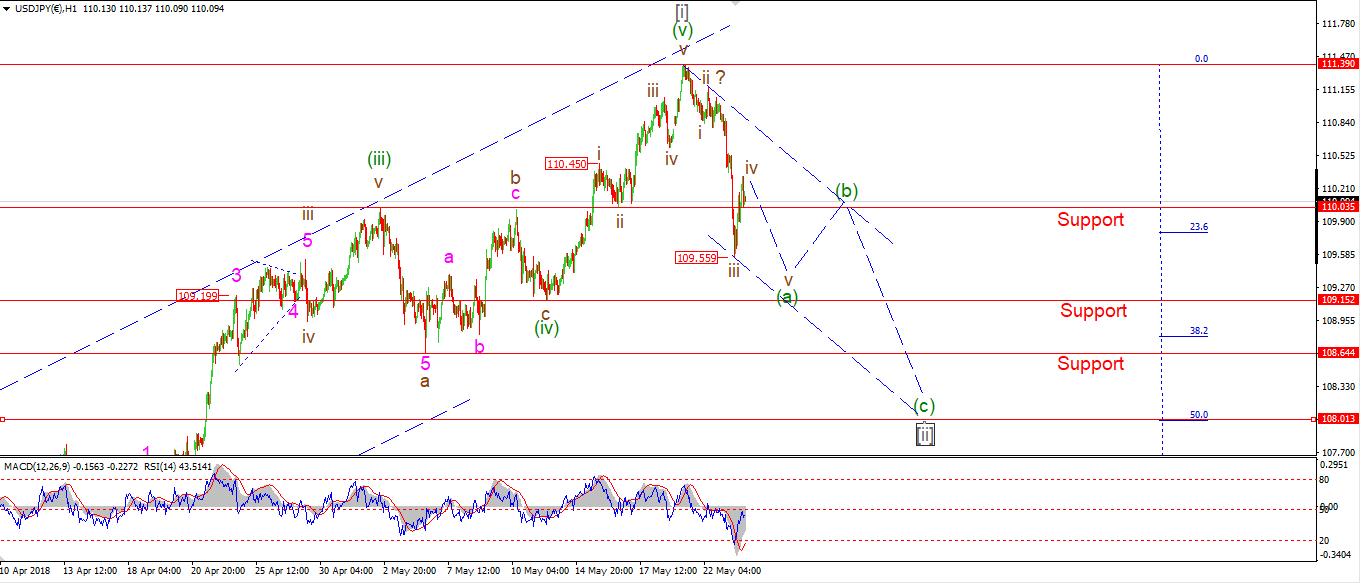 [/vc_column_text][/vc_column][vc_column width="1/3"][vc_custom_heading text="4 Hours" use_theme_fonts="yes"][vc_column_text]
 [/vc_column_text][vc_custom_heading text="Daily" use_theme_fonts="yes"][vc_column_text]
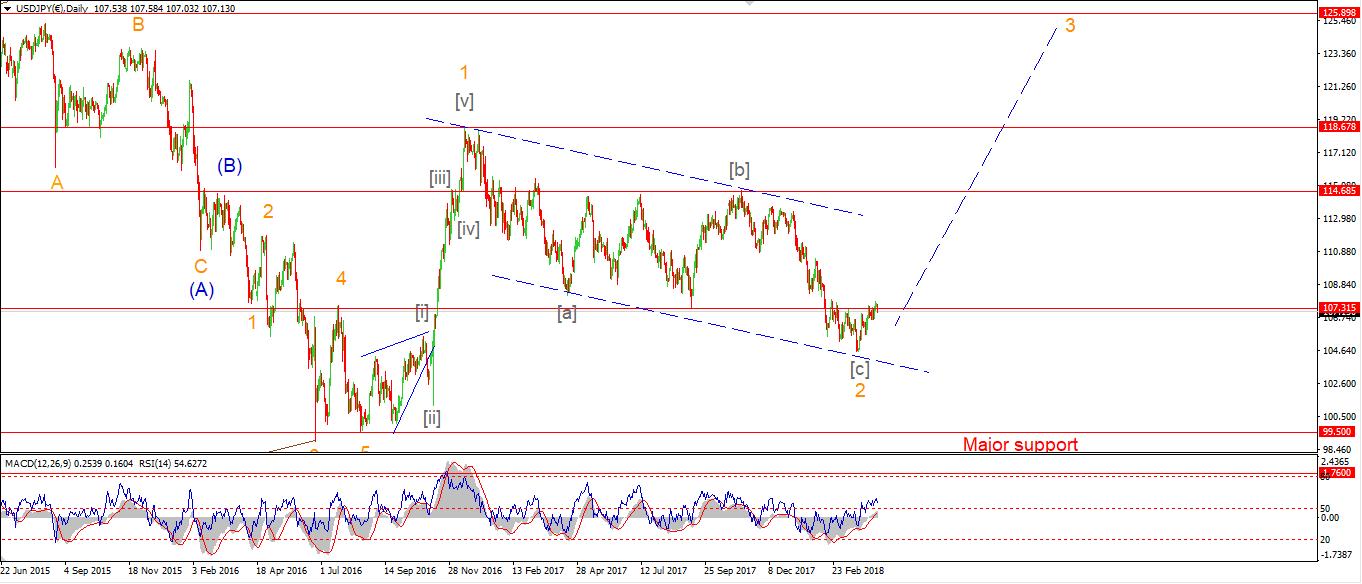 [/vc_column_text][/vc_column][/vc_row][vc_row][vc_column][vc_column_text]My Bias: LONG
Wave Structure: rally in wave [C]
Long term wave count: wave [C] is underway, upside to above 136.00
USDJPY sold off impressively today in wave 'iii' of (a).
Price has already reached the initial target zone for wave (a) as shown on last nights update.
It remains to be seen if wave [ii] creates a zigzag or flat correction.
If we see a break of 109.55 again,
That will create a clear five wave structure off the high,
And five waves down will suggest a zigzag correction for wave [ii].
Tomorrow;
Watch for a break of 109.55 to complete wave (a) green,
Wave (b) should then correct higher in a three wave pattern.
[/vc_column_text][/vc_column][/vc_row]
[vc_row][vc_column][vc_separator border_width="5"][/vc_column][/vc_row][vc_row][vc_column][vc_column_text]
DOW JONES INDUSTRIALS
[/vc_column_text][/vc_column][/vc_row][vc_row][vc_column][vc_separator border_width="5"][/vc_column][/vc_row][vc_row][vc_column width="2/3"][vc_custom_heading text="30 min" use_theme_fonts="yes"][vc_column_text]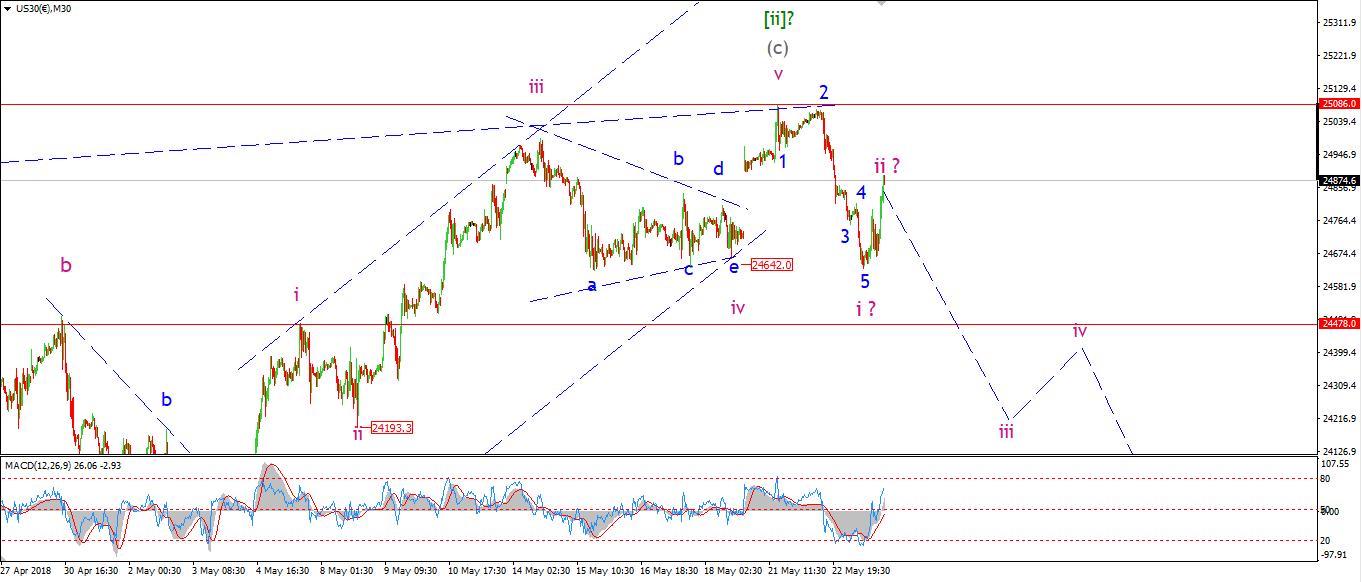 [/vc_column_text][/vc_column][vc_column width="1/3"][vc_custom_heading text="4 Hours" use_theme_fonts="yes"][vc_column_text]
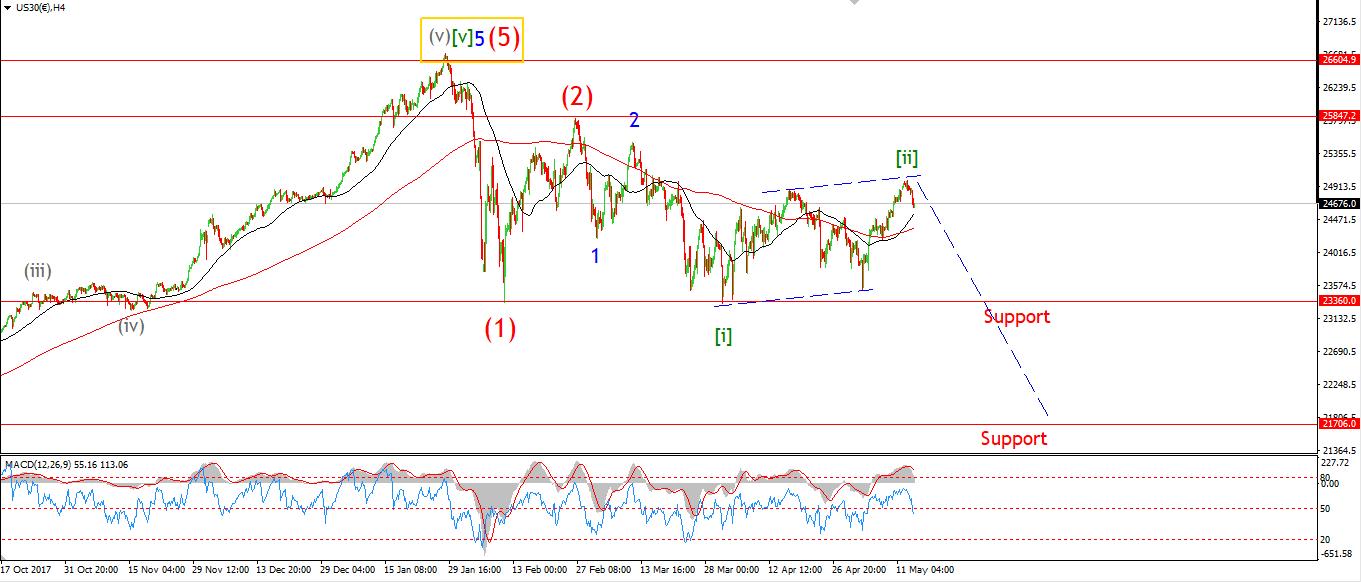 [/vc_column_text][vc_custom_heading text="Daily" use_theme_fonts="yes"][vc_column_text]
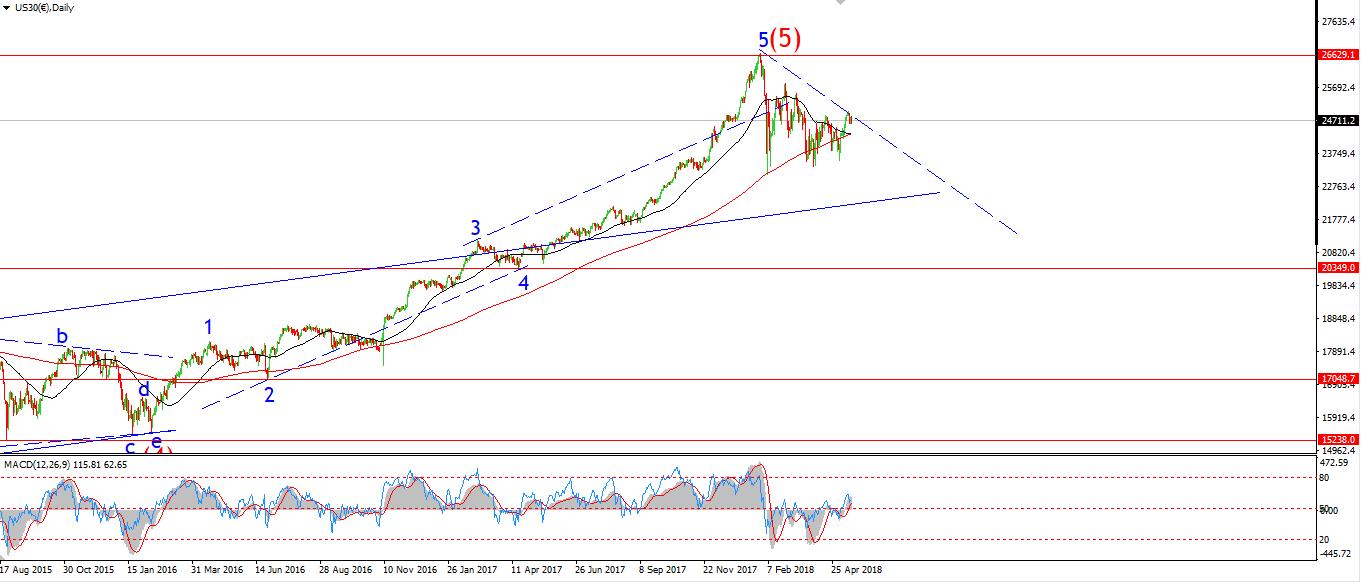 [/vc_column_text][/vc_column][/vc_row][vc_row][vc_column][vc_column_text]My Bias: market topping process completing
Wave Structure: Impulsive 5 wave structure, topping in an all time high, now beginning new bear market.
Long term wave count: topped in wave (5)
A further decline early in the session has completed a possible five waves down in wave 'i' pink.
Todays cash low reached 24667,
Which has failed to break the previous wave 'iv' at 24642.
This level remains the focus in the short term.
The price has rallied off the lows in a three wave pattern so far.
This suggests that wave 'ii' pink is also completing as we approach the close.
The next step in this price structure is further declines in wave 'iii' of (i).
Tomorrow;
25086 must hold and wave 'iii' will be confirmed with a break of 24667.
[/vc_column_text][/vc_column][/vc_row]
[vc_row][vc_column][vc_separator border_width="5"][/vc_column][/vc_row][vc_row][vc_column][vc_column_text]
GOLD
[/vc_column_text][/vc_column][/vc_row][vc_row][vc_column][vc_separator border_width="5"][/vc_column][/vc_row][vc_row][vc_column width="2/3"][vc_custom_heading text="30 min" use_theme_fonts="yes"][vc_column_text]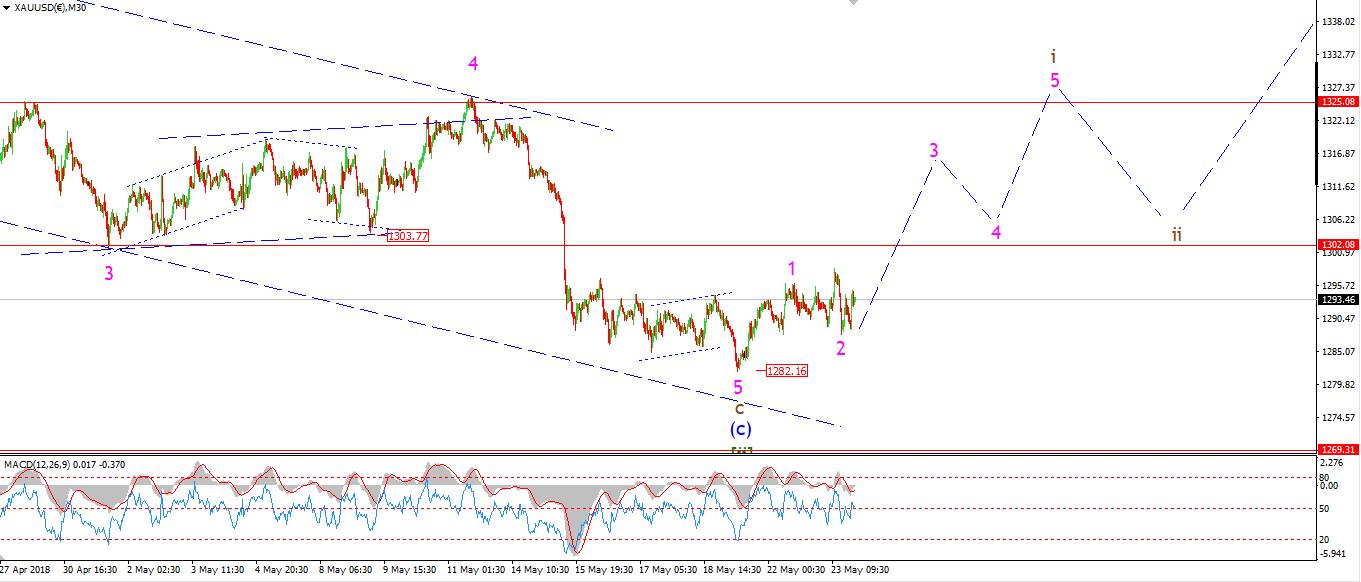 [/vc_column_text][/vc_column][vc_column width="1/3"][vc_custom_heading text="4 Hours" use_theme_fonts="yes"][vc_column_text]
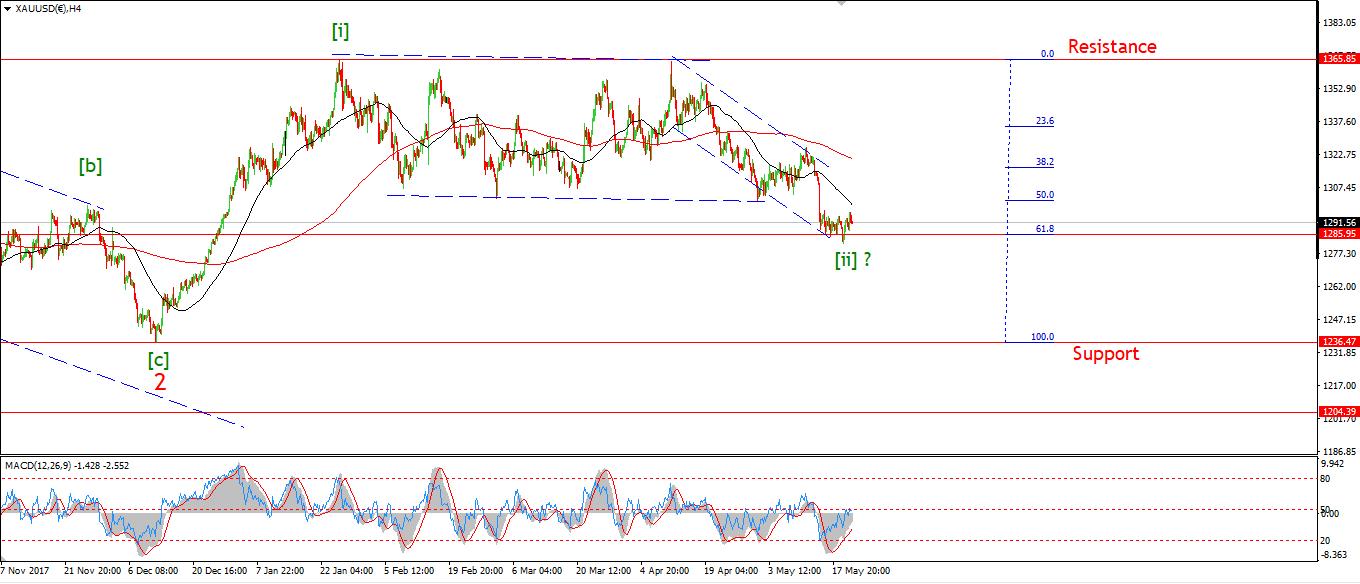 [/vc_column_text][vc_custom_heading text="Daily" use_theme_fonts="yes"][vc_column_text]
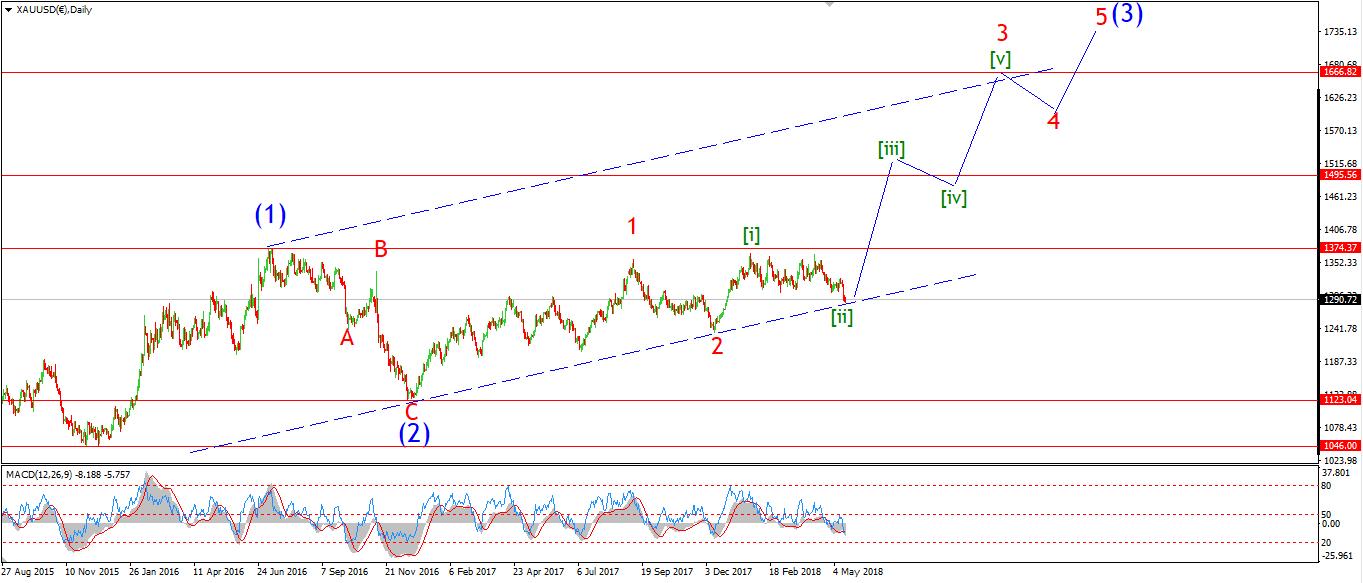 [/vc_column_text][/vc_column][/vc_row][vc_row][vc_column][vc_column_text]My Bias: Long to a new all time high above 1827.
Wave Structure: Impulse structure to a new all time high.
Long term wave count: wave [iii] above 1666.
The short term pattern in GOLD has completed five waves up in wave '1' pink,
followed by a three wave expanded flat decline in wave '2' pink.
It is now possible that we have a minor degree bullish Elliott wave signal in place off the low at 1282.16.
Wave '3' up should begin tomorrow,
This should carry the price back above 1300 again.
And wave 'i' brown should carry above 1325 before completing.
Tomorrow;
1282.16 must hold for this short term count to remain valid.
watch for a rally in wave '3'.
[/vc_column_text][/vc_column][/vc_row]
[vc_row][vc_column][vc_separator border_width="5"][/vc_column][/vc_row][vc_row][vc_column][vc_column_text]
U.S CRUDE OIL
[/vc_column_text][/vc_column][/vc_row][vc_row][vc_column][vc_separator border_width="5"][/vc_column][/vc_row][vc_row][vc_column width="2/3"][vc_custom_heading text="30 min" use_theme_fonts="yes"][vc_column_text]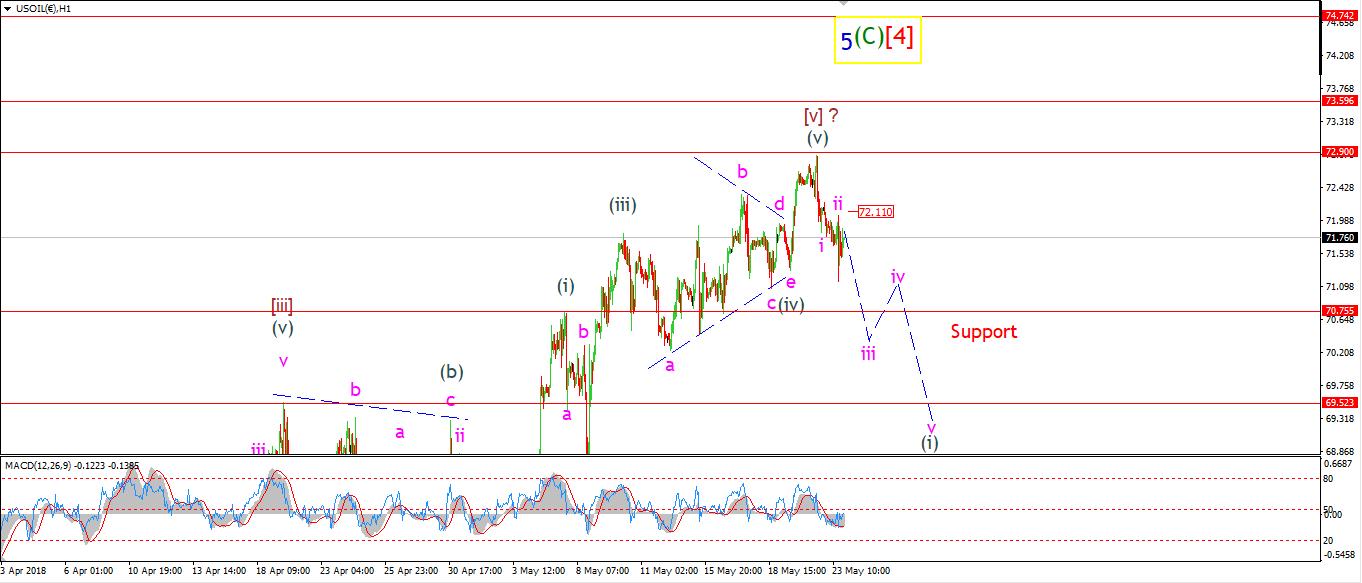 [/vc_column_text][/vc_column][vc_column width="1/3"][vc_custom_heading text="4 Hours" use_theme_fonts="yes"][vc_column_text]
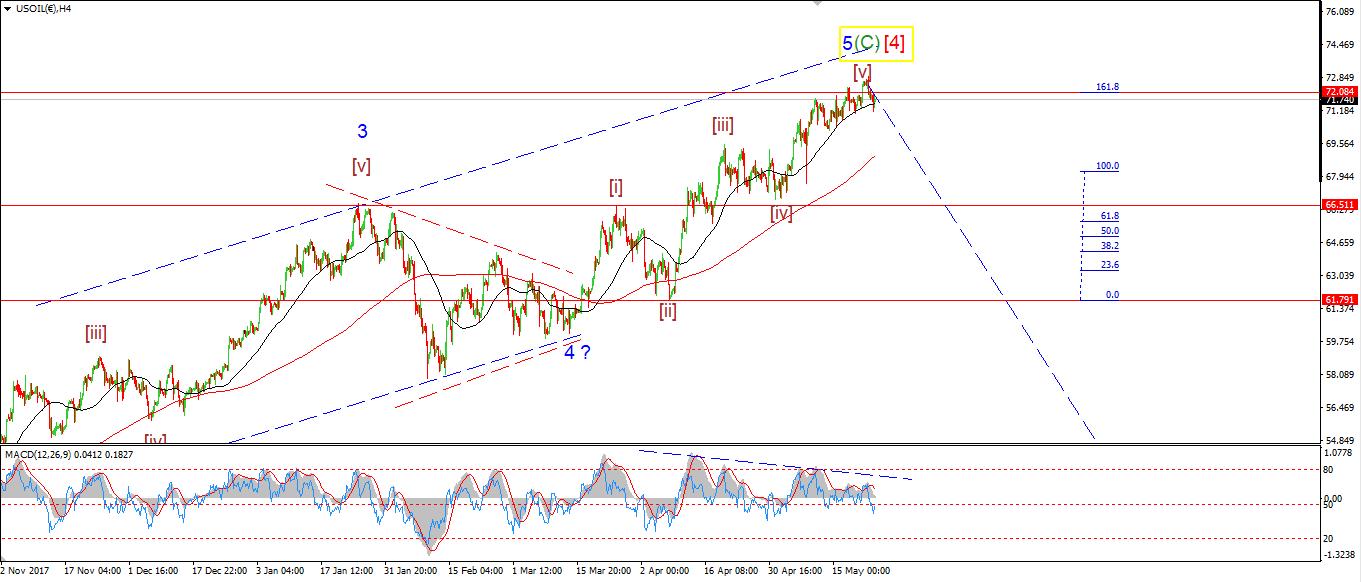 [/vc_column_text][vc_custom_heading text="Daily" use_theme_fonts="yes"][vc_column_text]
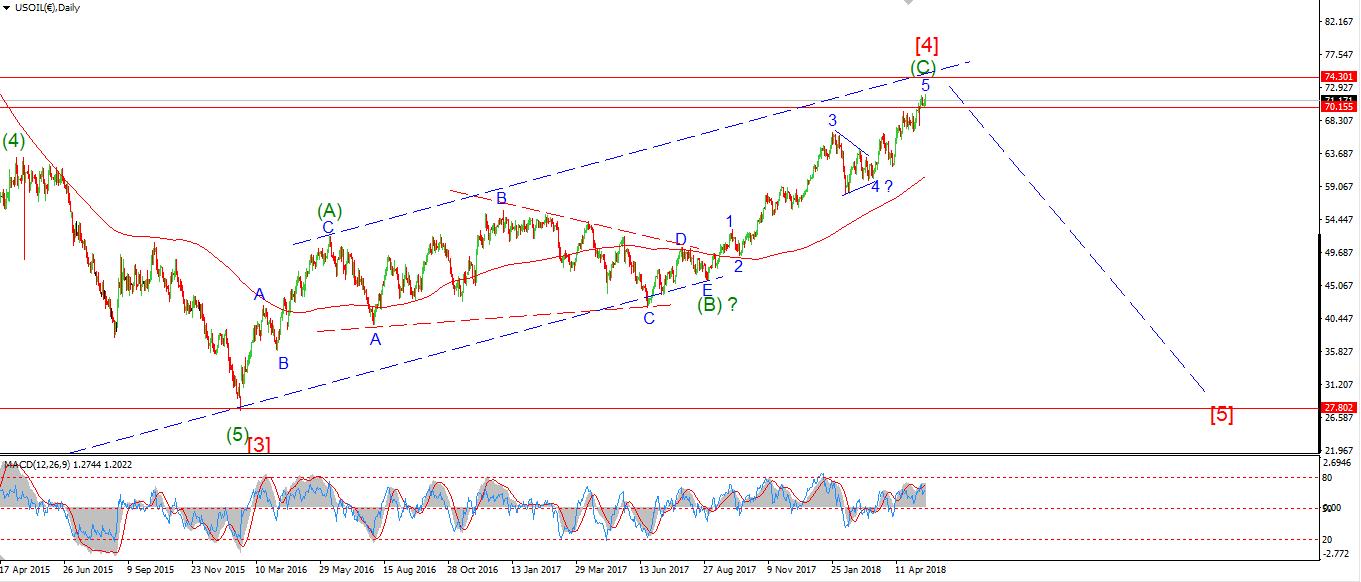 [/vc_column_text][/vc_column][/vc_row][vc_row][vc_column][vc_column_text]My Bias: topping in a large correction wave [4].
Wave Structure: Double combination higher in wave [4] red now complete.
Long term wave count: wave [5] target $20
On the 4hr chart you can see that crude has just created a momentum sell signal after todays drop.
The downward bias of momentum continues,
With a cyclical shift to negative momentum now in play.
The price broke through the 50MA today also,
This rally has weakened significantly now and the initial stages of a new bear-market are building.
I have labelled the drop off the high as wave 'i' pink,
followed by a possible running flat wave 'ii'.
The price should now continue lower in wave 'iii' of (i).
Tomorrow;
Wave 'ii' pink lies at 72.11, this level should hold.
70.75 marks the level of initial support.
Wave 'iii' should carry below before completing.
[/vc_column_text][/vc_column][/vc_row]
[vc_row][vc_column][vc_column_text]
[/vc_column_text][/vc_column][/vc_row]
[vc_row][vc_column][vc_separator border_width="5"][/vc_column][/vc_row]