
Good evening folks, the Lord’s Blessings to you all.
The short Christmas week comes to an end and there seems to be something brewing in the USD at least.
The significance of the reversal in the USD needs to be confirmed,
but if it is a strengthening move into wave [c] as in EURUSD,
then we will see this USD strength manifest across the rest of the markets, no doubt that USD strength will impact the metals and crude oil,
we will see if the stock market turns also.
So next week looks interesting from that point of view.
Lets see how the day went.
PS;
I will be uploading a video tomorrow morning.
And,
Monday is new years day,
so the markets will be closed as a result.
I will see you again on Tuesday night to kick off 2024, the year it all fell apart!
https://twitter.com/bullwavesreal
EURUSD.

EURUSD 1hr.

EURUSD 4hr.
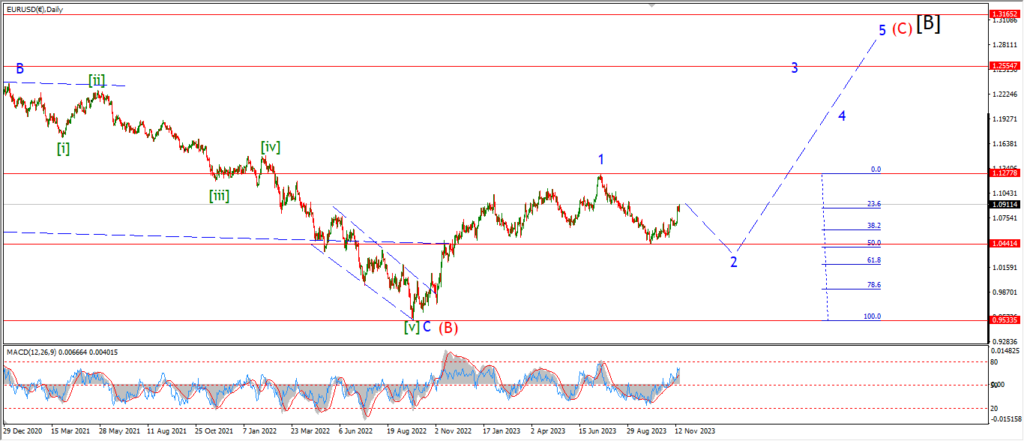
EURUSD daily.
EURUSD has held below Thursdays top at 1.1139 so far.
And the impulsive look to that move seems to be a little more likely after a corrective trade today.
I have marked the relevant supports below which will indicate a move into wave ‘i’ of (i) of [c] is underway.
Tuesday;
watch for wave ‘i’ to drop below 1.0965 again to signal the market is turning into wave (i) of [c].
GBPUSD

GBPUSD 1hr.

GBPUSD 4hr.
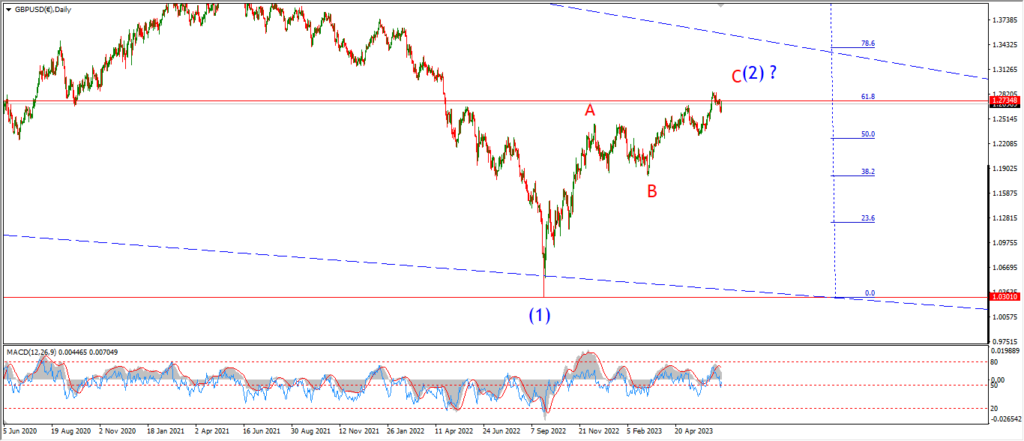
GBPUSD daily.
Cable has corrected today below the high at wave [c] of ‘2’ today.
I have labelled this as a possible wave ‘i’ and ‘ii’ pattern to begin wave (i) blue.
If this pattern is correct,
then we are in for a big move lower over the coming weeks as wave [i] of ‘3’ takes over the market.
Next week will tell us a whole lot about the next phase of this market.
Tuesday;
Watch for wave ‘i’ and ‘ii’ to hold below the highs at 1.2826.
Wave (i) blue must trace out five wave down as shown and break 1.2613 to confirm the pattern.
USDJPY.

USDJPY 1hr.

USDJPY 4hr.
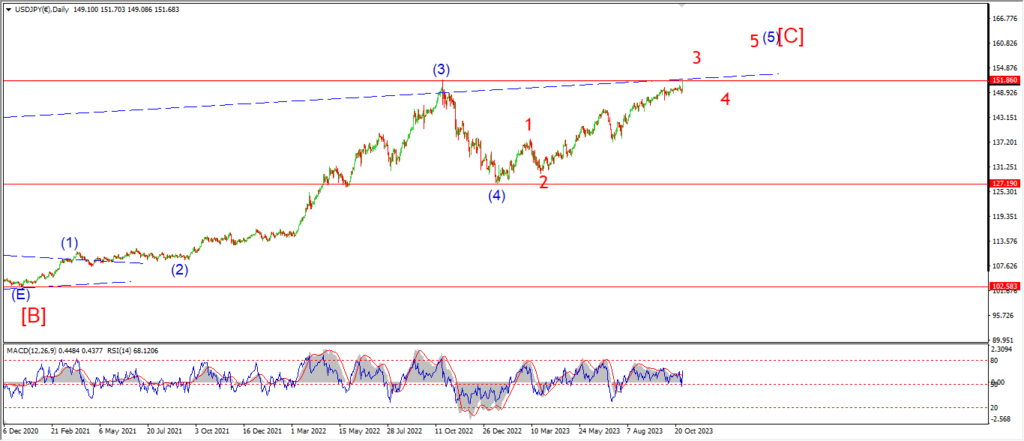
USDJPY daily.
USDJPY is getting much closer to a completed correction now after the last few days trading.
The patterns are lining up to compete an ending diagonal wave [c] next week.
And once that completes somewhere near 138.00 again,
then we can turn our attention higher again for the longer term.
Wave ‘5’ up is going to be a big one indeed with the minimum target at 151.00.
Tuesday;
Watch for three waves up in wave (iv) to complete near 143.00.
And then wave (v) will close out the wedge pattern with a drop below 140.27 again.
DOW JONES.

DOW 1hr.

DOW 4hr

DOW daily.
A small drop out of the wedge pattern today raises the possibility that wave (v) blue may be done now.
WE will see very soon on Tuesday how that plays out.
The low at wave (iv) is the level of interest here at 37000.
If we do manage to break that level again then we can begin building a pattern to the downside again.
Its a case of hands off for the moment!
Tuesday;
Lets see if this wedge pattern in wave (v) holds and if the market can turn lower in an impulsive way again.
GOLD

GOLD 1hr.

GOLD 4hr.

GOLD daily.
Gold has ended the week with a possible completed three wave pattern in wave (ii) blue.
The decline off that wave (ii) top has not proved anything yet,
but I will give this a chance next week to see if wave ‘i’ can carry the price back below initial support at 2015 again.
That will be the first indication that wave (iii) is underway.
Tuesday;
Watch for wave ‘i’ of (iii) to trace out five waves down to break 2015 again.
This will build the case for a larger decline into wave (iii) of [c] to complete wave ‘2’.
CRUDE OIL.

CRUDE OIL 1hr.

CRUDE OIL 4hr.
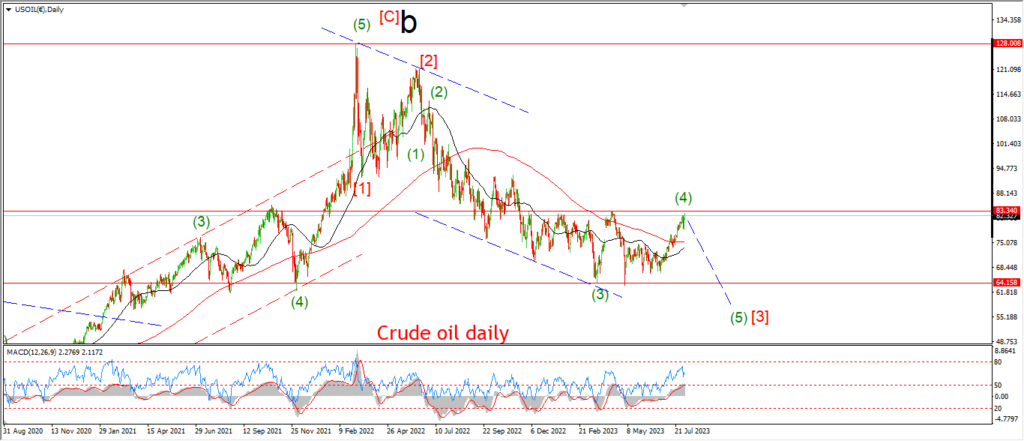
CRUDE OIL daily.
Wave (b) has retraced a full 50% of the rally in wave (a) at todays lows.
The market is now in a good position to look for this correction to complete and for the next wave up to begin.
Wave (c) should reach back above 76.18 again at a minimum.
But I am looking for wave (c) to close out the channel and complete wave [iv] closer to 79.00 again if all goes to plan.
Tuesday;
Watch for wave (b) to complete this decline and then turn higher to begin wave ‘i’ of (c).
A break above 74.00 again will signal wave (c) has begun.
S&P 500.

S&P 500 1hr

S&P 500 4hr

S&P 500 daily.
The drop off this weeks high again today comes as the market approaches that all time higher level again.
So We can say that we have some jitters showing here as the market extends towards the highs again.
I cant read anything into this here until we get a significant drop back to break support at wave ‘iv’.
and that will take another few days to happen, if it happens at all.
Even if we break to a new high here it only serves to extend this rally to an even bigger extreme.
And this will bring its own consequences next year.
Tuesday;
watch for the all time high to hold again for wave ‘2’ to remain a valid interpretation.
4691 marks the initial support to watch next week.
SILVER.

SILVER 1hr

SILVER 4hr.
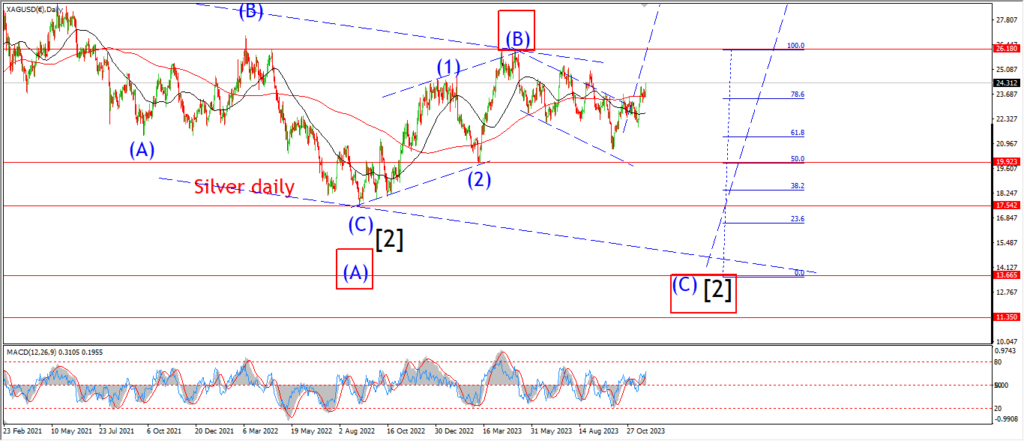
SILVER daily.
Silver hit the minimum target for wave ‘ii’ today by breaking the wave ‘a’ low at 23.64.
If this pattern is correct here,
then we are looking at a possible wave ‘iii’ of (iii) rally beginning next week.
If the market breaks above the previous wave ‘b’ high at 24.59,
that will suggest wave ‘1’ of ‘iii’ has begun.
Tuesday;
Watch for the low at wave ‘ii’ to hold at 23.52.
Wave ‘1’ of ‘iii’ must rally back above 24.59 to confirm the pattern.
BITCOIN

BITCOIN 1hr.
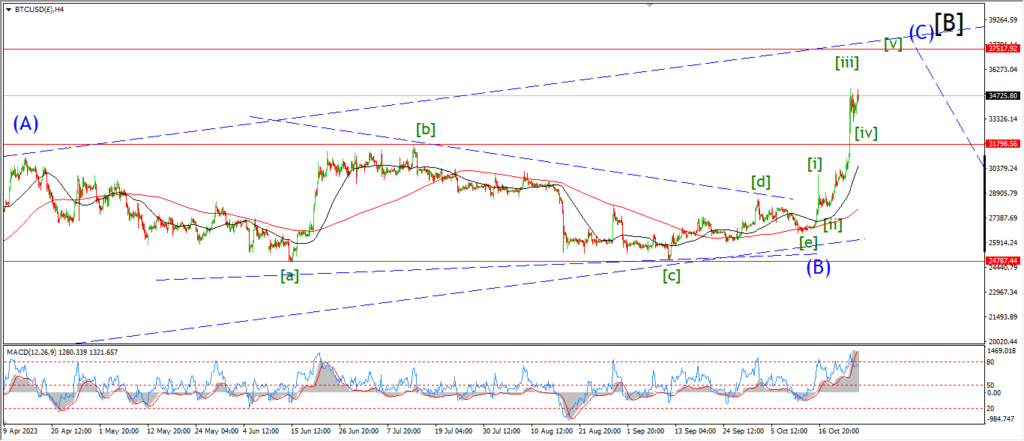
BITCOIN 4hr.
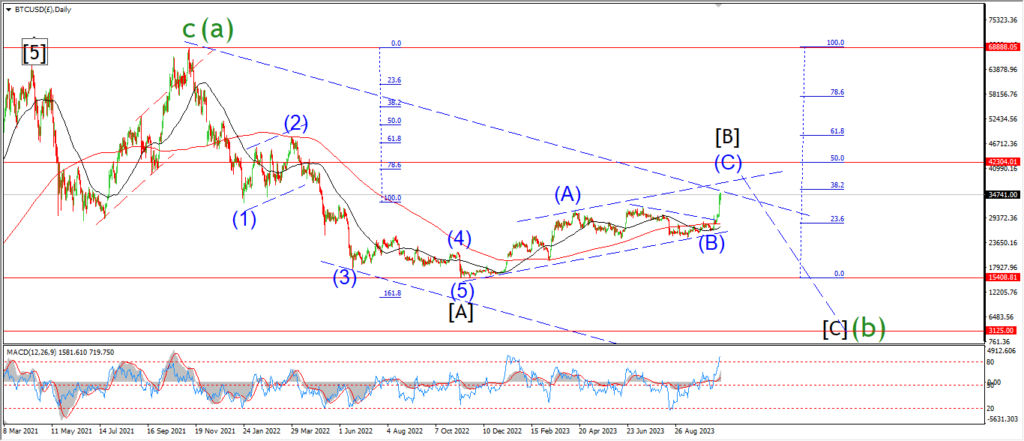
BITCOIN daily.
….
FTSE 100.

FTSE 100 1hr.
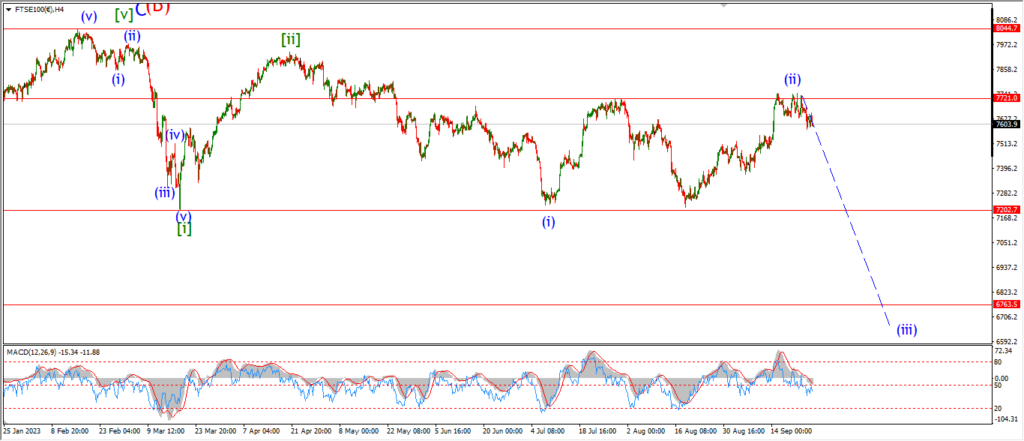
FTSE 100 4hr.

FTSE 100 daily.
….
DAX.

DAX 1hr
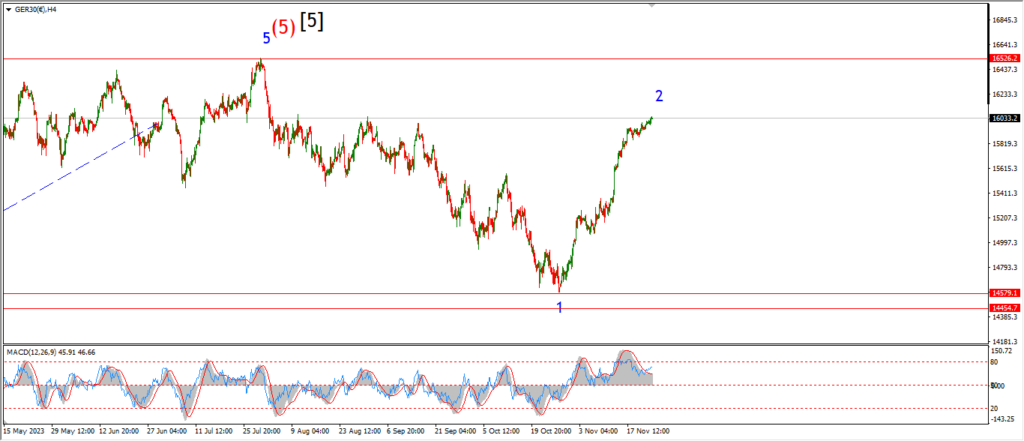
DAX 4hr

DAX daily.
….
NASDAQ 100.

NASDAQ 1hr
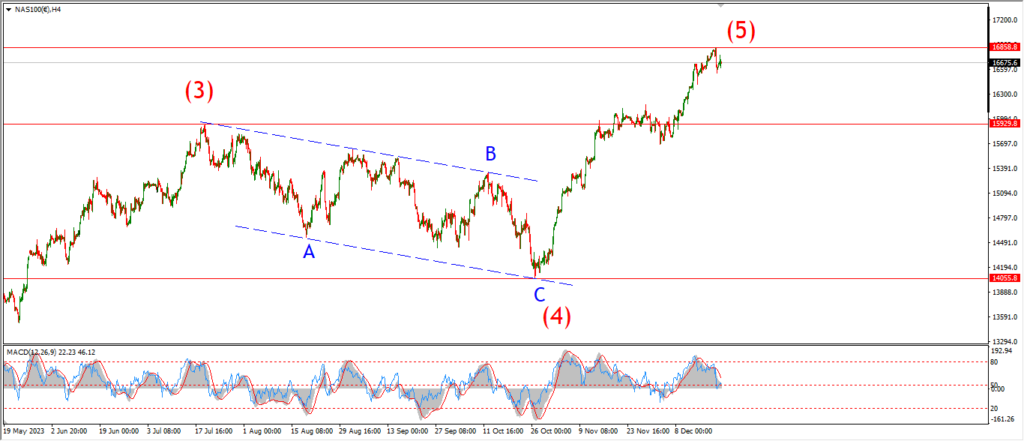
NASDAQ 4hr.
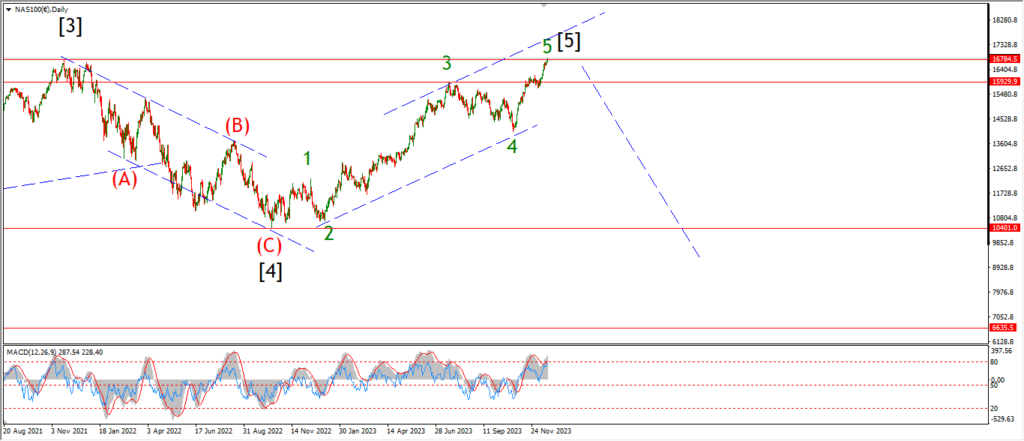
NASDAQ daily.
….