
Good evening to one and all.
The Lord’s Blessings to you all.
This is Christmas week,
and of course the market will slow down towards the end of this week as a result as the inevitable travel plans of many kick into gear.
I will be taking a few days off over the next week or so to unwind and celebrate the first advent of the Messiah those many moons ago! And also to thank Messiah Yeshua for paying the price for my sin on that cross. In the end, that is the reason for this season, whether people want to acknowledge that or not!
This week will be service as normal and maybe I will take Friday evening off, I’m not sure yet! I will let you know in advance!
Ok, down to business.
https://twitter.com/bullwavesreal
EURUSD.
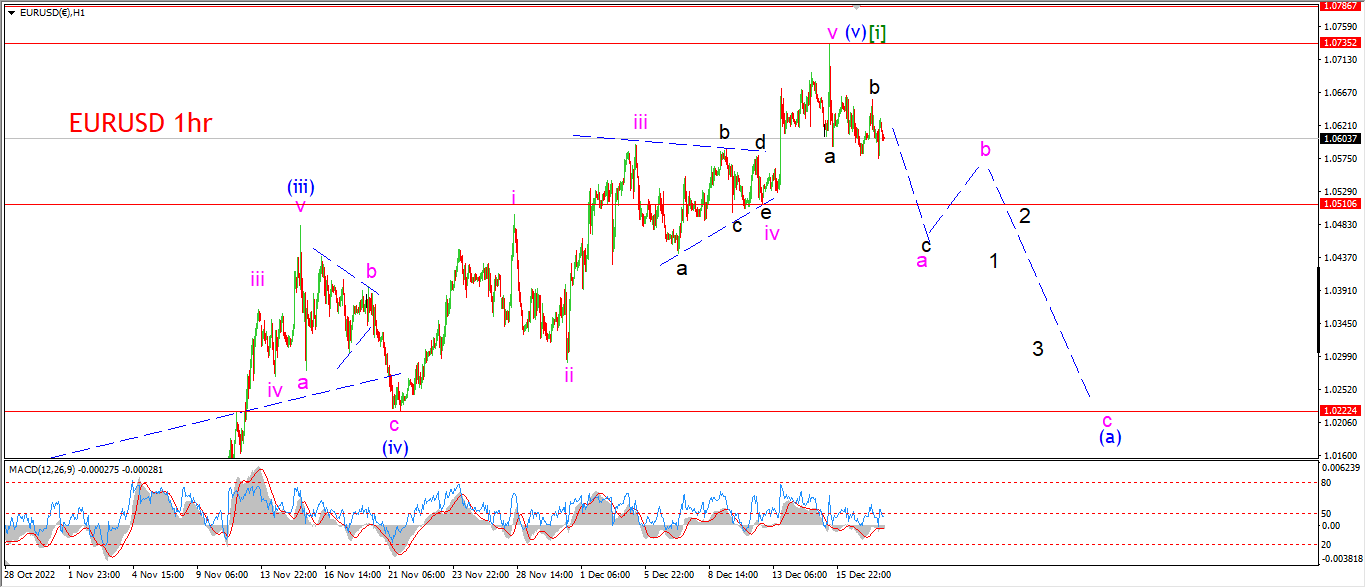
EURUSD 1hr.
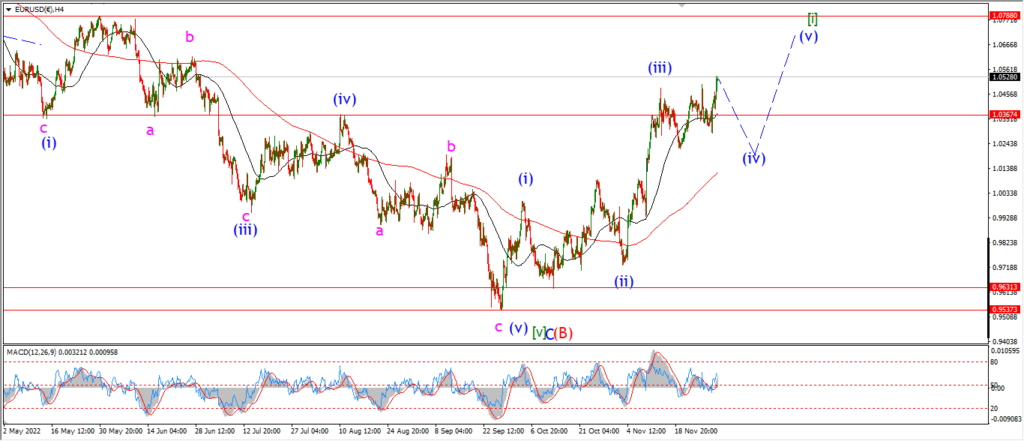
EURUSD 4hr.

EURUSD daily.
I have indicated a small ‘a’ ‘b’ pattern in place off the high at wave [i] tonight.
this pattern is slightly different to Fridays count,
but the outcome is the same overall for wave (a).
This pattern should lead to a further sharp decline this week as wave (a) develops.
But even though there is a bearish impulse wave in place off that high,
I cannot confirm that wave [i] is complete until we see a break of initial support at 1.0510.
Once that level breaks there is a clear drop into 1.0222 at the previous wave (iv) and three waves down should take us at least that far in wave (a).
Tomorrow;
Watch for the price to hold below the wave [i] top for the foreseeable future.
A break of 1.0510 will favor this count and complete wave ‘a’.
GBPUSD
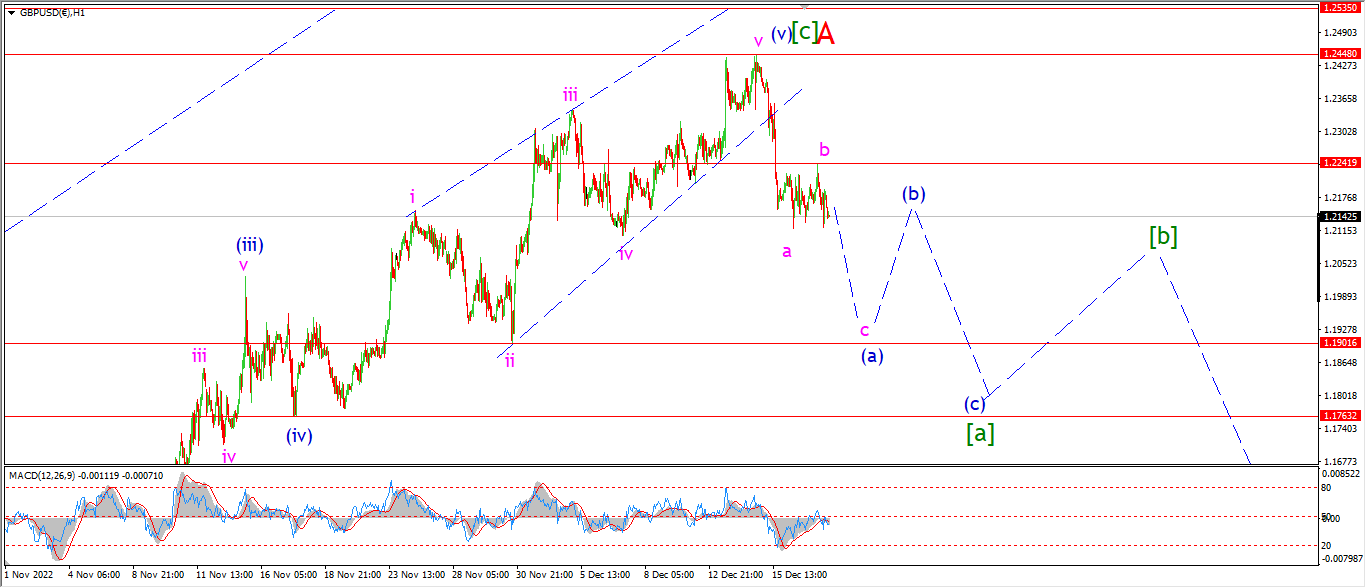
GBPUSD 1hr.
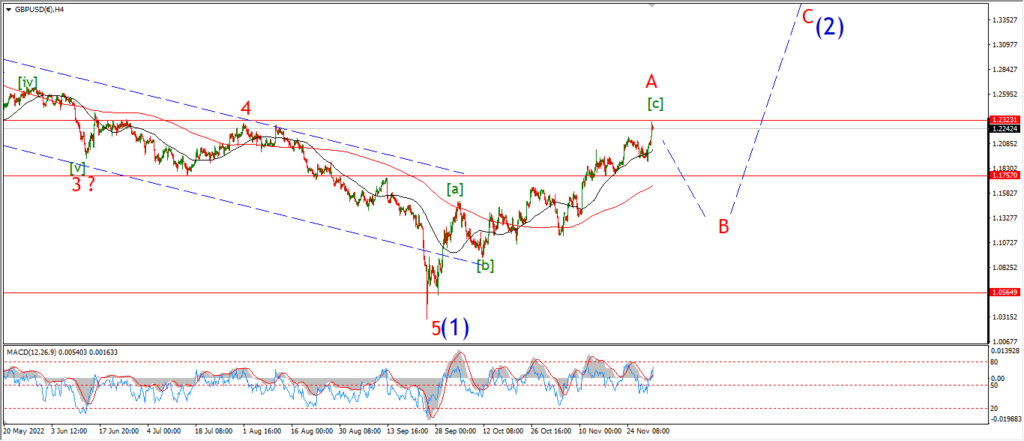
GBPUSD 4hr.

GBPUSD daily.
A slightly different count for cable tonight also.
The price completed a three wave correction higher in wave ‘b’ at todays high.
and now the drop into the low of the session should begin wave ‘c’ of (a) as shown.
The price must hold below wave ‘b’ at 1.2241.
And wave ‘c’ of (a) should trace out five waves lower over the coming days.
Tomorrow;
WAtch for wave ‘b’ to hold.
Wave ‘c’ is expected to fall below 1.20 at a minimum.
there is an internal support level at 1.1900 again that is a reasonable target for wave (a) to complete.
USDJPY.
USDJPY 1hr.
USDJPY 4hr.

USDJPY daily.
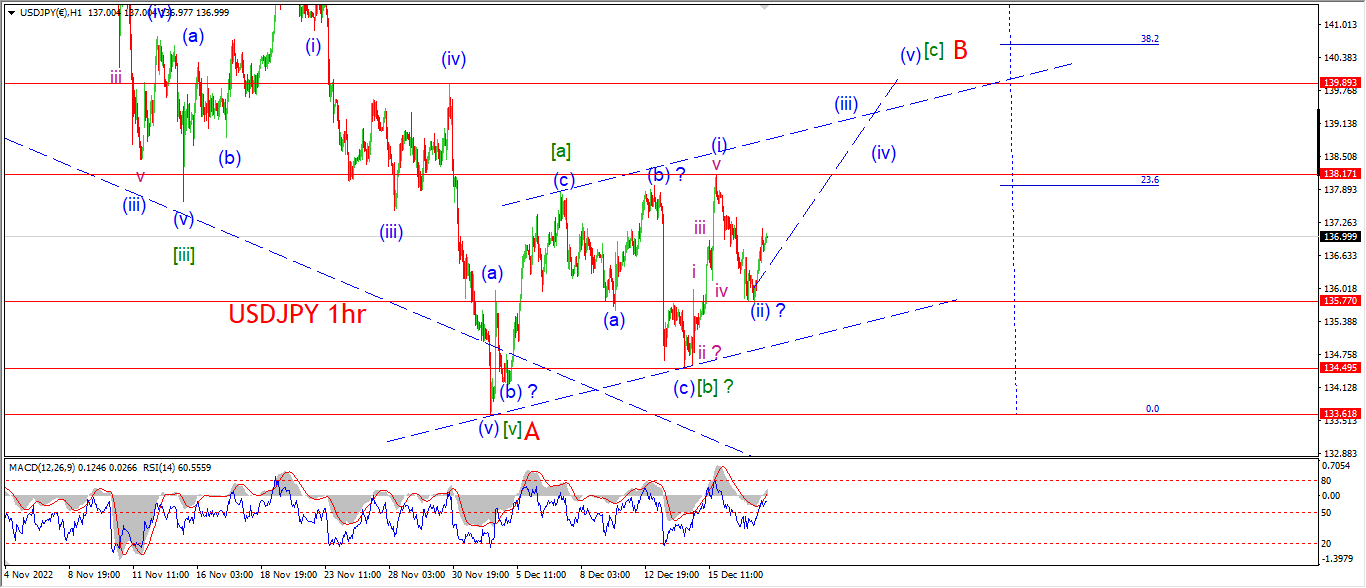
I have switched to the alternate count this evening for wave ‘B’ red.
Again,
this does not change much in terms of the overall target for wave ‘B’ at or near 140.00.
But the change in pattern does suggest wave [b] is complete and wave [c] is already underway.
A five wave rally should take us up towards that 140.00 area to complete the lower high.
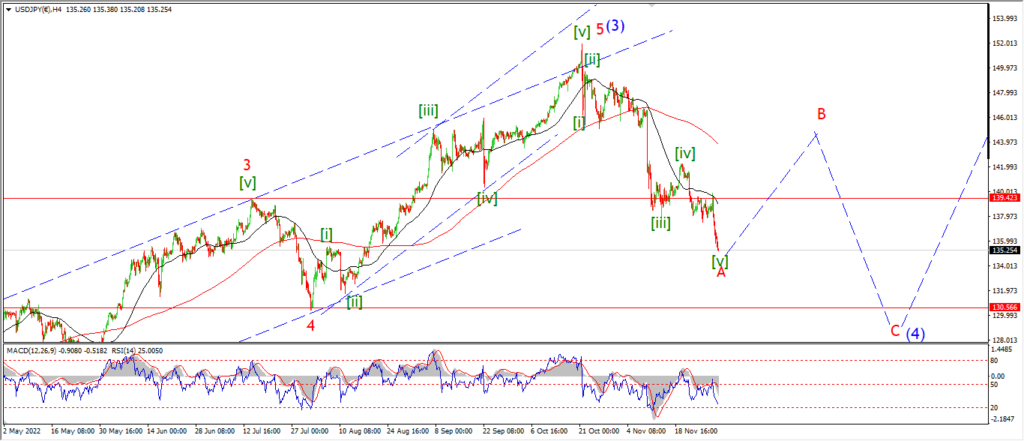
and then wave ‘C’ is turn lower again early next year.
Tomorrow;
The rest of this week should be dominated by this wave [c] rally.
Watch for wave (ii) to hold at 135.77.
Wave (iii) of [c] should break above 138.00 at a minimum.
DOW JONES.
DOW 1hr.
DOW 4hr
DOW daily.
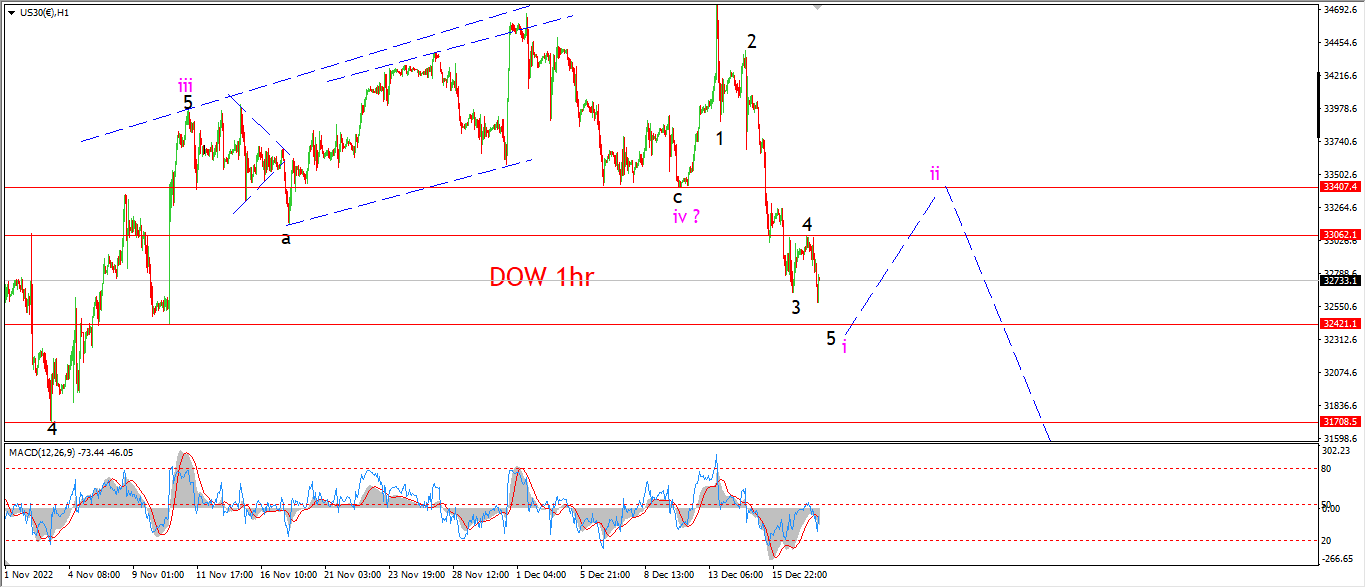
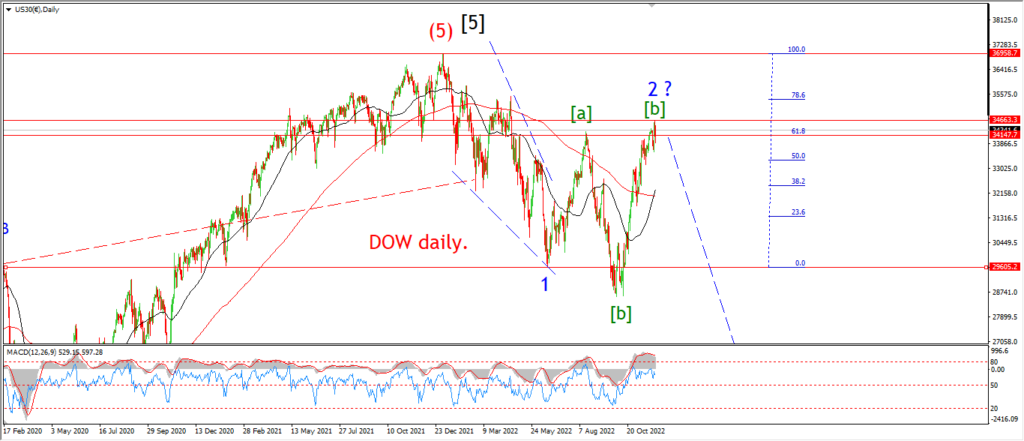
We have a new low this evening as I write and this action has confirmed the main count for wave ‘i’ pink.
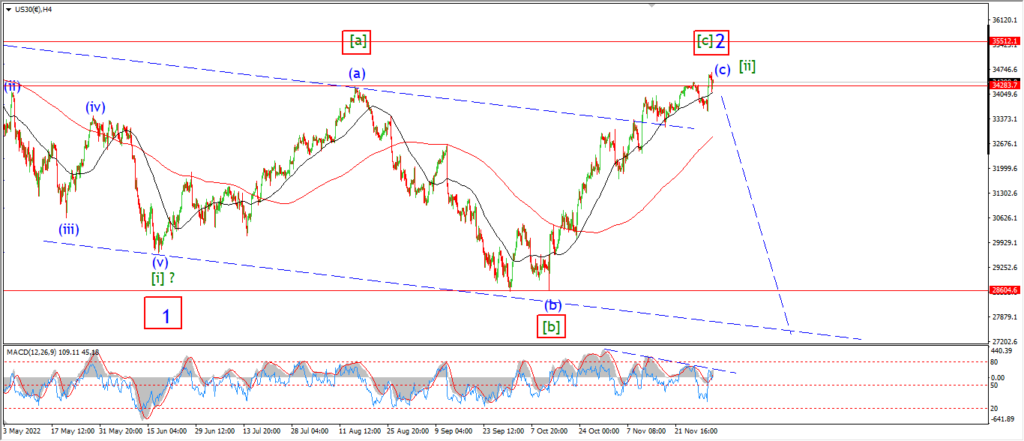
We do have a pretty solid five wave pattern now in place off the high at wave [ii].
So technically wave ‘i’ pink is complete at this evenings lows.
But I would like to see a break of the next support level at 32400 to complete wave ‘i’.
The more support levels the market breaks through,
the better the probability becomes of that a major shift into wave [iii] is now underway.
If the main count is correct then we will likely see a bounce into wave ‘ii’ pink starting midweek,
and in this case I would like to see wave ‘ii’ hold below 33400 at the wave ‘iv’ low.
Tomorrow;
Watch for wave ‘5’ of ‘i’ to complete with a break of the next support at 32400.
That would complete a satisfactory five wave decline off the top of wave [ii].
There is one more lower support level at 31700,
I don’t expect wave ‘i’ will reach that low,
but I would welcome it if the market managed to fall that far!
GOLD
GOLD 1hr.
GOLD 4hr.

GOLD daily.
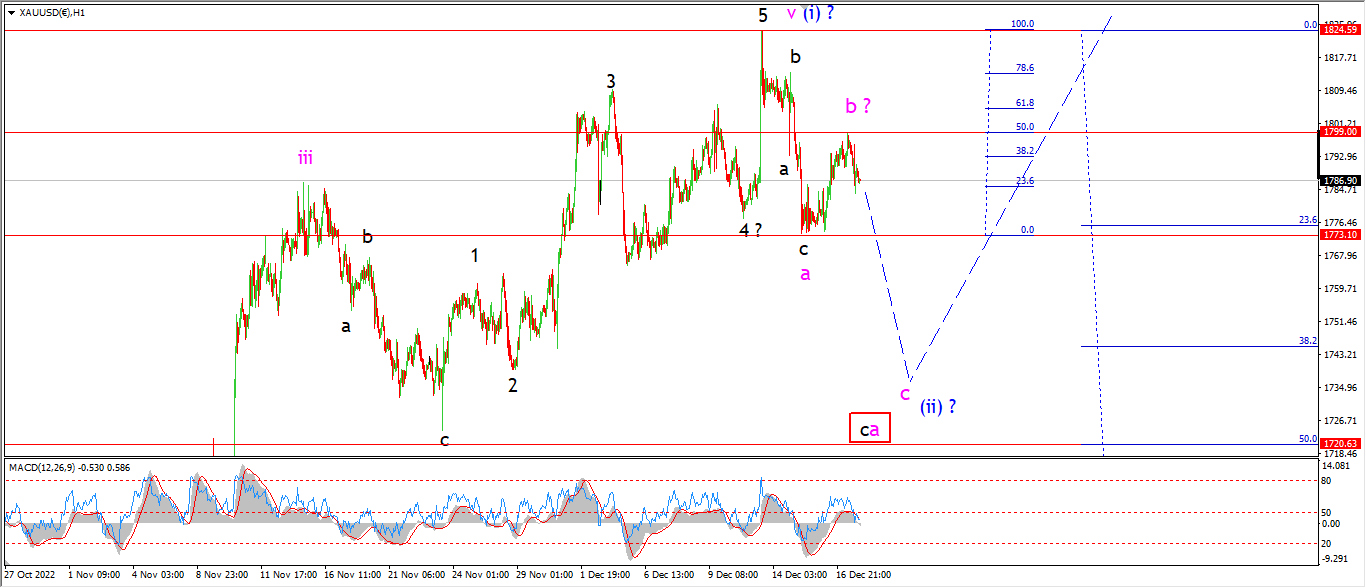
Gold managed to tag the 50% retracement level of wave ‘a’ at the top of the session today.
The price has retreated pretty sharply off that 1799 top this evening,
and that action does add weight to the idea that wave ‘a’ and ‘b’ are now complete.
So I will be expecting a further decline into wave ‘c’ for the rest of this week.
And if we see a break of 1773 again at wave ‘a’,
that will signal wave ‘c’ is underway.
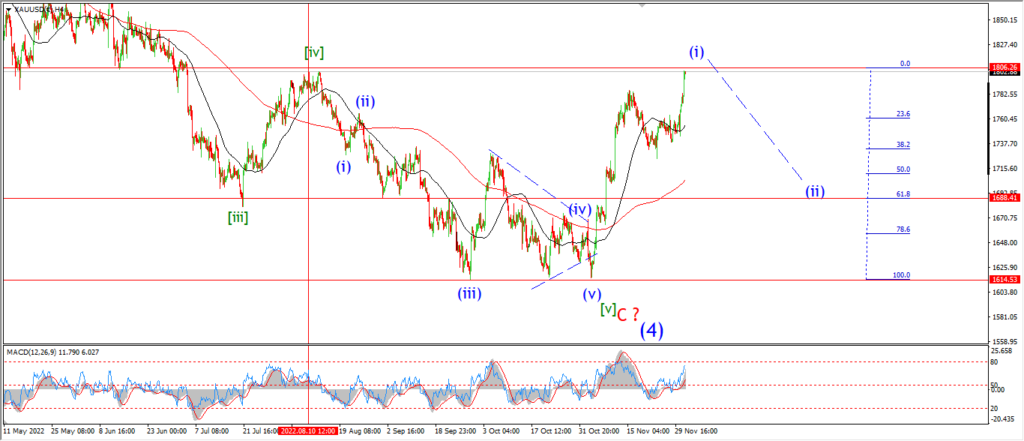
1720 marks the previous wave ‘iv’ low and this level also marks the 505 retracement level of the wave (i) rally.
so that is a good initial traget for wave (ii) to complete.
Tomorrow;
watch for wave ‘b’ to hold at 1799.
Wave ‘c’ should head lower towards the 1720 area in a five wave pattern as shown.
CRUDE OIL.
CRUDE OIL 1hr.
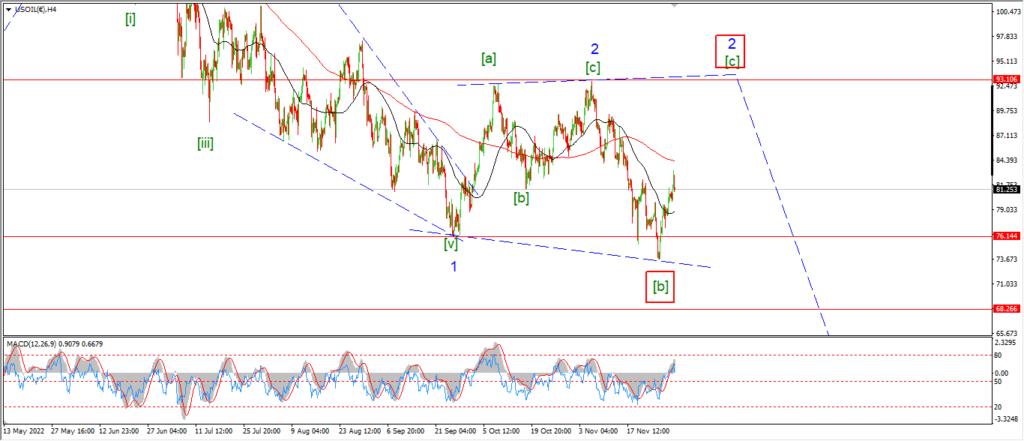
CRUDE OIL 4hr.
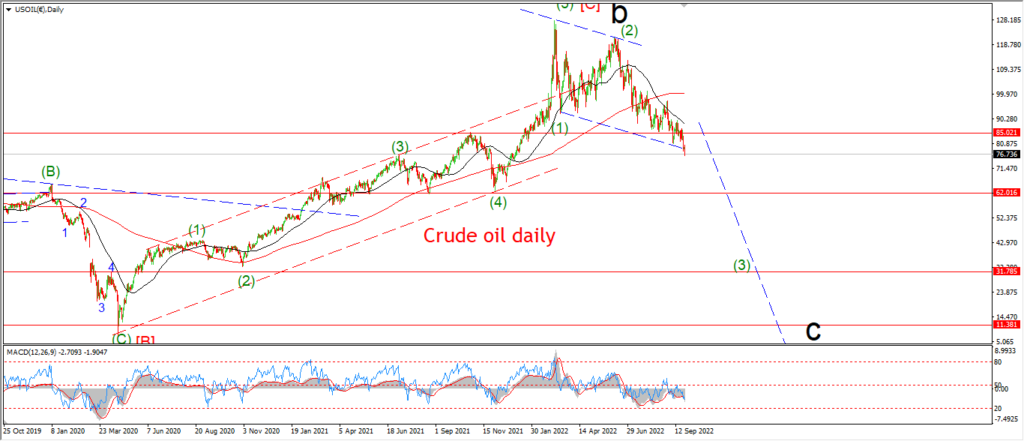
CRUDE OIL daily.
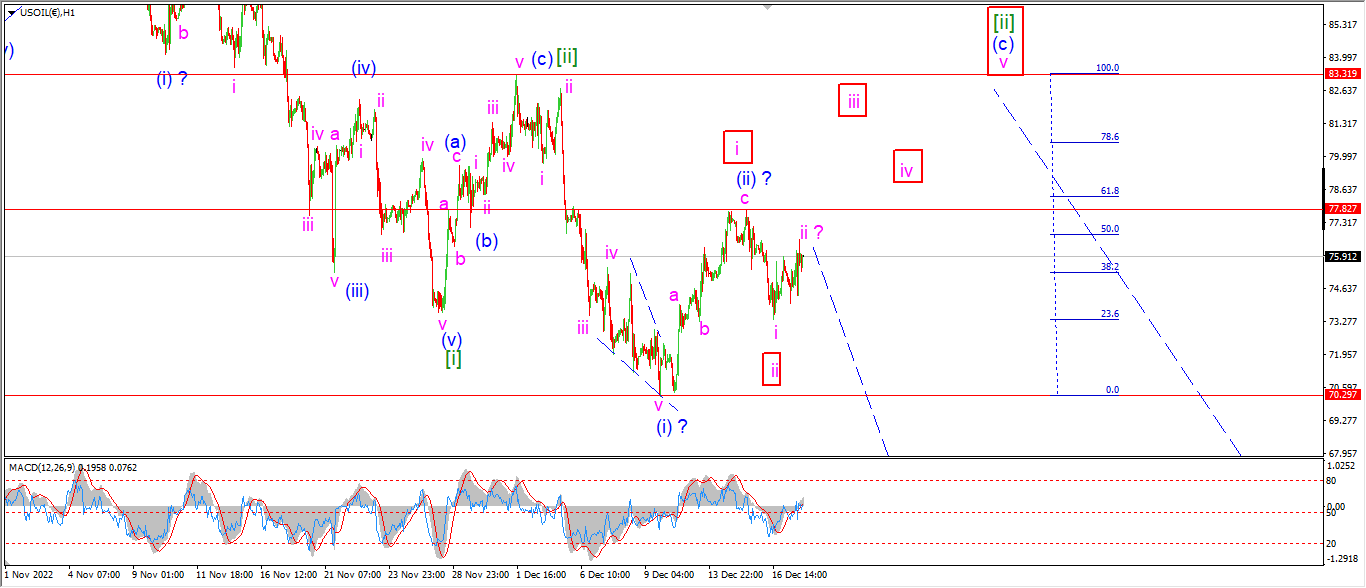
Crude is managing to grind its way higher in overlapping step today but even so,
it is hard to look at this action as an impulse wave higher as suggested by the alternate count,
but I cannot rule out that alternate count as of yet.
If we do see break above the wave (ii) high at 77.82 again,
then I will be forced to consider that alternate count more seriously.
For the moment,
This action can be viewed as a correction higher in wave ‘ii’ of (iii).
And this calls for a sharp decline into wave ‘iii’ of (iii) this week.
We will know soon enough if that comes about.
Tomorrow;
Watch for wave ‘ii’ to hold below 77.82.
A break down below 70.29 again will signal wave ‘iii’ is underway.
S&P 500.
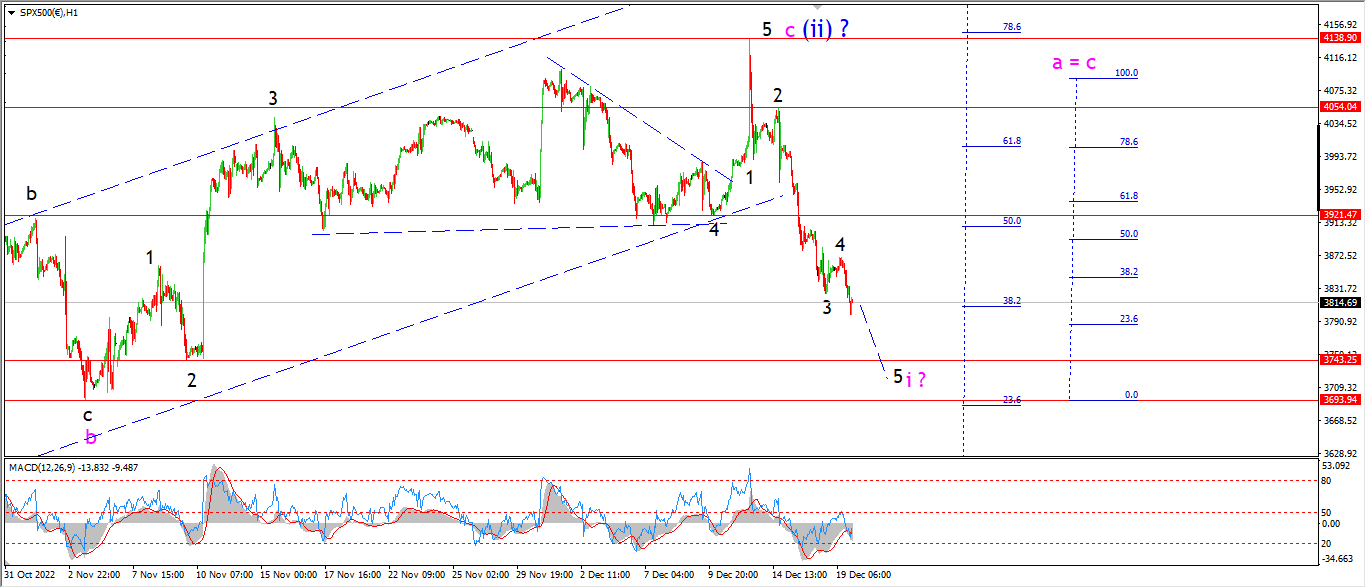
S&P 500 1hr
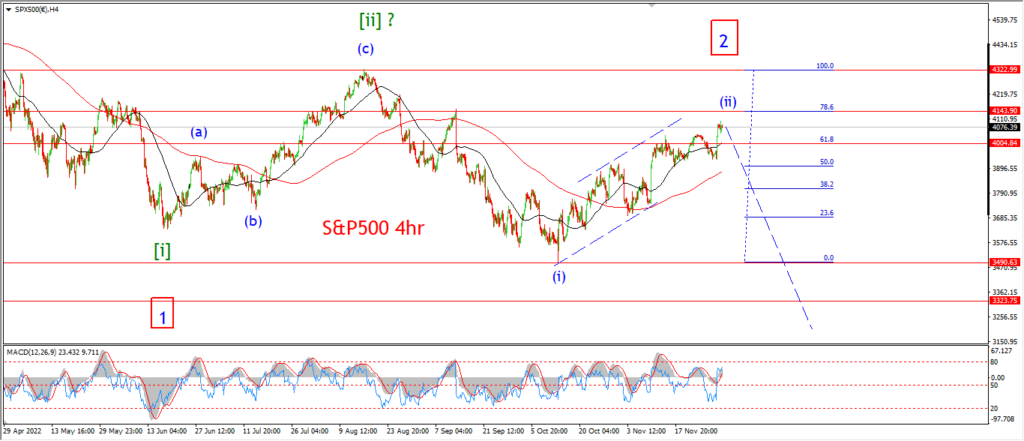
S&P 500 4hr
S&P 500 daily.
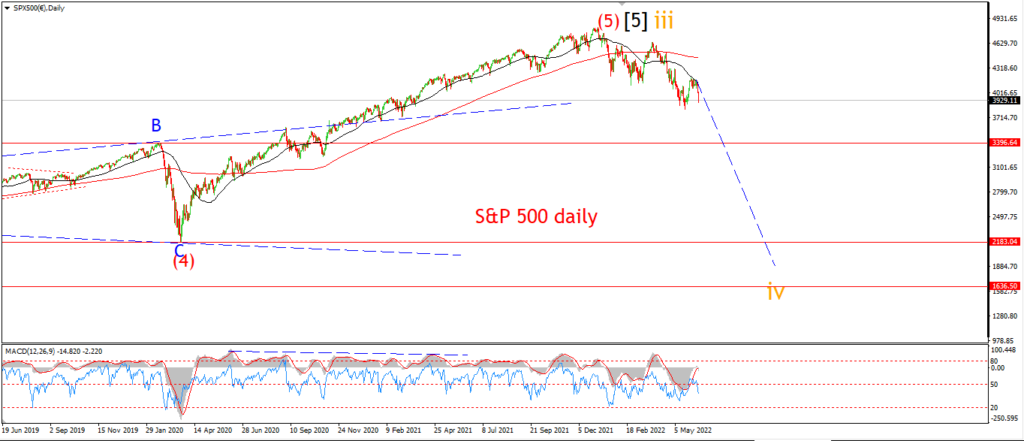
Todays decline is a welcome addition to the ongoing pattern in wave ‘i’ pink.
The market has made a new low today,
and this new low has met the minimum expectation for wave ‘i’ down.
The pattern may have hit the minimum target,
but I would like to see a break of that initial support level at wave ‘2’ which lies at 3743 to complete wave ‘i’.
As I mentioned in the dow,
the more supports we can take out – the more likely that we have a top in wave (ii) now complete.
And ontop of that,
the more likely that a major decline into wave (iii) is now underway.
This weeks trade will reveal a whole lot about where this market is headed overall.
A confirmation of wave (iii) down will be a big deal!
Wave (iii) of [iii] has the potential to break below the 3000 level in quick succession.
So the new year might start with a major hit to the market in a third of a third waterfall type decline.
This is the ‘big one’ that I have warned about.
So this week may prove a key point in this developing bearmarket.
Tomorrow;
Watch for wave ‘i’ of (iii) to continue lower towards support at 3743 again to complete.
A break of the next lower support at 3693 will be enough to signal wave (iii) of [iii] is actually underway now.
SILVER.
SILVER 1hr
SILVER 4hr.
SILVER daily.
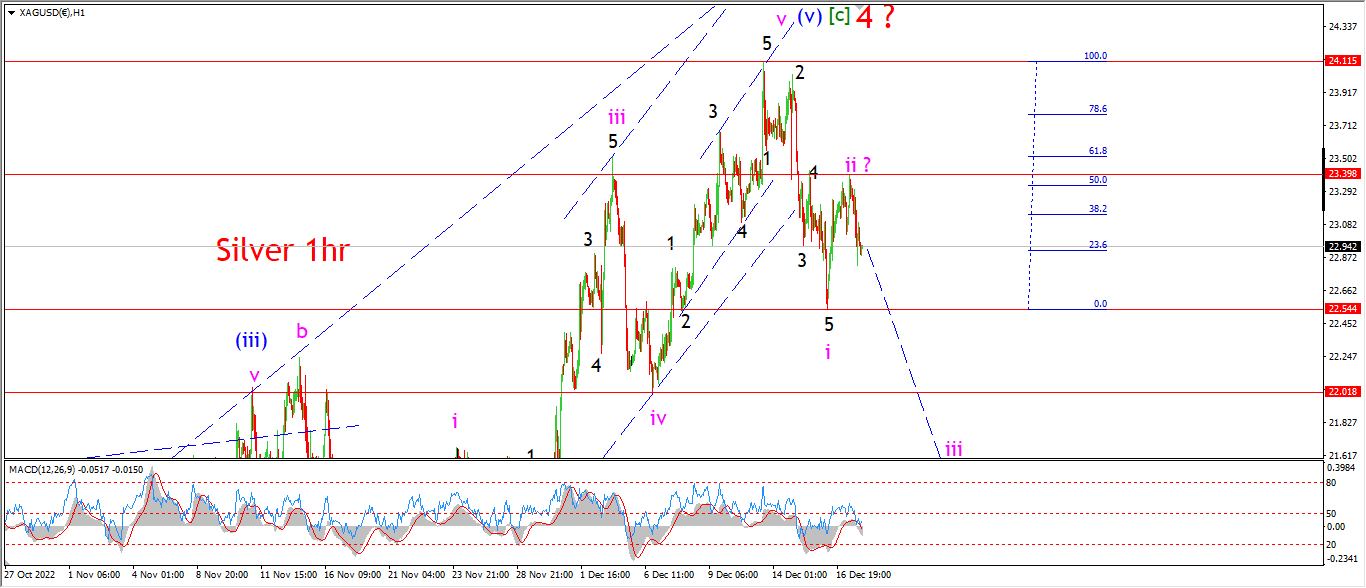
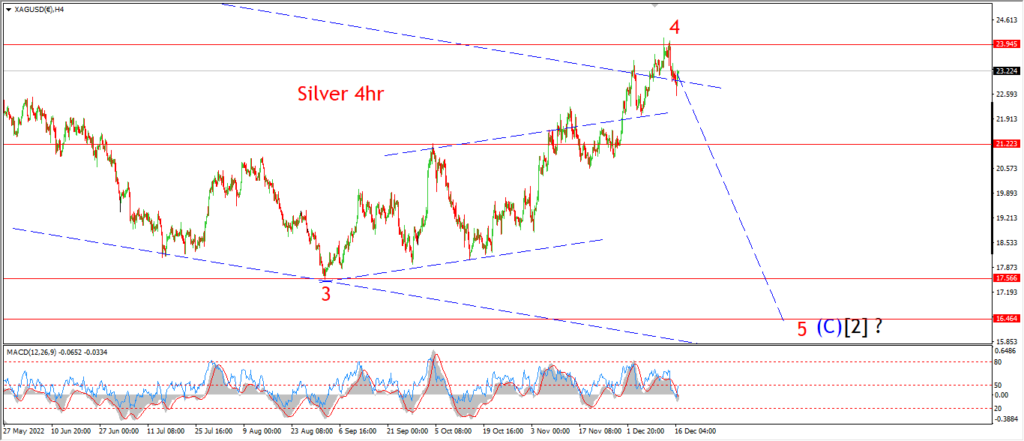
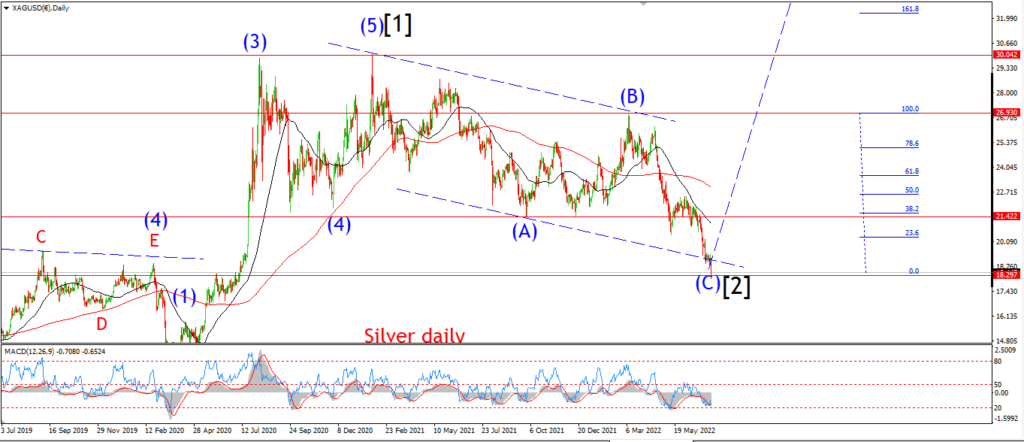
Silver is well on its way to completing a head and shoulders pattern around the recent highs at wave ‘4’.
WAve ‘i’ down completed a nice five wave decline off the top last week,
and the price seems to have peaked today in wave ‘ii’ pink with a break above the 50% retracement level of wave ‘i’.
The decline this afternoon in silver is a signal that wave ‘ii’ is complete now,
and wave ‘iii’ down is underway.
If this count is correct,
then we should see a significant decline take place this week in wave ‘iii’.
And wave ‘iii’ can easily fall into the previous support level at 21.20 again to complete.
Tomorrow;
Watch for wave ‘ii’ to hold at 22.39.
Wave ‘iii’ of (i) should continue lower for at least the next few sessions.
BITCOIN
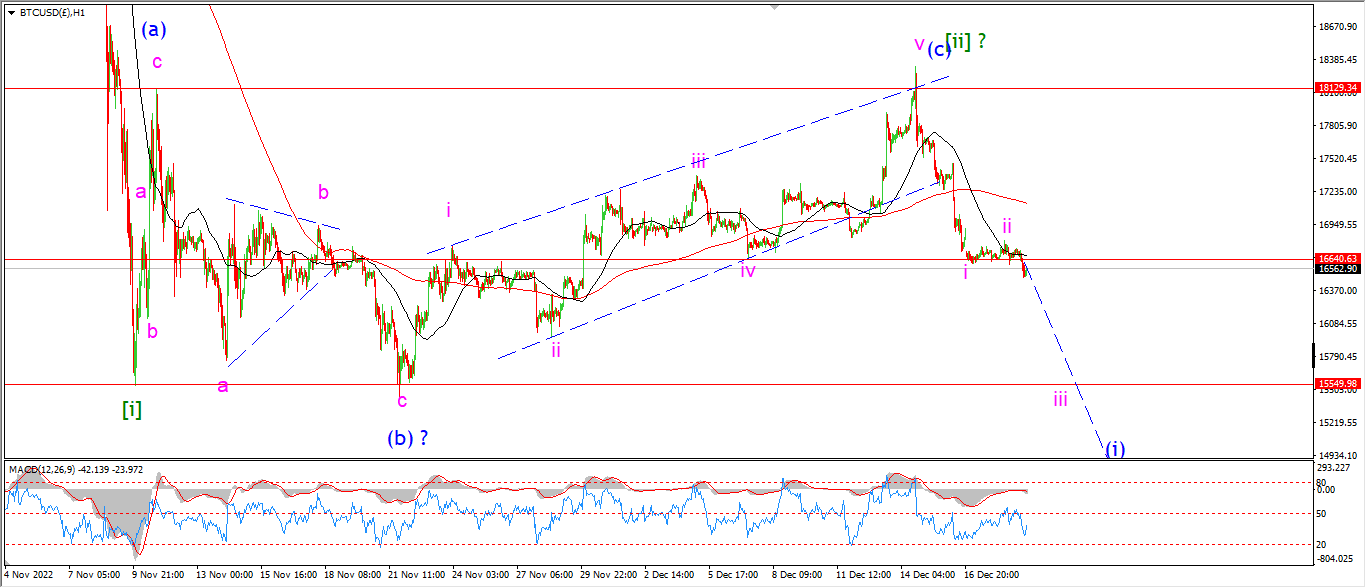
BITCOIN 1hr.
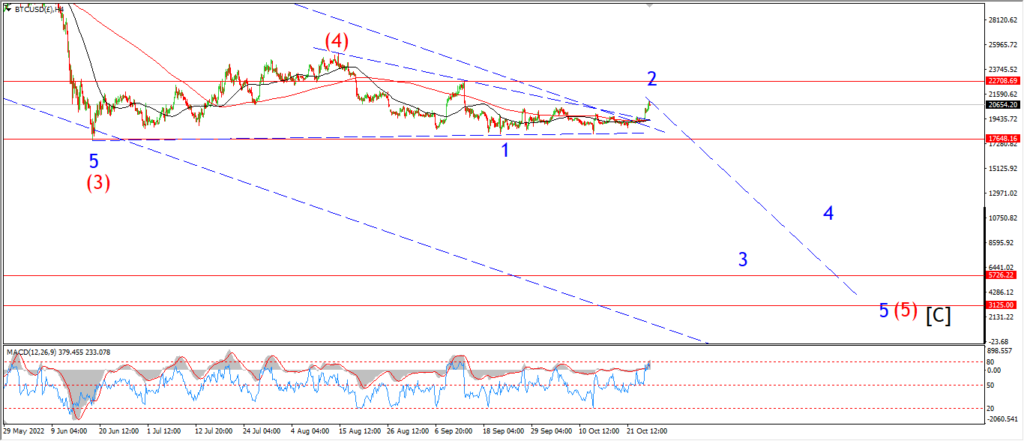
BITCOIN 4hr.

BITCOIN daily.
….
FTSE 100.
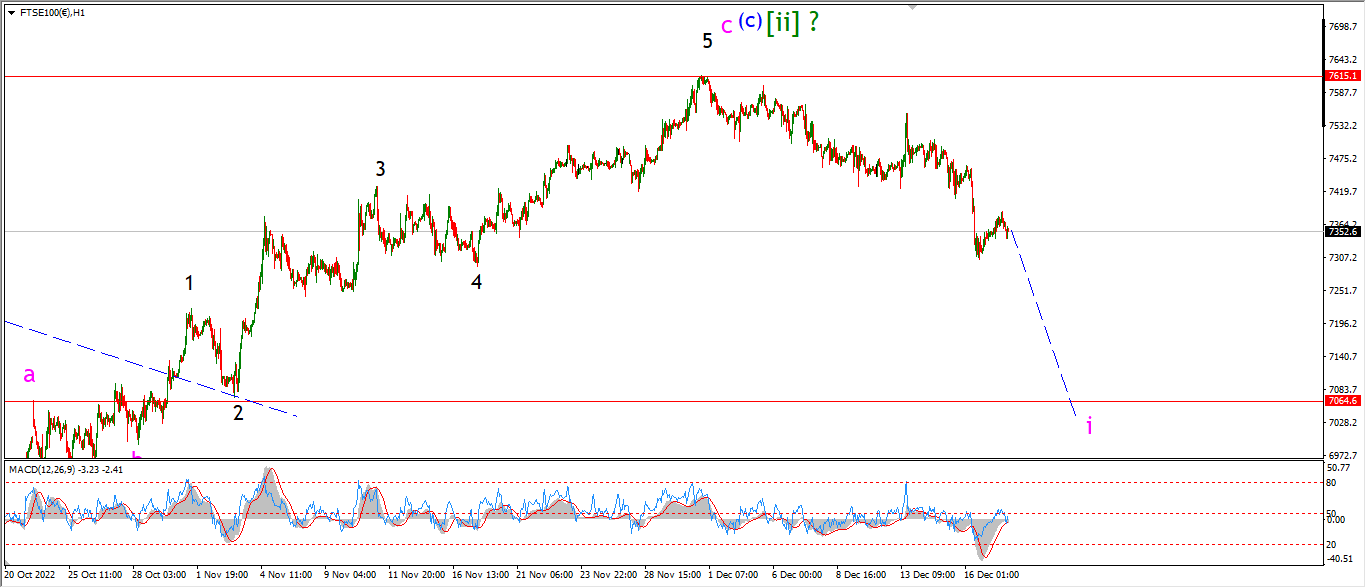
FTSE 100 1hr.
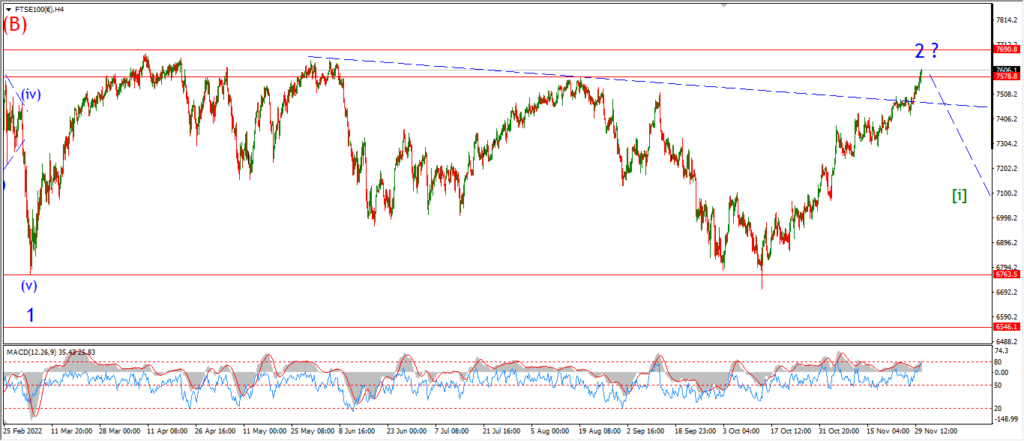
FTSE 100 4hr.

FTSE 100 daily.
….
DAX.
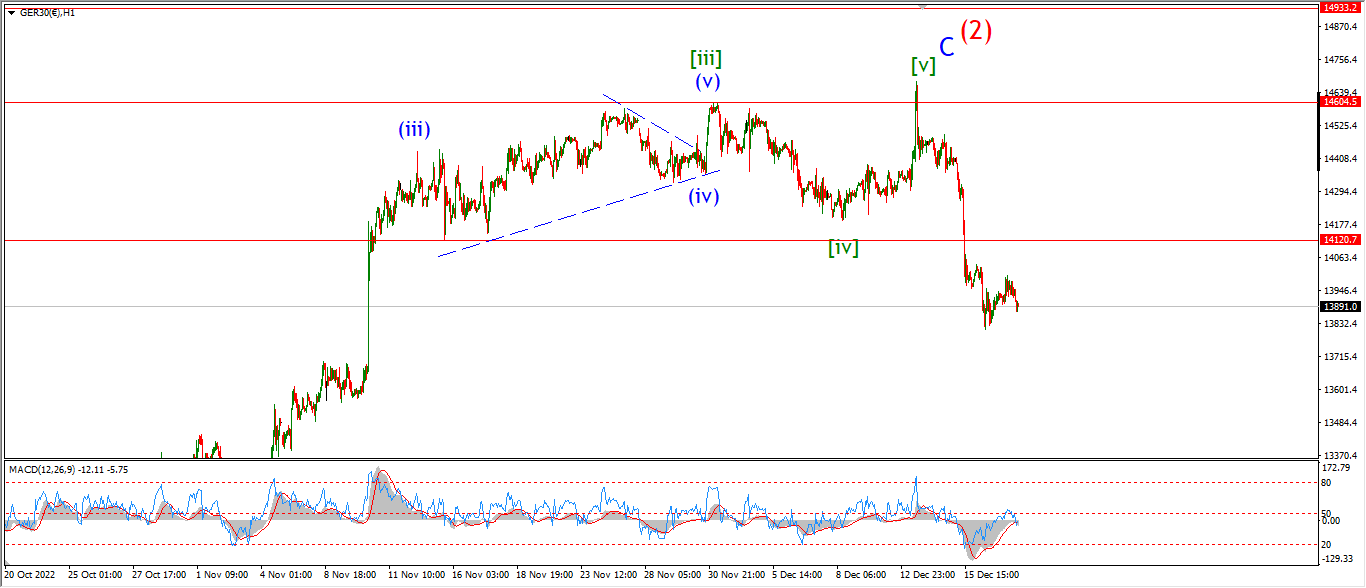
DAX 1hr
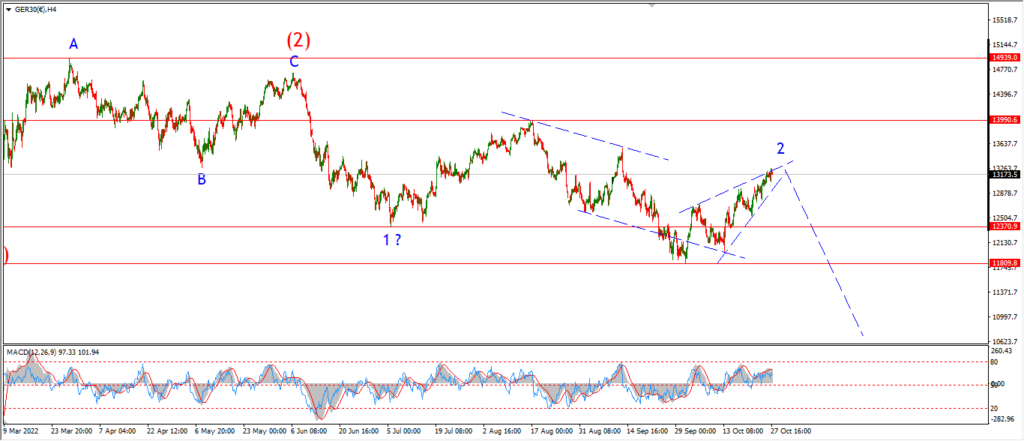
DAX 4hr

DAX daily.
….
NASDAQ 100.
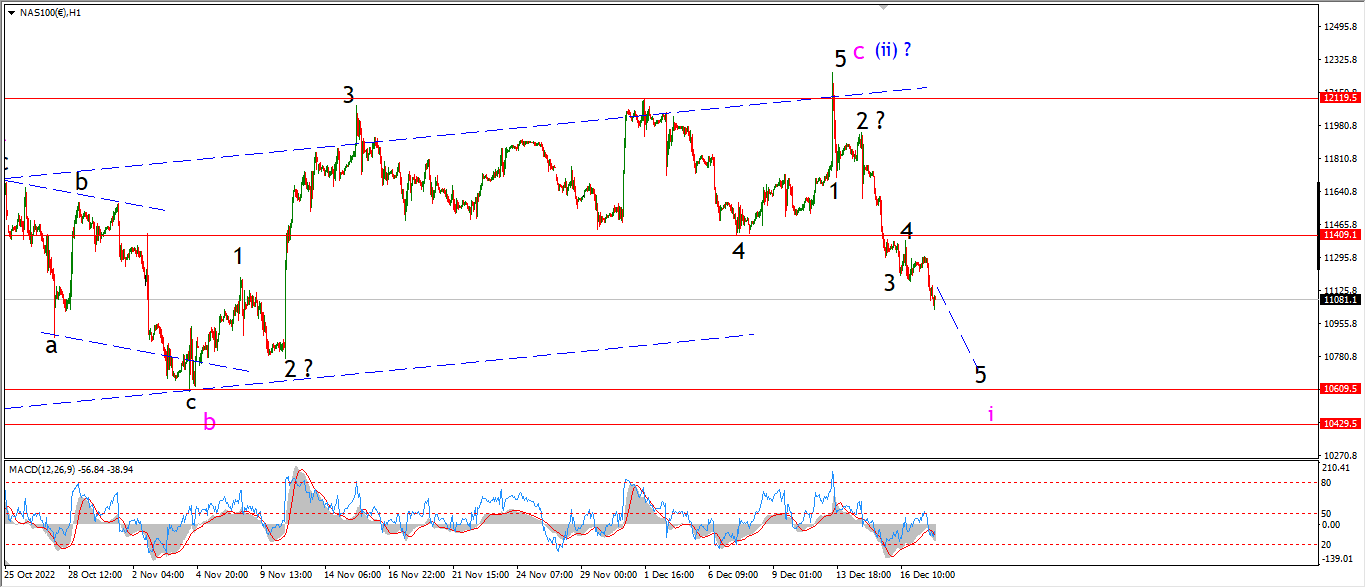
NASDAQ 1hr
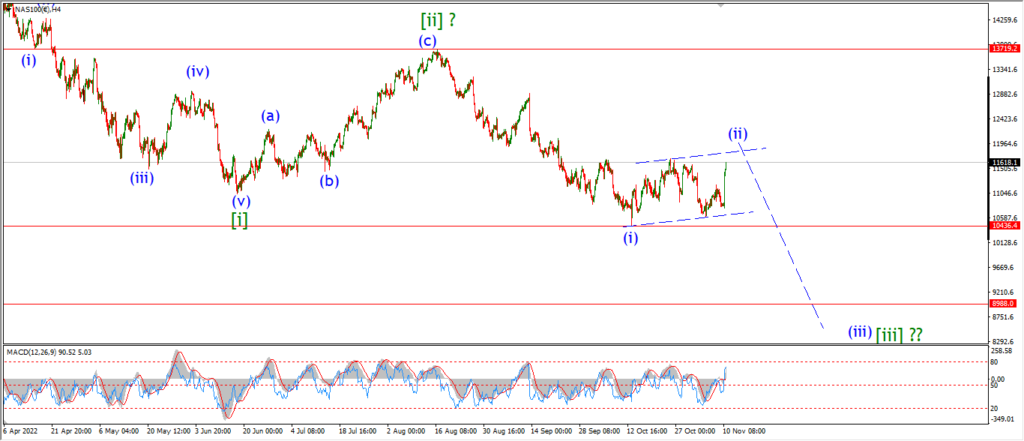
NASDAQ 4hr.

NASDAQ daily.
….