
I was sent this article the other day by a friend and I really enjoyed it’s unambiguous clarity on where we stand in the market cycle.
It is simply glaring how easy this cycle top is to identify, when you strip away all the bullshit, hyperbole and old wives tales!!
Here it is and it is worth a read for sure. – The Myth Of The ‘Great Cash Hoard’ Of 2019.
And here is a recent interview with my old buddy Jeff Gundalach, and this is definitely worth watching too. – https://www.youtube.com/watch?v=szjJn7iQA_c
Boil the kettle and put up your feet to enjoy the winds of truth blow away the cobwebs of misdirection that the media loves to spin.
Down to business.
EURUSD.
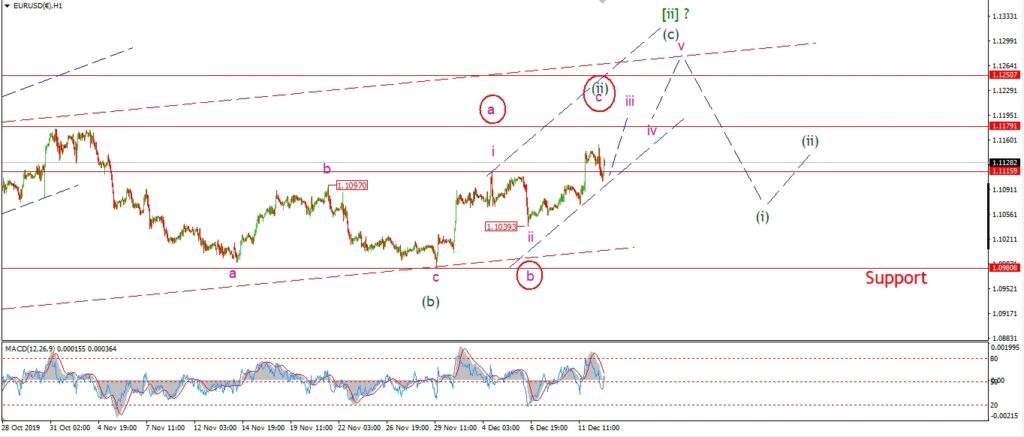
EURUSD 1hr.
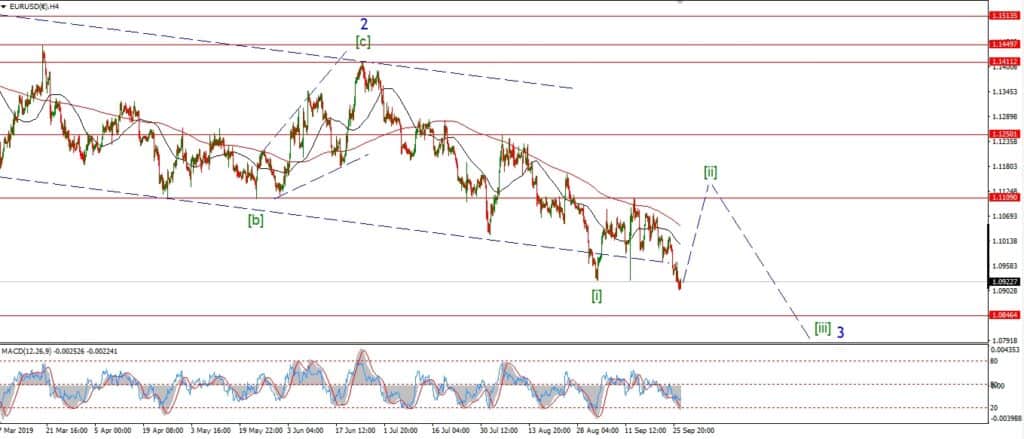
EURUSD 4hr.
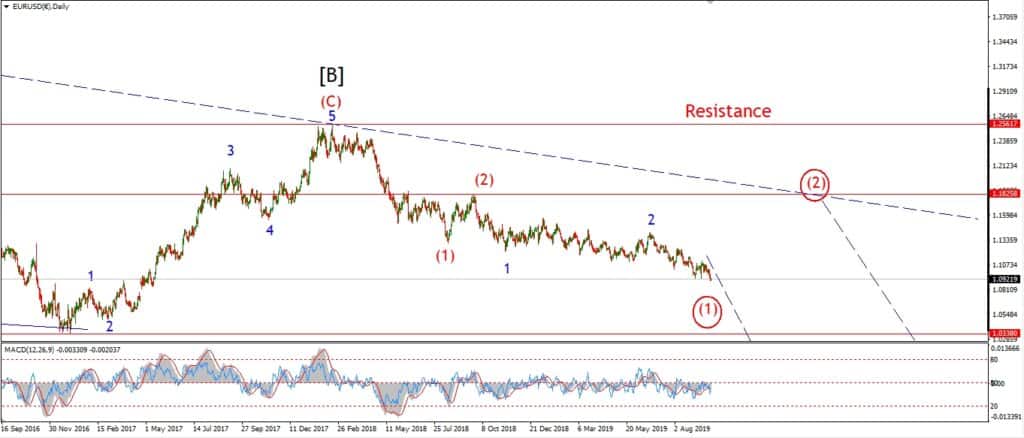
EURUSD daily.
The late action last night confirmed my suspicions about the alternate count.
The price broke through the 1.1115 level late in the sessions,
and this triggered the alternate count.
Wave (c) up is now in force and there is a good chance that we will see 1.1250,
if the pattern continues in this vein.
The price hit a setback this afternoon with a small decline off the high.
This should prove to be a correction within wave ‘iii’ of (c).
Price must hold above 1.1039 for this short term count to remain valid.
Tomorrow;
Watch for wave ‘iii’ up to continue above 1.1179 at a minimum.
GBPUSD
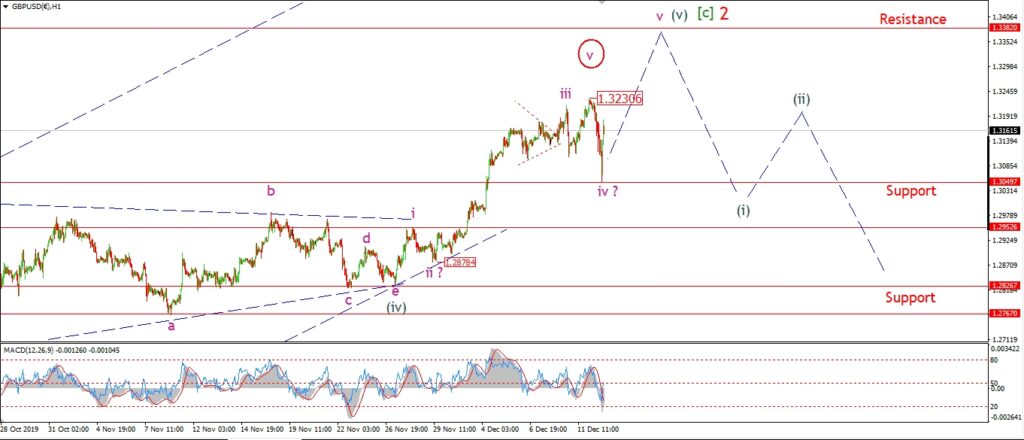
GBPUSD 1hr.
GBPUSD 4hr.
GBPUSD daily.
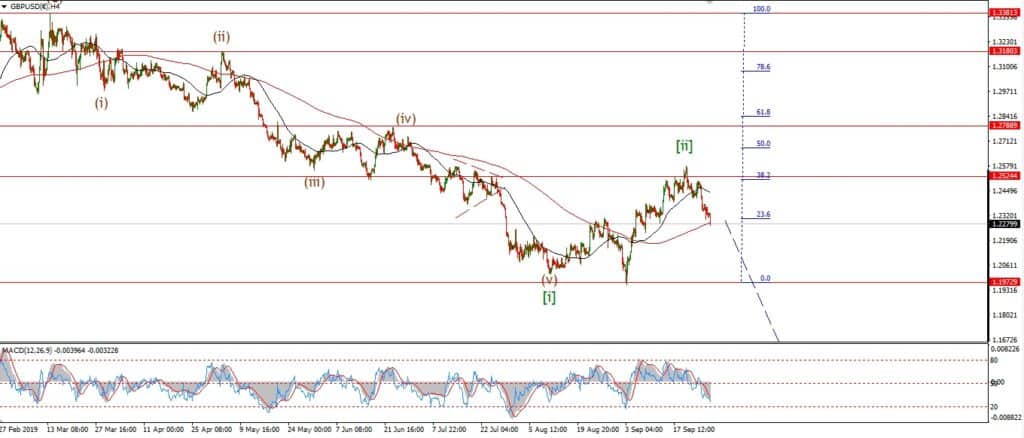
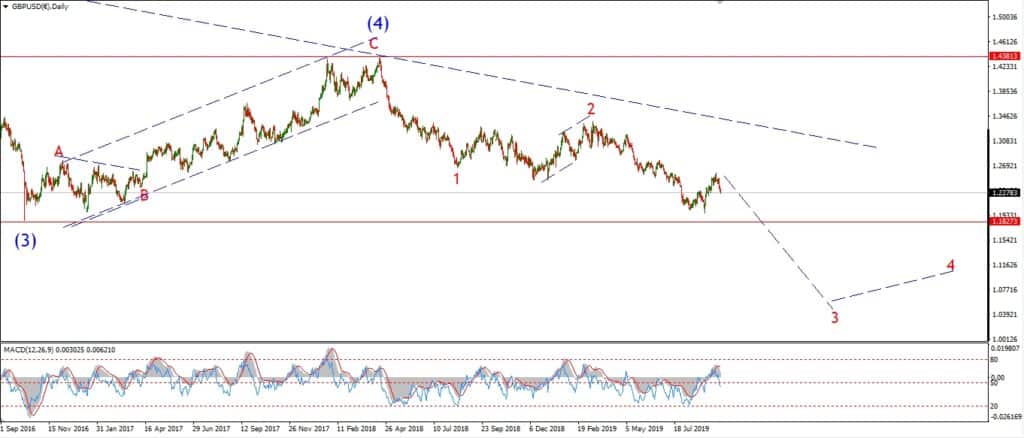
Cable hit that same stumbling block today also.
The short term action has forced a slight rethink of the short term count.
The sharp drop off last nights high is now viewed as the final leg of an expanded flat correction.
I have shown wave ‘iv’ of (v) complete at this evenings lows.
The price has rebounded well off the low and this should be the beginning of wave ‘v’ up.
Wave ‘v’ is set to carry up to resistance at 1.3380 to complete a larger expanded flat correction in wave [2].
Tomorrow;
Watch for the low at wave ‘iv’ to hold at 1.3050.
Wave ‘v’ of (v) will be confirmed with a break of 1.3230
USDJPY.
USDJPY 1hr.
USDJPY 1hr.
USDJPY daily.
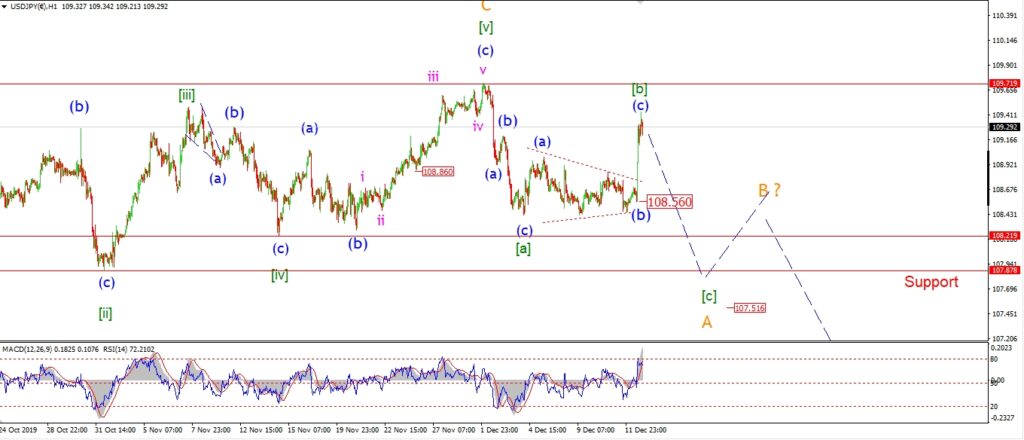
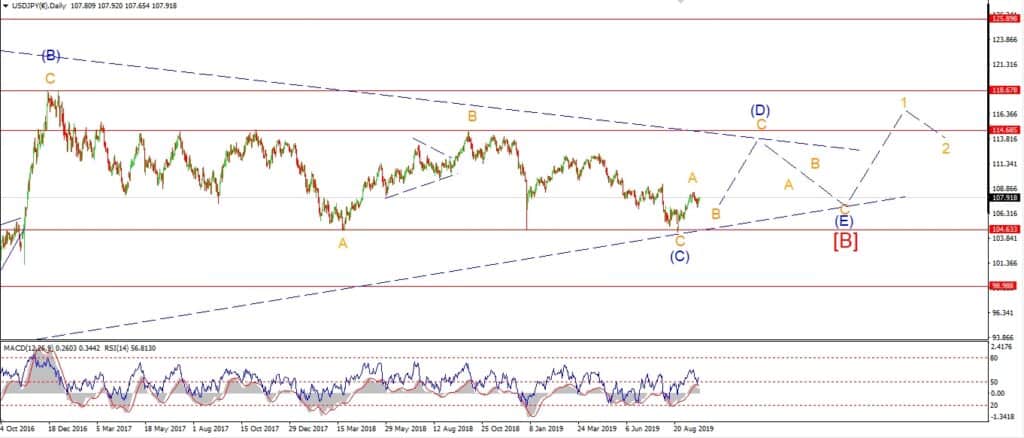
USDJPY got a real kick in the rear today after that so called trade deal announcement!
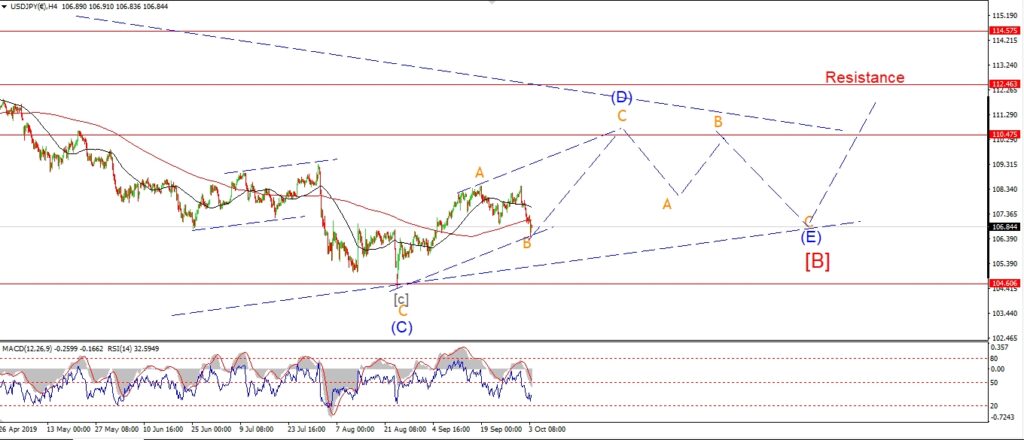
The rally is still likely part of wave [b] of ‘A’ overall.
Wave [b] should complete below the recent high at 109.71.
And wave [c] is set to fal back into the 107.00 handle
to complete a three wave pattern in wave ‘A’ over the next week.
Tomorrow;
Watch for wave [b] to complete at a lower high b elow 109.71.
The initial move off the high should begin overnight.
A break of 108.56 again will signal wave [c] is underway.
DOW JONES.
DOW 1hr.
DOW 4hr
DOW daily.
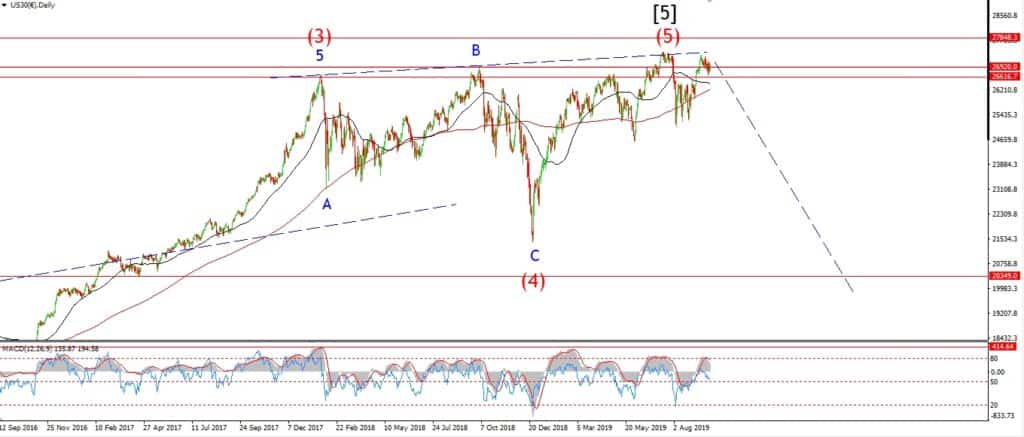
How many times can the float the idea of a trade deal as a catalyst for a continued bull market.
If anything,
a trade deal should be viewed as a glaring sell signal
a mile marker at the top of a euphoric 10yr bull market!
The old saying goes – ‘buy the rumor and sell the fact’.
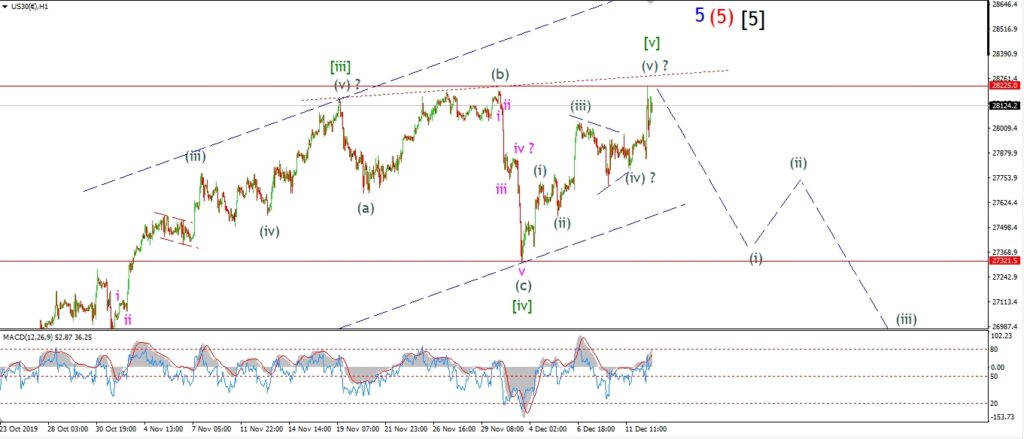
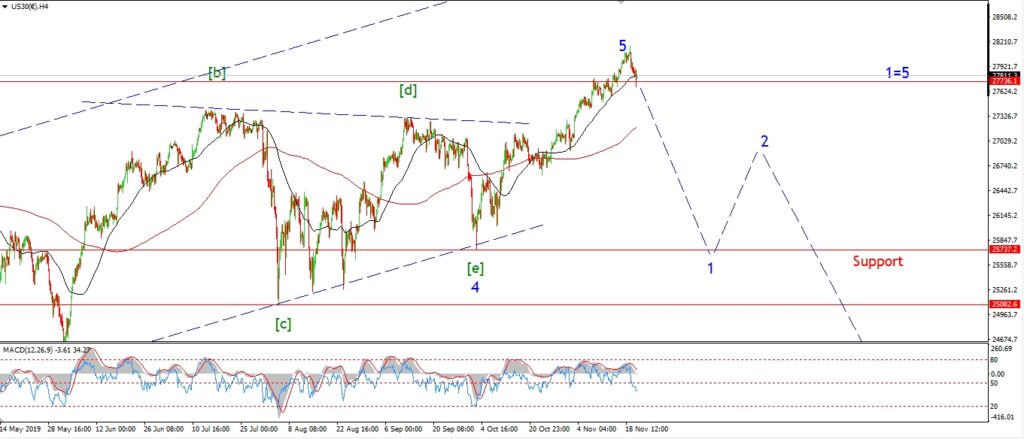
The DOW did trigger the alternate count also today,
but this is just another iteration of the topping process that is in play now.
There is even a good chance that todays new high is the final high for wave (v) of [v].
I can track a five wave pattern off the expanded flat wave [iv] green,
into todays high at 28225.
The price did not stay at the new high for long today either,
with a spike lower to reject that level completely.
The bear market hasn’t started yet,
but boy we are close!
Tomorrow;
The same old story applies today as did last week.
I want to see a clear bearish signal off the high in the form of a five wave decline and a three wave recovery.
GOLD
GOLD 1hr.
GOLD 4hr.
GOLD daily.
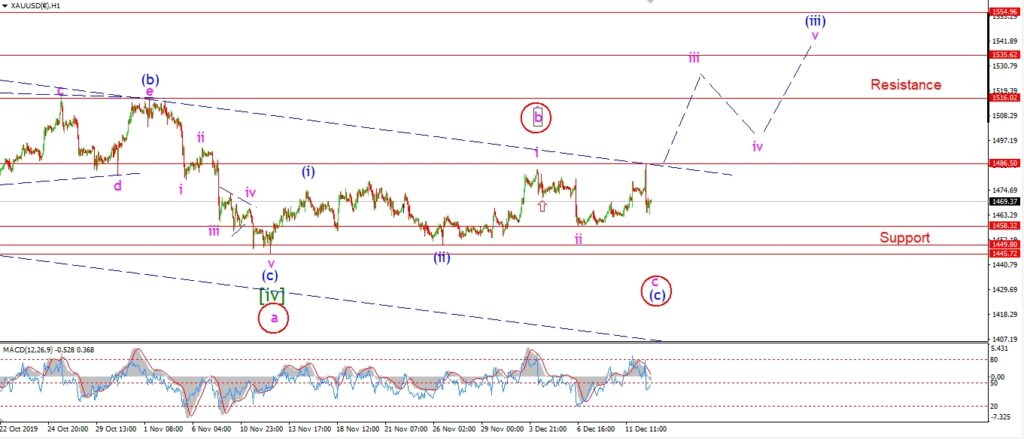
After some promising action earlier in the day,
the market sold off in line with the the rally in stocks.
There is a bright side and a glimmer of hope in this action,
we are still sitting at a higher low this evening, again!
So all is not lost here by any means,
and the bullish short term count remains in force for the moment.
Tomorrow;
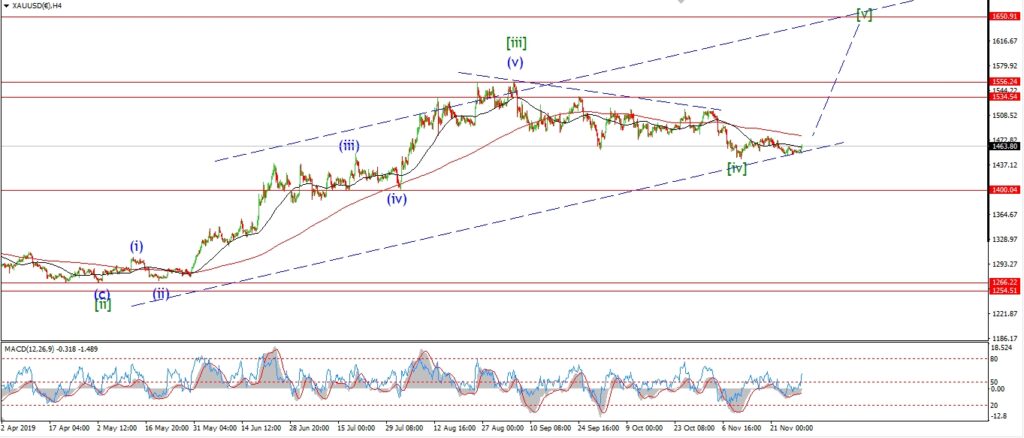
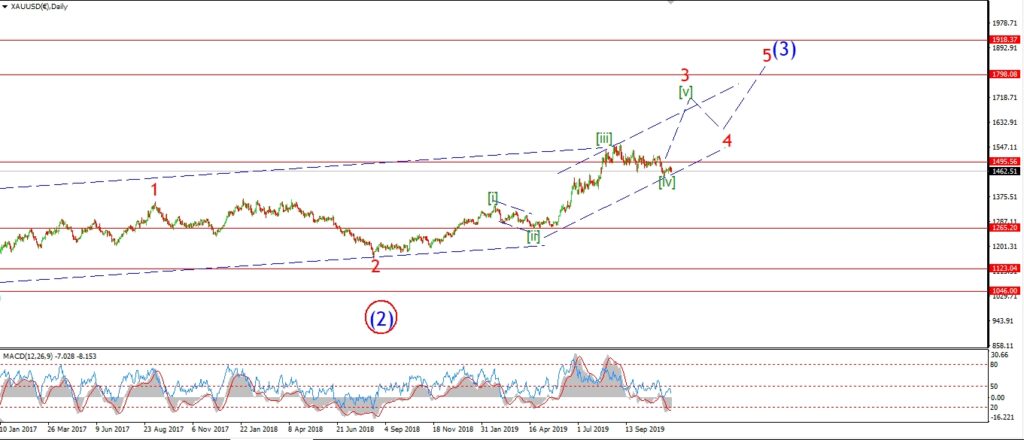
The development of this pattern is labored for sure,
but I do think there is a payoff to be had at the end of this endurance test!
Watch for 1458 to hold again.
A move above 1487 will confirm wave ‘iii’ has begun.
CRUDE OIL.
CRUDE OIL 1hr.
CRUDE OIL 4hr.
CRUDE OIL daily.
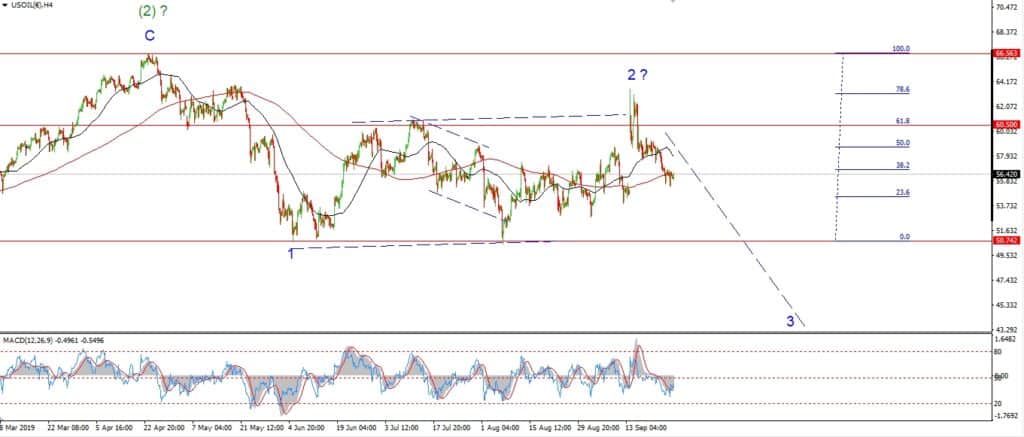
The small decline yesterday did not develop favorably today,
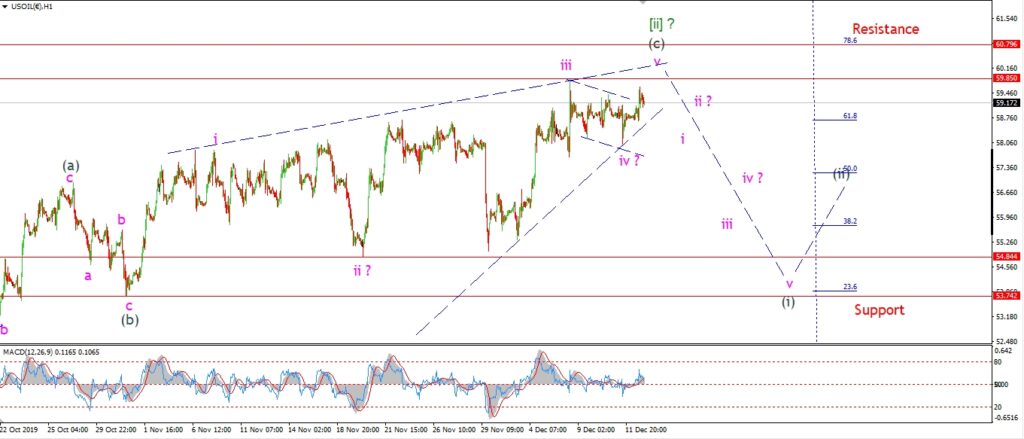
So I have had a good rethink of the action in wave (c) of [ii] this evening.
The ending diagonal still seems the most likely scenario at the moment.
the internal waves within wave (c) can each be viewed as three wave patterns.
And this is creating a rising wedge pattern into this evenings highs,
one more break into the 60.00 handle again will be a nice ending to this pattern.
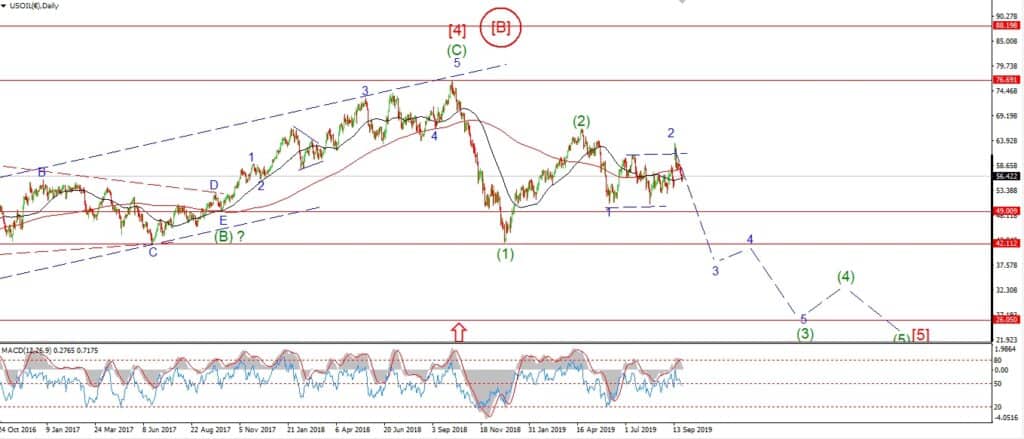
and it will allow me to concentrate on the downside potential in wave [iii].
At the moment,
a sustained move to the downside is the last thing the market is expecting.
But that is exactly what they will get when wave [iii] gets going.
Tomorrow;
watch for wave ‘v’ of (c) of [ii] to top out with a break of 59.85.
I will have to wait until next week for wave (i) to begin.
S&P 500.
S&P 500 1hr
S&P 500 4hr
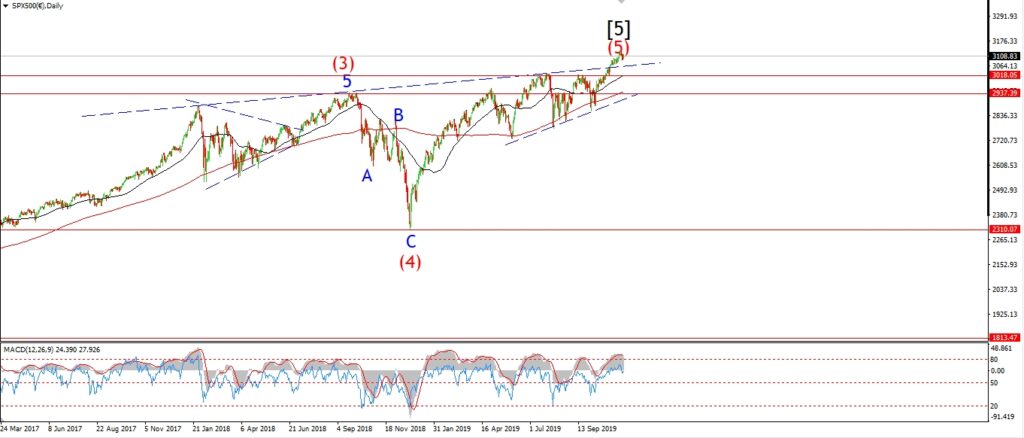
S&P 500 daily.
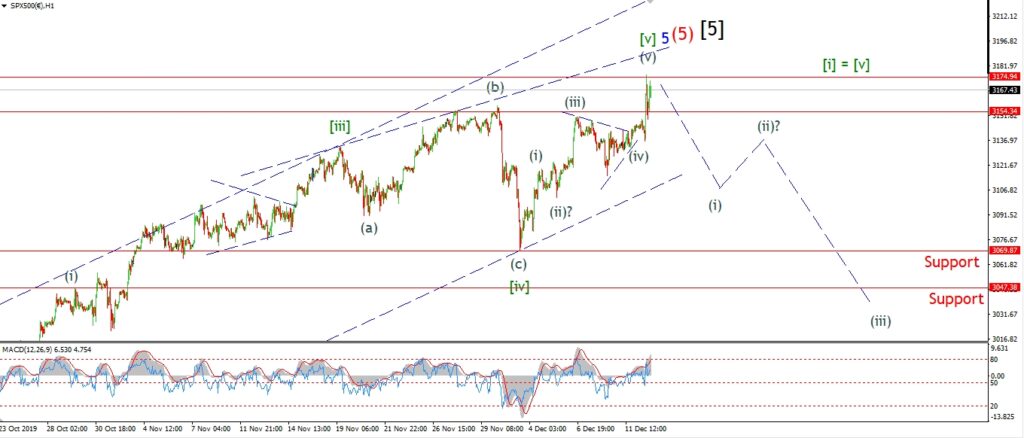
A day of alternates is the stock market today.
but again,
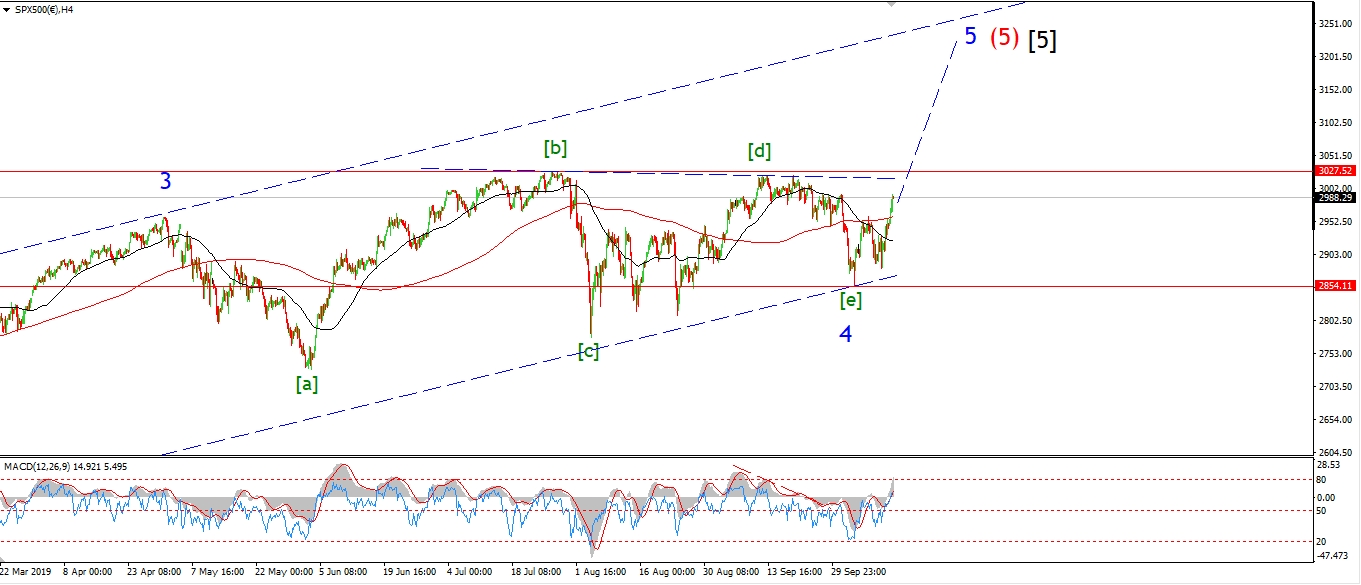
this alternate is simply a variation of a topping pattern.
And we are only one step removed from the previous count I was working with.
Patience will pay off in the end in the stock market.
And I am convinced that we are only a moments away from the declines of a lifetime now.
The market may be screaming for joy about a trade deal,
but this is window dressing for the top of the market.
We may not get the impulse wave down that I am looking for this week.
But we will get is sooner rather than later.
Tomorrow;
This evenings spike lower is interesting as a beginning of an impulse wave,
but I will have to wait and see on that front.
Also,
today highs hit the level where wave [i] of ‘5’ reached equality with wave [v] of ‘5’.
This is another big crack in the case for a continued bull market from here.
SILVER.
SILVER 1hr
SILVER 4hr.
SILVER daily.
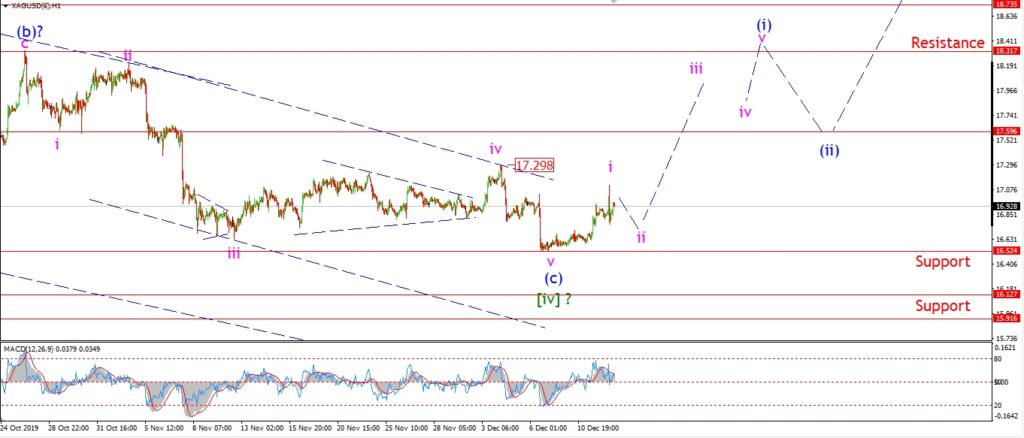
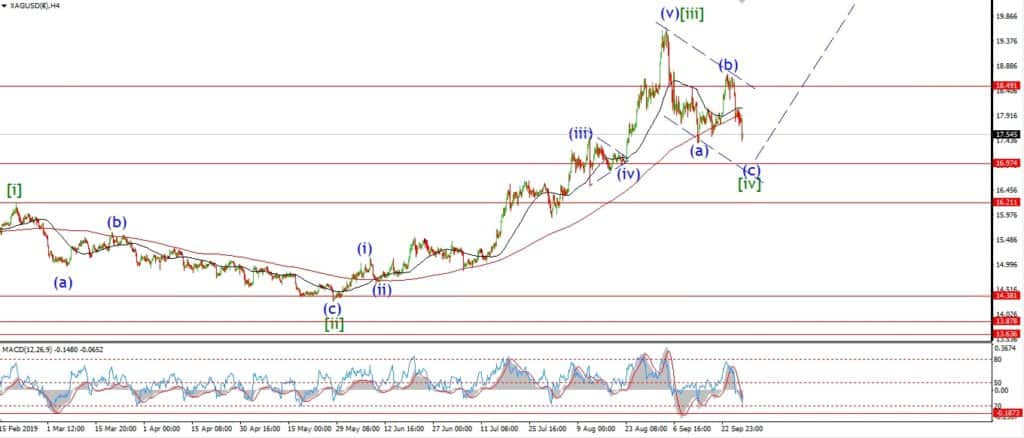
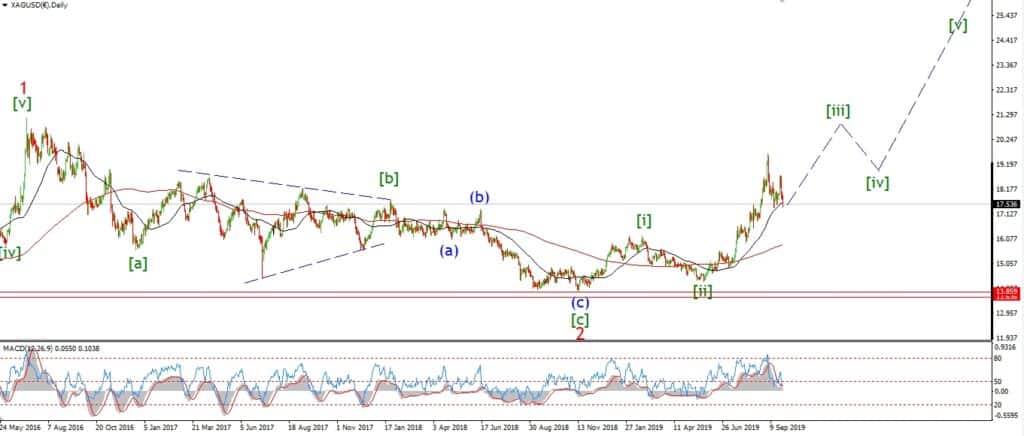
Silver may be on the verge of a small impulse wave higher off the low at wave [iv] green.
I have labelled todays high as wave ‘i’ up.
And the decline off that high is wave ‘ii’ still unfolding.
the idea is simple from here,
if we see a three wave decline to a higher low above 16.52 tomorrow,
that will complete a small bullish signal for the beginning of wave (i) up.
Wave ‘iii’ of (i) will be confirmed with a break of 17.30 again.
Tomorrow;
first things first,
wave ‘ii’ must hold above 16.52 from here.
We may have a bullish signal in place for the beginning of next weeks trade.
U.S 10YR.
US 10YR 1hr.
US 10YR 4hr.
US 10YR daily.
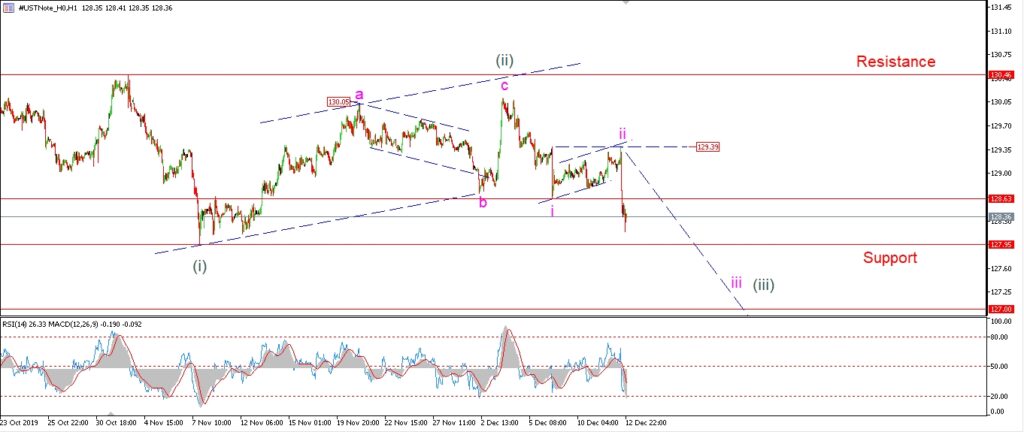
Bonds hit the small target level for wave ‘ii’ in the afternoon today,
and then we saw a sharp move lower off that level to begin wave ‘iii’ down.
It is early days in this pattern,
but the initial move lower off a bearish impulse wave is a good sign
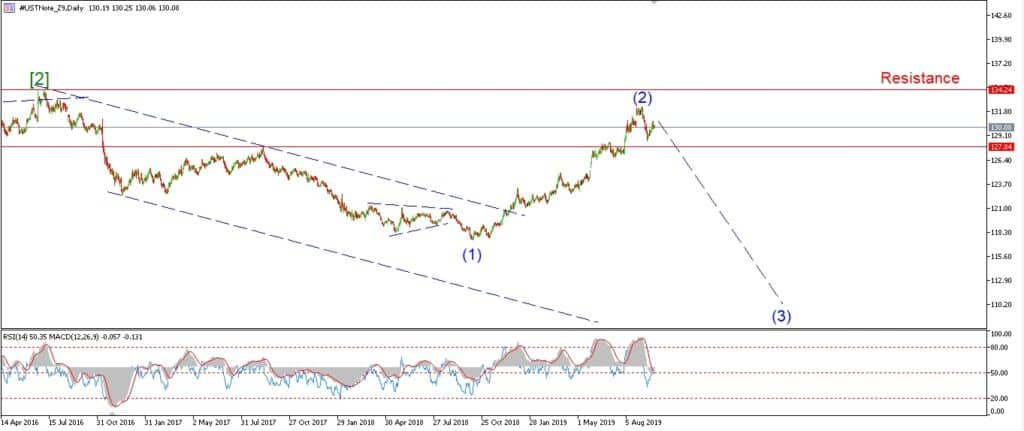
that we are indeed turning lower again into a larger trend move now.
Tomorrow;
Wave ‘ii’ lies at 129.30,
so this level must hold as wave ‘iii’ down develops.
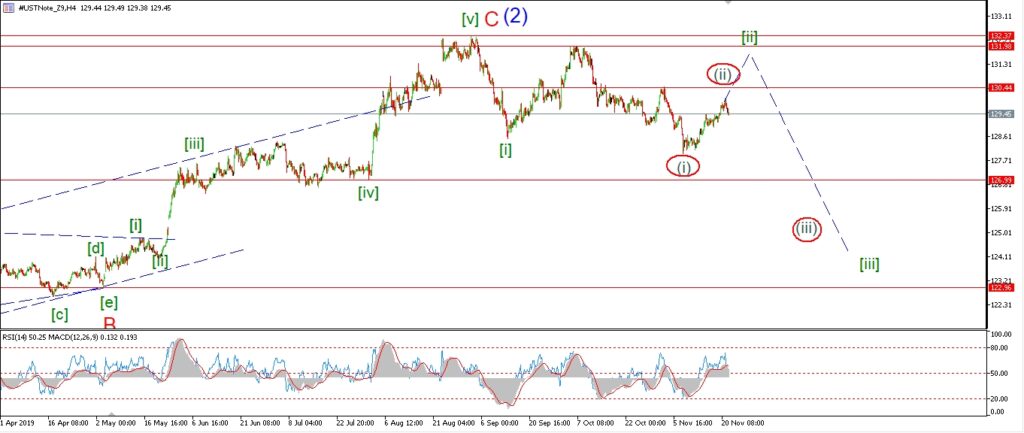
Watch for wave ‘iii’ to pick up steam over the next week or so.
A break of 127.95 will confirm wave ‘iii’ is underway.
I expect the larger wave (iii) to continue for a few weeks
and hit the 123.00 handle before correcting higher again.
one step at a time.