
Good evening folks, the Lord’s Blessings to you all.
https://twitter.com/bullwavesreal
EURUSD.

EURUSD 1hr.

EURUSD 4hr.
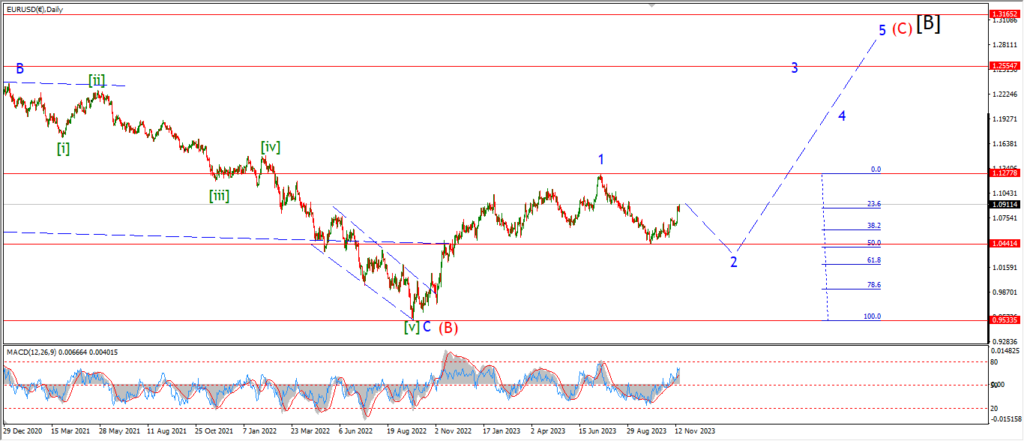
EURUSD daily.
EURUSD is holding near the 1.0750 area again tonight despite a small dip earlier in the session.
I do think we will get a bounce next week into wave (ii) blue.
And wave (ii) will break above the 1.0900 level again.
The larger pattern in wave [c] of ‘2’ requires a five wave dec line over the coming weeks,
and that pattern should complete near the 1.0300 handle.
the minimum target for wave [c] of ‘2’ lies at 1.0450 where wave [c] breaks the wave [a] low.
This can be seen on the 4hr chart.
Monday;
WAtch for wave (ii) to trace out three waves up towards the 1.0900 level again.
GBPUSD

GBPUSD 1hr.

GBPUSD 4hr.
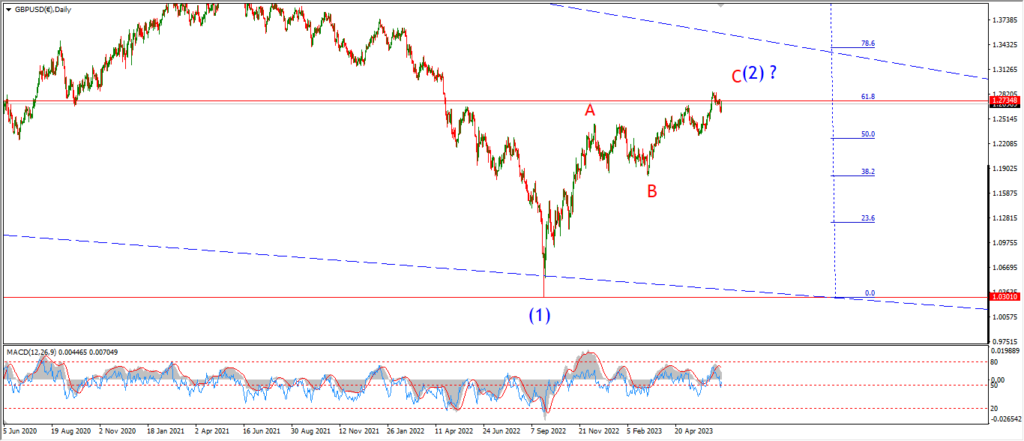
GBPUSD daily.
The drop in cable again today has noened up the possibility for wave ‘iii’ of (i) again.
the price fell low enough to clear the wave ‘i’ low at 1.2600.
and now there is enough room for the price to correct higher in wave ‘iv’,
and hold below that wave ‘i’ low at 1.2600.
The alternate count has not been ruled out here yet,
but I can continue to work on this main count until the pattern has been invalidated.
Monday;
Watch for wave ‘iv’ of (i) to trace out a correction higher and complete below the 1.2600 level at wave ‘i’ pink.
USDJPY.

USDJPY 1hr.

USDJPY 4hr.
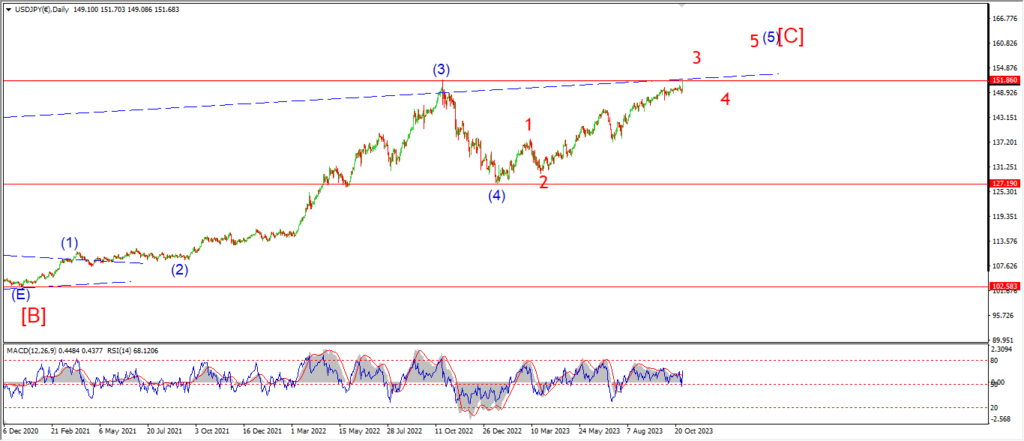
USDJPY daily.
USDJPY has bounced off Thursdays low today and traced out three waves up into the session high.
The invalidation level at wave ‘i’ pink lies at 1.46.66,
and if that level breaks then I will switch to the earlier wave [b] idea.
for the moment this pattern in wave (c) of [a] requires another drop to break 141.60 to complete.
and that is what I will be looking for early next week.
Monday;
Watch for wave ‘v’ of (c) to fall again and break the wave ‘iii’ low at 141.60.
A break of 146.66 again wil signal wave [b] is already underway.
DOW JONES.

DOW 1hr.

DOW 4hr
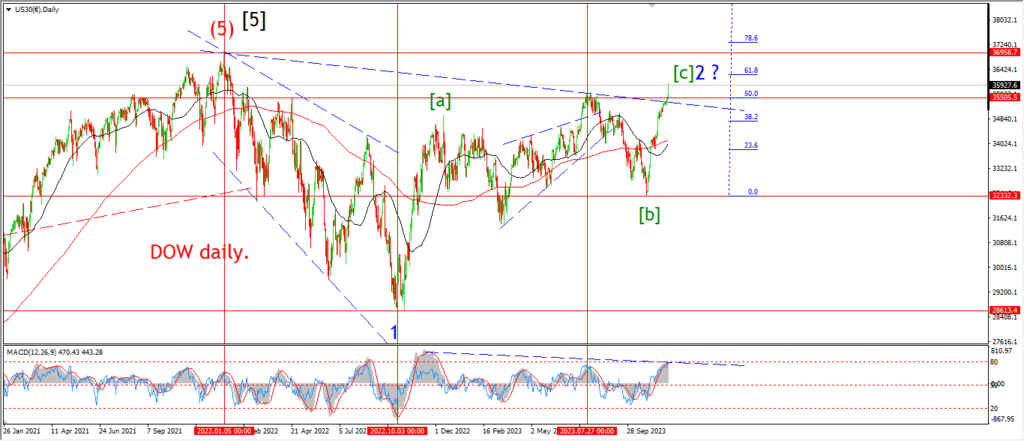
DOW daily.
The DOW is hovering back at the highs of the week again tonight which has postponed the inevitable decline into wave (i) for another day at least.
The pattern has not changed much this week apart from the delaying factor of completing the internal pattern of wave (v) of [c].
The market is holding on for dear life here.
And it seems people are not yet ready to let go of wave ‘2’ and to turn into wave ‘3’.
That change will come no doubt.
The timing part of that equation is always the difficult question.
This weeks action can be described as a series of fourth and fifth waves correcting to the lower end of the range in wave four,
and then pushing to the upper end in a fifth wave.
This sort of action is usually part of the culmination process in the larger wave.
so we are close to the reversal off the top.
Monday;
Watch for wave ‘v’ to complete a new lower high in wave [c] of ‘2’.
and then wave ‘i’ down to begin a drop into support at 35280 over the rest of next week.
GOLD

GOLD 1hr.

GOLD 4hr.

GOLD daily.
Gold is ending the week at a new low off the recent top.
And I am now forced to trigger the alternate count for wave [c] of ‘2’.
The price dropped back below the previous high labelled wave (a) at 2009,
and because of that,
the impulsive pattern was invalidated.
The alternate count is now in control again.
The recent high takes the wave [b] of ‘2’ label and now wave [c] is underway.
wave (i) and (ii) dropped impulsively off the top and this begins a five wave decline in wave [c].
The new low today is viewed as the beginning of wave (iii) of [c].
and wave (iii) should fall into the previous wave (b) low at 1931.
A break of 1931 will really favor this new count.
And then the larger wave [c] should continue lower to compelte the five wave decline with a break of 1810 again.
I know thats a long way down from here,
but that only brings us back to the late September lows again.
At that point we have another great buying opportunity in store.
Monday;
Watch for wave (ii) to hold at 2039.
Wave (iii) of [c] should continue lower in five waves to break 1931 again.
CRUDE OIL.

CRUDE OIL 1hr.

CRUDE OIL 4hr.
CRUDE OIL daily.
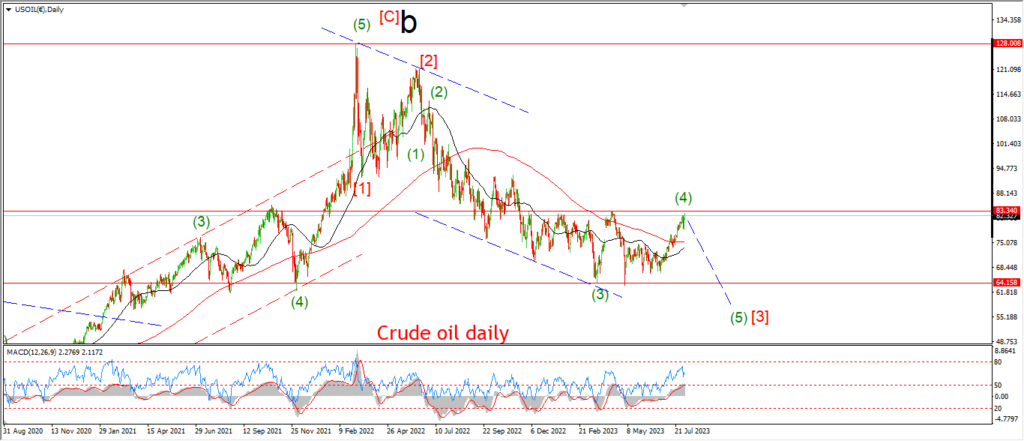
Crude oil has finally begun to track higher again after a pretty brutal week on the chart.
The decline into wave (v) could not have followed the pattern better,
which is nice to say given what is happening in the stock market these days!
I am now suggesting that wave [iii] green is complete at this weeks lows.
And we should trace out a three wave pattern higher over the next few weeks into wave [iv] green.
A break abvoe the wave (iii) low at 72.40 again will signal wave (a) of [iv] is underway.
And I am looking for wave (a) to top out near the 75.00 handle again later next week.
Monday;
Watch for a three wave pattern to continue higher over the coming days in wave (a) of [iv].
Wave (a) should top out near the 75.00 handle again.
S&P 500.

S&P 500 1hr

S&P 500 4hr
S&P 500 daily.
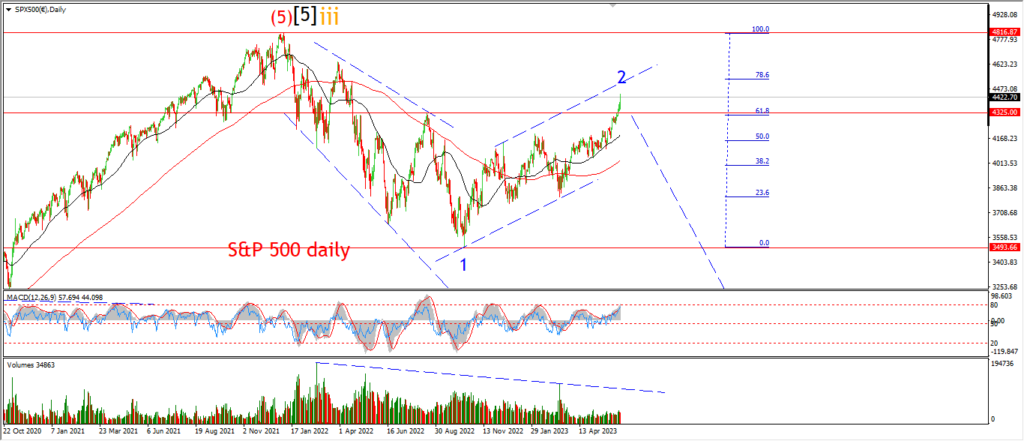
The S&P has pushed the envelope of the main count and has now triggered the alternate count for wave ‘2’ this evening.
Lets start on the daily chart tonight.
The low of wave ‘1’ blue was registered in October 2022.
And since then the market has spent a year tracking higher to reach this new high.
The pattern into this high is still viewed in a corrective framework.
wave ‘2’ has run its course even with this new high today.
The rally in wave ‘2’ has traced out three waves up overall.
And wave [c] today is showing all the same volume and momentum charachteristics as the previous major highs.
Momentum has rolled over off an extreme high and volume is paper thin when you compare to previous highs.
So,
we have a correction to a lower high,
along with a momentum turn off an extreme high,
all happening on thin volume.
It sounds like a risky situation to me.
the 4hr chart gives us a better view of waves [b] and [c].
Wave [b] completed at the October lows of 4100.
And now this screaming rally into wave [c] is close to hitting 50% of the length of wave [a].
That level comes at 4660.
The hourly chart shows an extension in wave (iii) of [c] of ‘2’ which occurred through November.
Wave (iv) came down in three waves this week.
and now wave (v) has turned higher and seems to be overlapping internally as the wave progresses.
This may even be an ending diagonal wave (v) now in play.
Monday;
4660 is the next level to watch for a completion of wave (v) of [c] of ‘2’.
SILVER.

SILVER 1hr

SILVER 4hr.
SILVER daily.
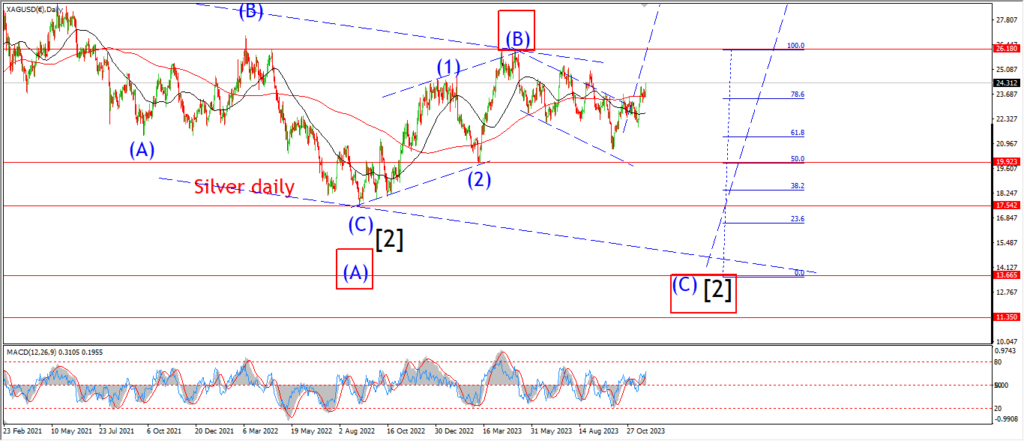
Silver has almost reached the 78.6% retracement level of wave ‘i’ now.
And the price took another very sharp turn lower again today.
I am suggesting that wave ‘c’ of ‘ii’ is complete now.
and we should see a bounce into wave ‘iii’ coming next week.
IT may take a few days for the price to recover from this weeks rapid decline.
We will see how wave ‘1’ of ‘iii’ develops over the coming days.
I can’t rule out the possible alternate count for silver given that gold may be moving into a long wave [c] decline.
The first alternate count is shown on the 4hr chart.
in this scenario wave [b] of ‘2’ completed at last weeks highs.
and wave [c] of ‘2’ is yet to complete with a break below 20.68 again.
This wave count will be triggered with a break of the previous low at 21.89 labelled wave [ii] on the 4hr chart.
Monday;
Watch for wave ‘ii’ to complete above 21.89 at the very extreme low.
A rally back above 24.60 again will signal wave ‘1’ of ‘iii’ is underway.
BITCOIN

BITCOIN 1hr.
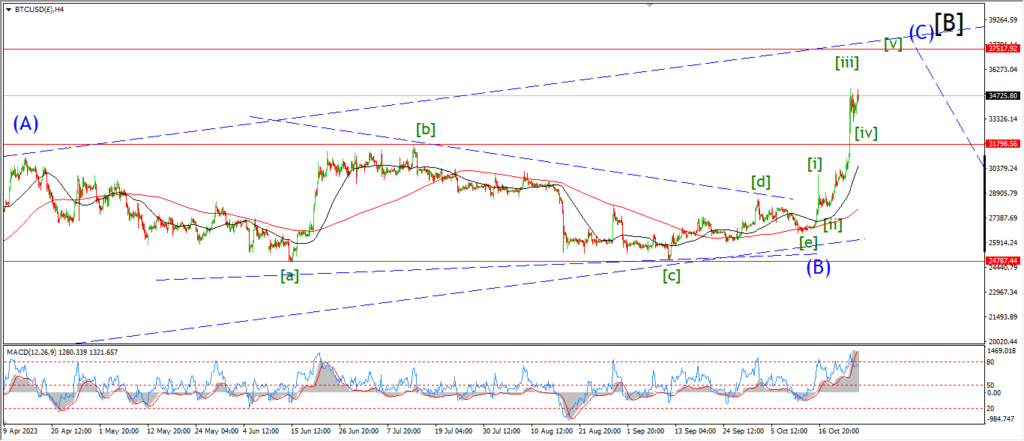
BITCOIN 4hr.
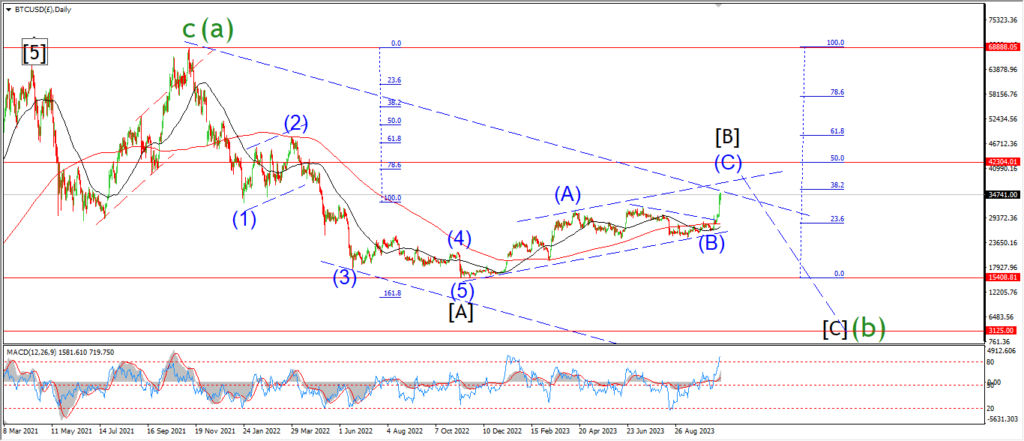
BITCOIN daily.
….
FTSE 100.

FTSE 100 1hr.
FTSE 100 4hr.

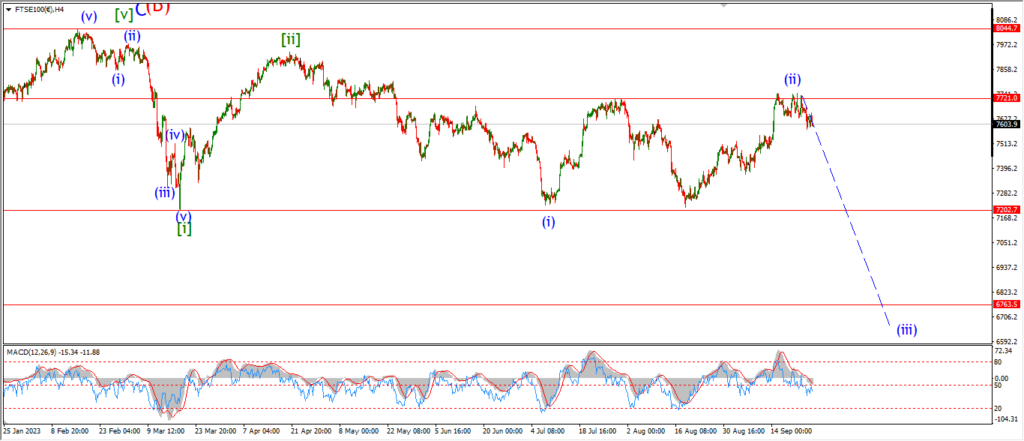
FTSE 100 daily.
….
DAX.

DAX 1hr
DAX 4hr

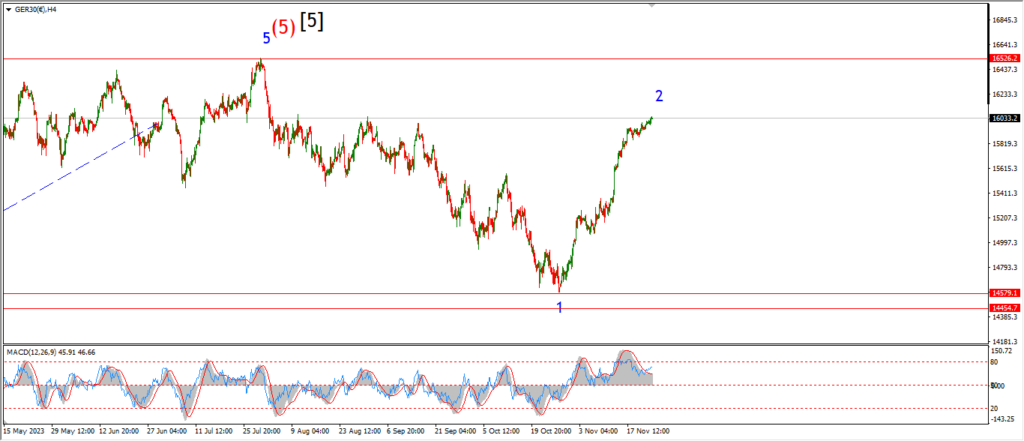
DAX daily.
….
NASDAQ 100.

NASDAQ 1hr
NASDAQ 4hr.
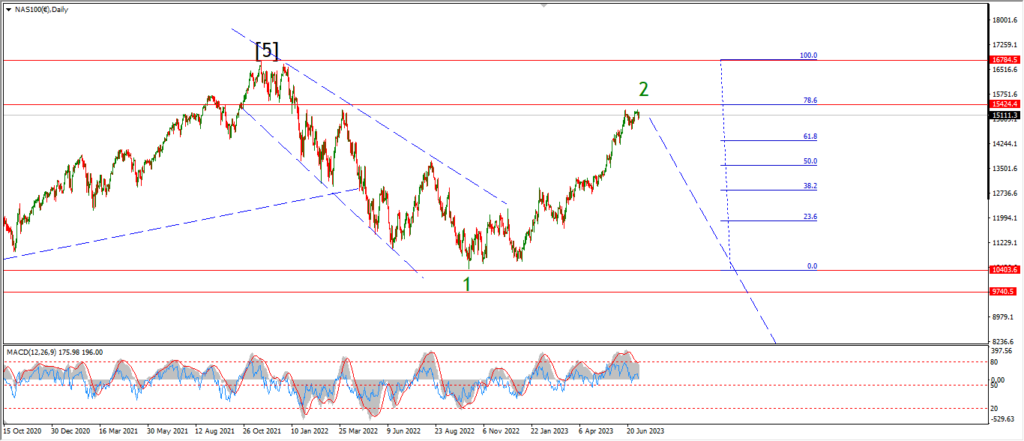
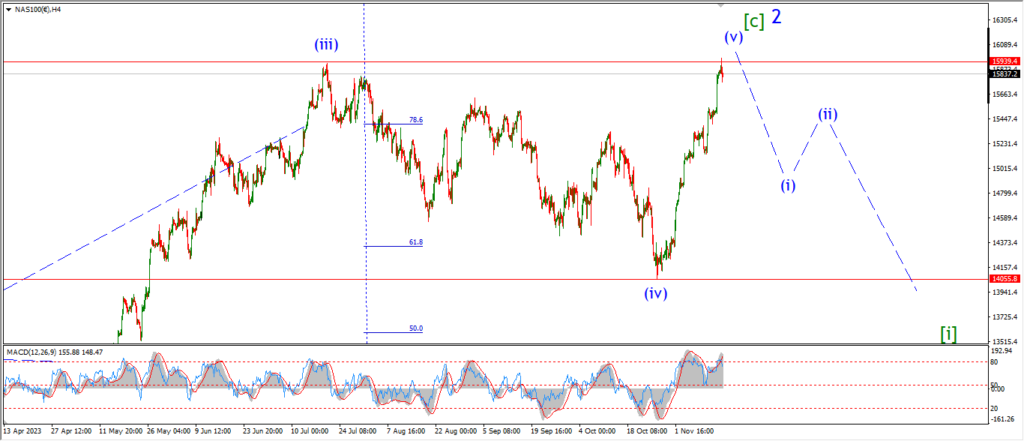
NASDAQ daily.
….