
Good evening folks, the Lord’s Blessings to you all.
I am way behind on emails, AGAIN!
So if you are waiting for a reply from me,
don’t worry its coming.
I keep getting sidetracked when I decide to get into the emails.
But I hope to get down to that tomorrow.
May I state the complete obvious first of all,
that was a wild day in the metals market!
And because of the moves we saw today, I am going to restate the warning about the alternate count again.
I know some people don’t like when I sitting on the fence like this,
but I just can’t help it sometimes!
AS for the interview below;
I saw this interview with Jim Rogers today and I had to share it.
I remember watching Jim being interviewed during the 2007-09 crisis, and I loved his straight talking attitude.
He was an elder statesman in the investment community back then,
Now he is the grandad of the community!
But he is every bit as straight talking as he was back then.
It’s worth a few minutes of your time for sure.


David Rosenberg @EconguyRosie
From 2.1% on November 22nd to 1.8% on November 30th to 1.2% today. That is the freshly-minted Atlanta Fed Nowcast estimate for Q4 real GDP growth. In two words or less: stall speed. Notice how nobody is talking about it??

https://twitter.com/bullwavesreal
EURUSD.

EURUSD 1hr.
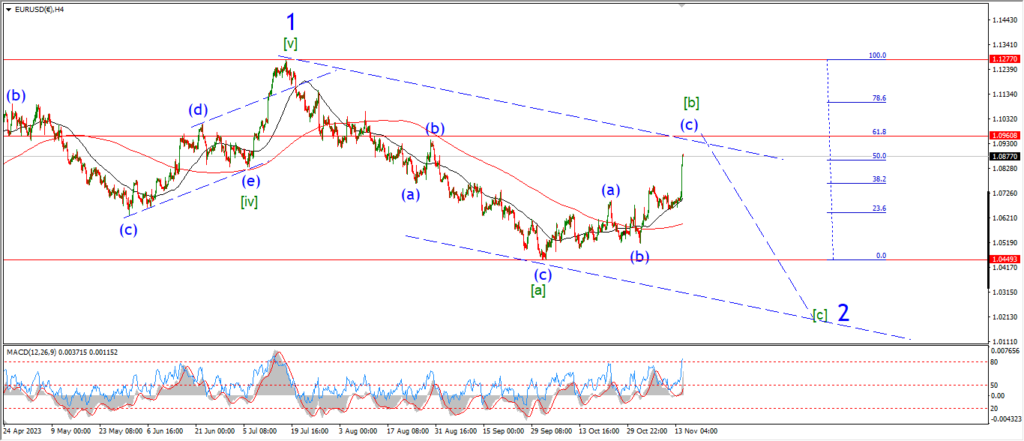
EURUSD 4hr.
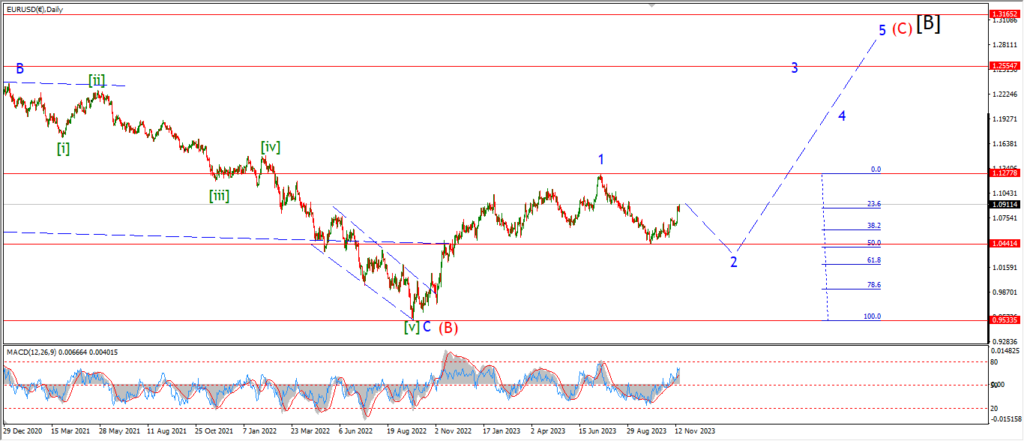
EURUSD daily.
EURUSD has dropped again today and there is a possibility that wave ‘iii’ of (i) is now underway.
The decline is not larger enough to confirm wave ‘iii’ yet,
but another drop into the 1.0750 area should do that.
wave (i) blue should fall in five waves for the rest of this week,
and I suspect wave (i) will find a low in the 1.05 area again to retrace all of the previous rally in wave (c).
Tomorrow;
Watch for wave ‘ii’ to hold at 1.0890.
A break of that level will suggest wave ‘ii’ is still in play.
Wave ‘iii’ must continue lower in five waves towards 1.0700 again.
GBPUSD

GBPUSD 1hr.
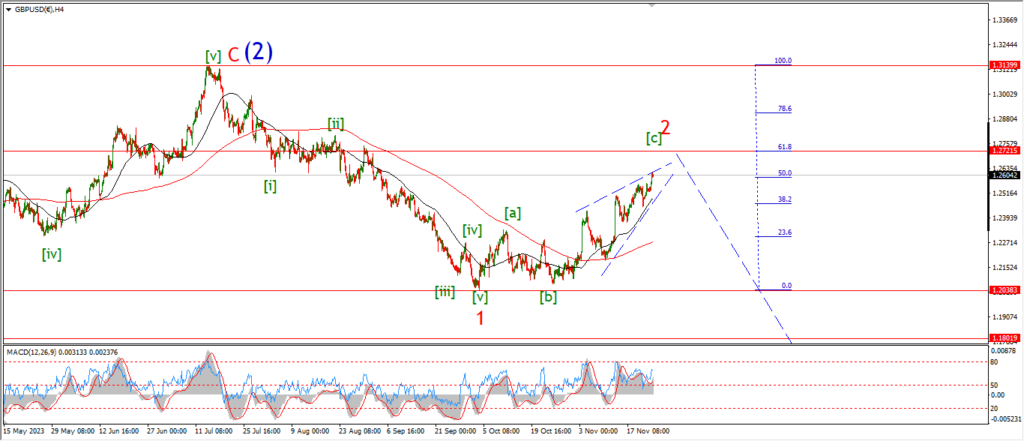
GBPUSD 4hr.
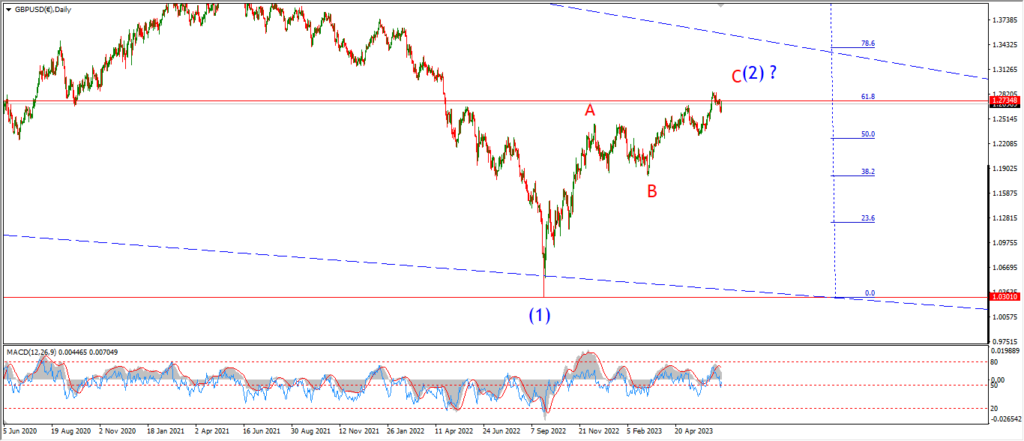
GBPUSD daily.
Just like EURUSD today,
cable has dropped again in line with the main wave count idea,
but the decline is not far enough to confirm wave (i) yet.
A bigger acceleration to the downside to break the 1.2500 level again will confirm wave (i) blue.
And when that happens,
then I can start to make some projections into the next leg down in wave [i] green.
So we are sitting at a turning point here also,
waiting for confirmation of the next trend move.
Tomorrow;
Watch for wave [c] of ‘2’ to hold at the recent high at 1.2732.
Wave (i) must continue lower and trace out five waves down as shown.
USDJPY.

USDJPY 1hr.
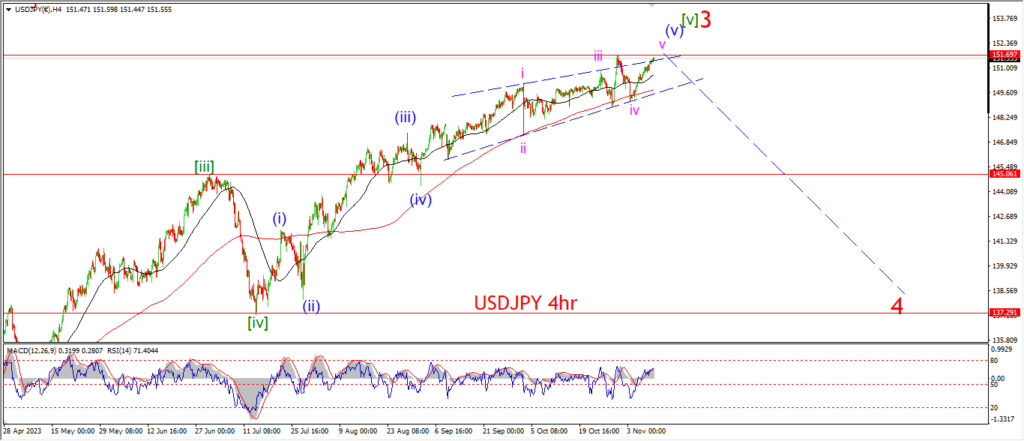
USDJPY 4hr.
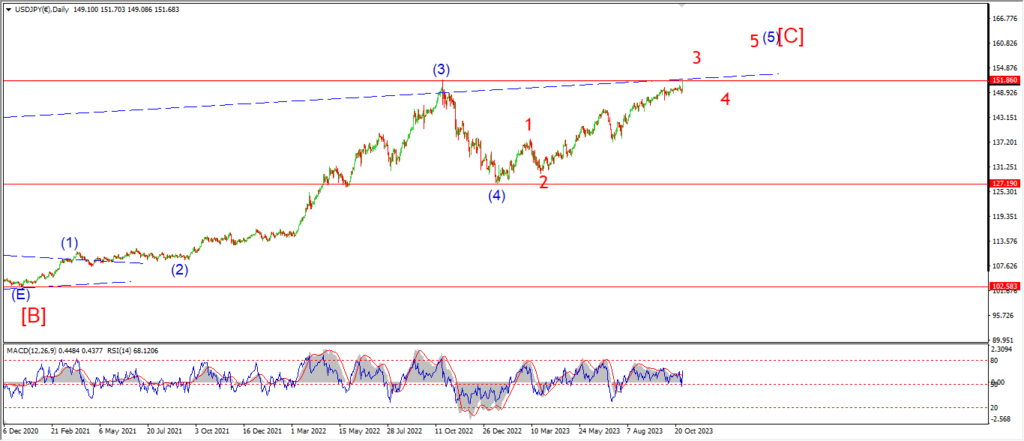
USDJPY daily.
USDJPY has traced out three waves up off the session lows overnight.
And that action suggests we have a smaller degree wave ‘1’ and ‘2’ pattern to begin the five wave decline into wave ‘iii’ as shown.
Wave ‘3’ of ‘iii’ of (c) should turn lower again tomorrow if this count is correct,
and we should see wave ‘iii’ pink hit that initial target level at 145.00 flat.
that level is where wave (c) reaches equality with wave (a).
and so that marks the initial target for wave [a] green to complete also.
Tomorrow;
Watch for wave ‘iii’ pink to trace out five waves down and hit the target area over the next few days.
Wave ‘iii’ pink should bring the pattern down towards support between 144.43 and 145.00 again.
When the pattern gets there,
we will then be very close to a completed correction in wave [a].
DOW JONES.

DOW 1hr.

DOW 4hr
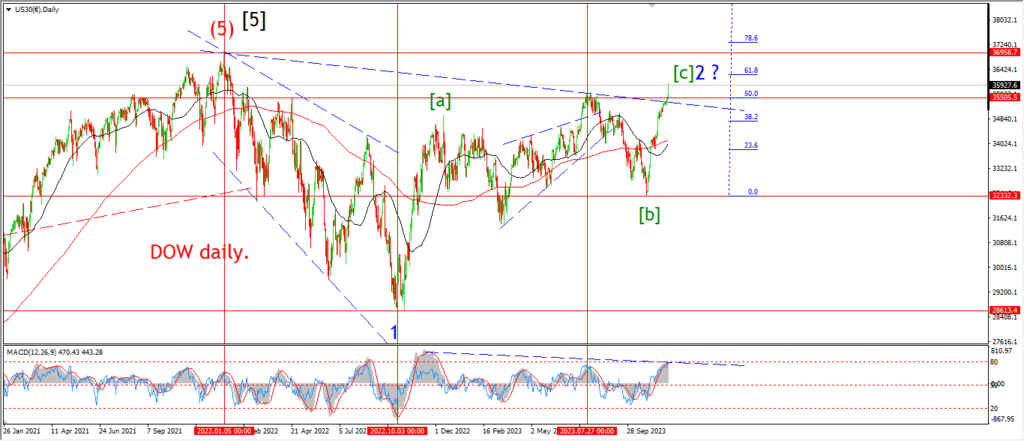
DOW daily.
I am showing another version of last Fridays wave count for wave (v) of [c] now.
This involves an extension in wave ‘iii’ of (v) rather than in wave ‘v’ of (v).
The change helps to define the rally into the current high a little better.
And it correlates better with the momentum slow down on both the hourly and 4hr charts now.
The fact remains that we are way too close to the all time highs to be confident of the reversal into wave ‘3’.
But this wave count does remain a possibility here.
and I will follow this pattern until it is invalidated!
This weeks action is showing weakness again as the charts above speak to also.
So that weakness must now manifest on the short term chart and cause a solid decline into wave (i) for the rest of the week.
Lets see how tomorrow trade develops to see if we can start building that five wave pattern lower again into wave (i).
Tomorrow;
Watch for wave (i) to turn lower and trace out five waves down this week.
GOLD

GOLD 1hr.

GOLD 4hr.
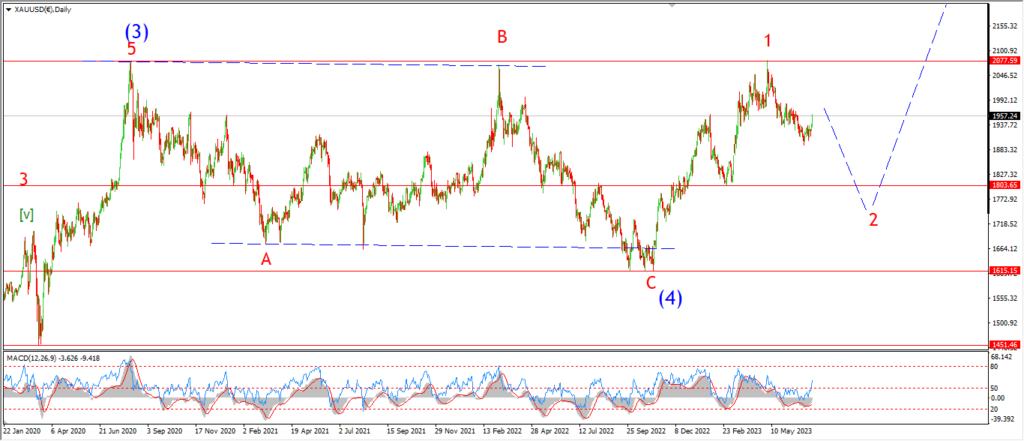
GOLD daily.
Take a look at the 4hr chart first of all tonight.
I wont dwell on it,
but I will just point out that the rally into the highs today hit the upper trend line and then reversed sharply off that level.
The main bullish pattern is still viable as that wave [i] level has not been broken yet,
but if the price breaks below the wave [i] high at 2009 again,
that will cause a serious headache for the bullish short term count.
And I will have to look again at the possibility of that alternate wave ‘2’ count.
I have marked todays lows as wave [iv] on the hourly chart.
The price must hold above 2009 at wave [i] for this pattern to remain valid.
and wave [v] must now start a major fifth wave extended rally to regain what has been lost off the top.
Tomorrow;
Watch for 2009 to hold and wave (i) of [v] to turn higher again.
If that fails to happen,
then we are back to the main alternate count again.
CRUDE OIL.

CRUDE OIL 1hr.
CRUDE OIL 4hr.
CRUDE OIL daily.
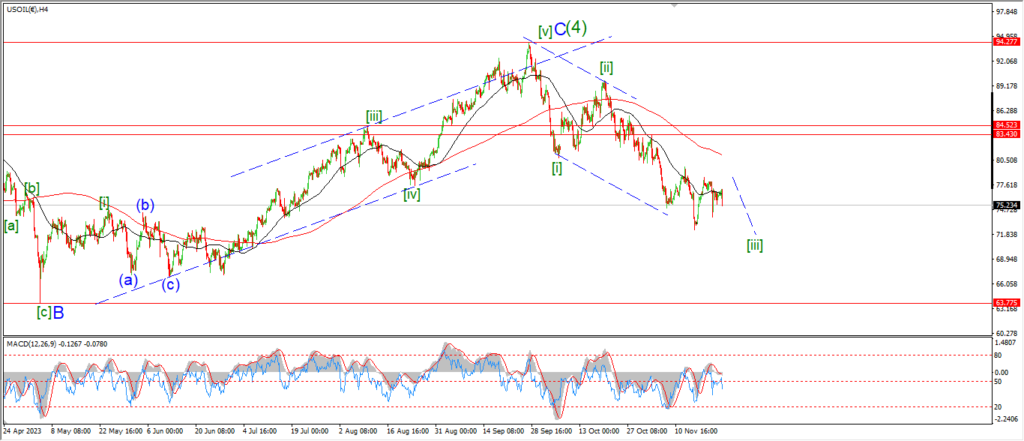
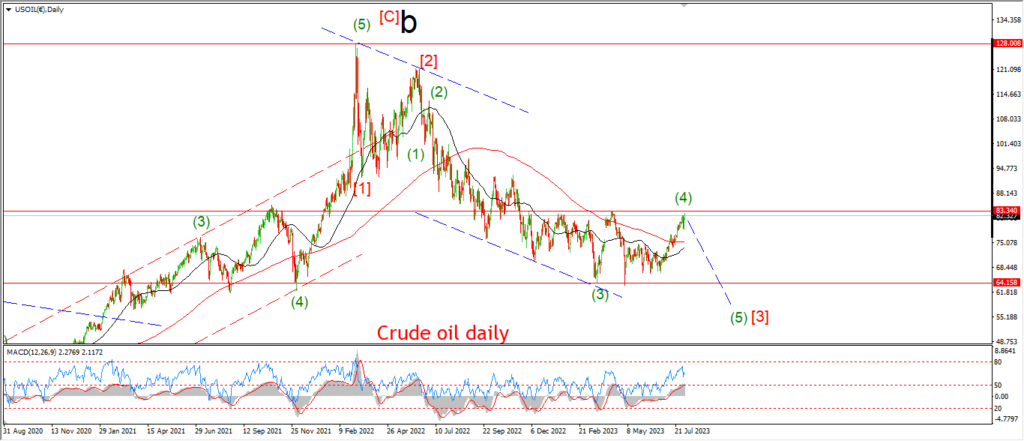
A rally off the lows today can be viewed as wave ‘iv’ of (v) now.
Wave ‘v’ of (v) should fall back below the minimum target at 72.37 again to complete this pattern.
I am looking at the 70.00 handle again as a lower end target for this wave (v) decline to complete.
Tomorrow;
Watch for wave ”i’ of (v) to hold at 75.10.
Wave ‘v’ should fall below 72.37 at a minimum.
S&P 500.

S&P 500 1hr
S&P 500 4hr
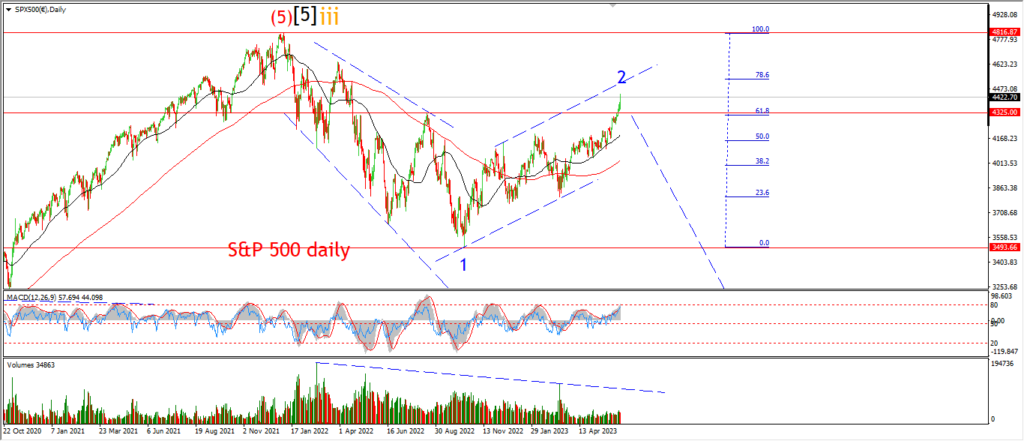
S&P 500 daily.
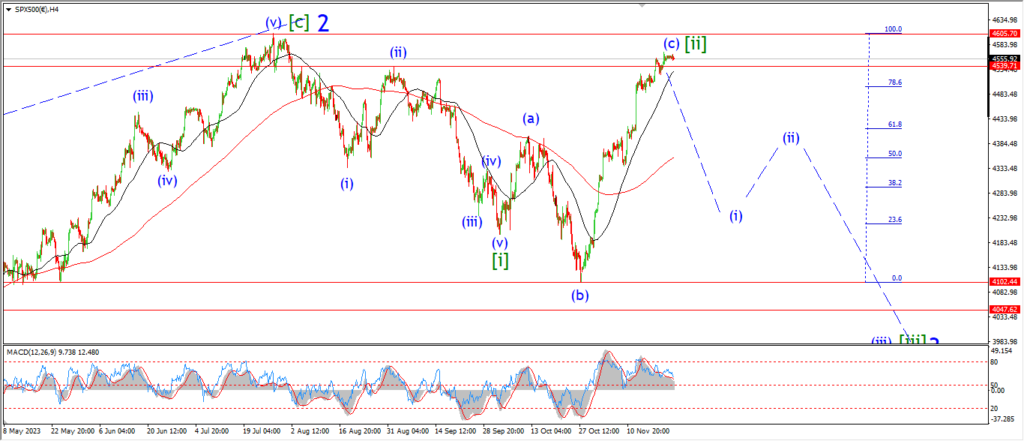
The short term count has recieved a stay of execution for one more day.
The price fell enough today to hold out some hope for a reversal into wave (i) of [iii] this week.
Now that is still a very big stretch goal for this weeks action,
but if the possibility remains for this bearish count here,
then I am going to stick with it until it is invalidated.
Tomorrow;
Wave ‘i’ of (i) must break below initial support at 4536.
I want to see a low in wave ‘i’ nearer to 4500 again to be honest.
so lets see if this can get underway tomorrow.
The high at 4606 must hold.
SILVER.

SILVER 1hr

SILVER 4hr.
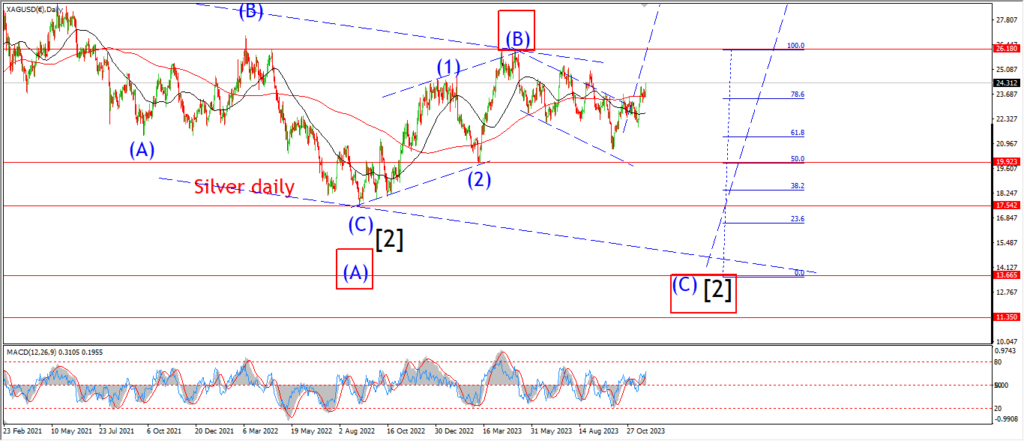
SILVER daily.
The decline today has retraced most of last weeks rally as we hit the close tonight.
The main count calls for a decline into wave ‘ii’ of (iii) for the next few days.
So I think that idea is in play for sure.
And we should see a three wave decline back into the area of the wave (i) high at about 23.50 over the coming days.
As for the alternate count.
This decline has only raised the probability of that idea now.
so we need to keep one eye on that alternate pattern on the 4hr chart as we go along this week.
A break of 21.90 agian will really boost the alternate count.
Tomorrow;
Watch for wave ‘ii’ to trace out three waves down over the next few days.
the target area lies at the initial support level of about 23.50.
BITCOIN

BITCOIN 1hr.
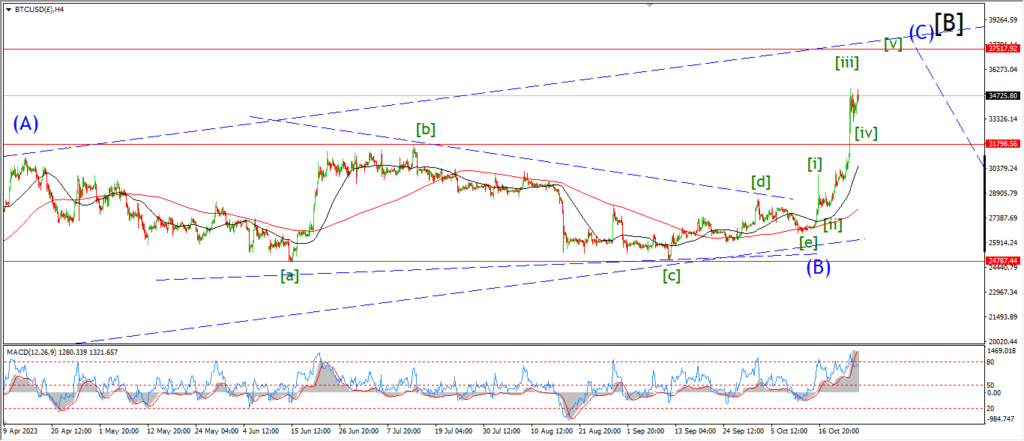
BITCOIN 4hr.
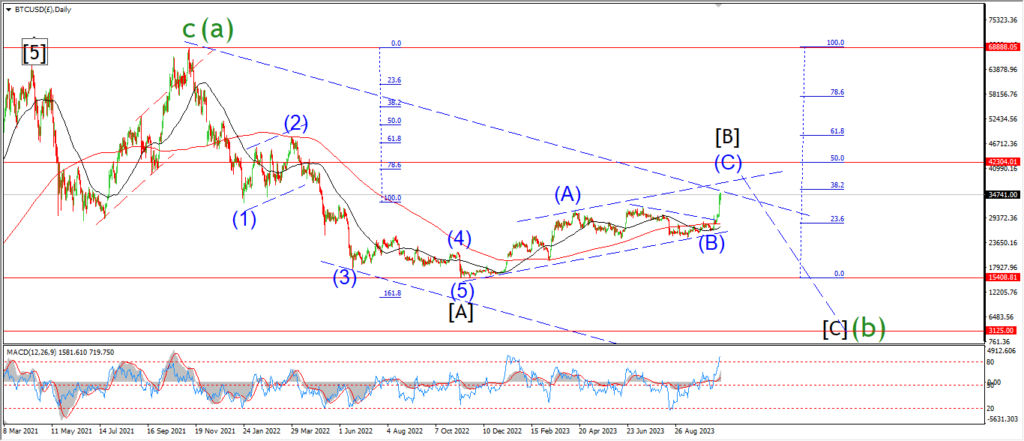
BITCOIN daily.
….
FTSE 100.

FTSE 100 1hr.
FTSE 100 4hr.

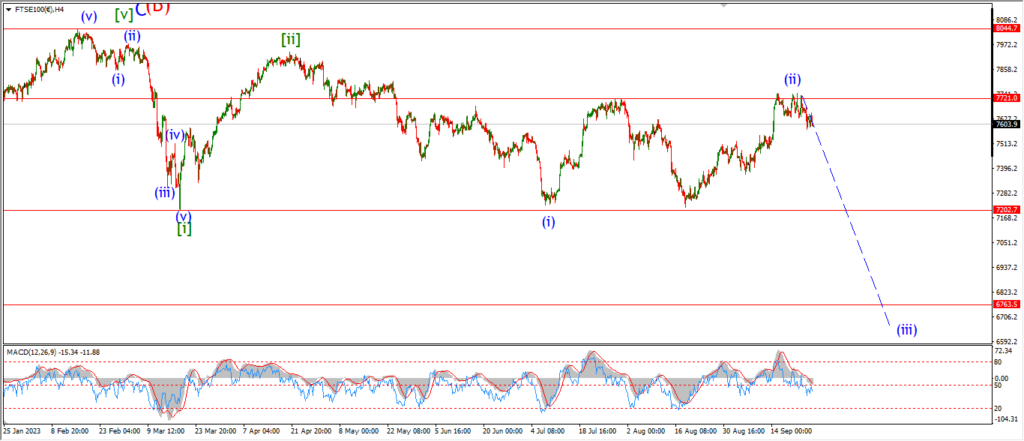
FTSE 100 daily.
….
DAX.

DAX 1hr
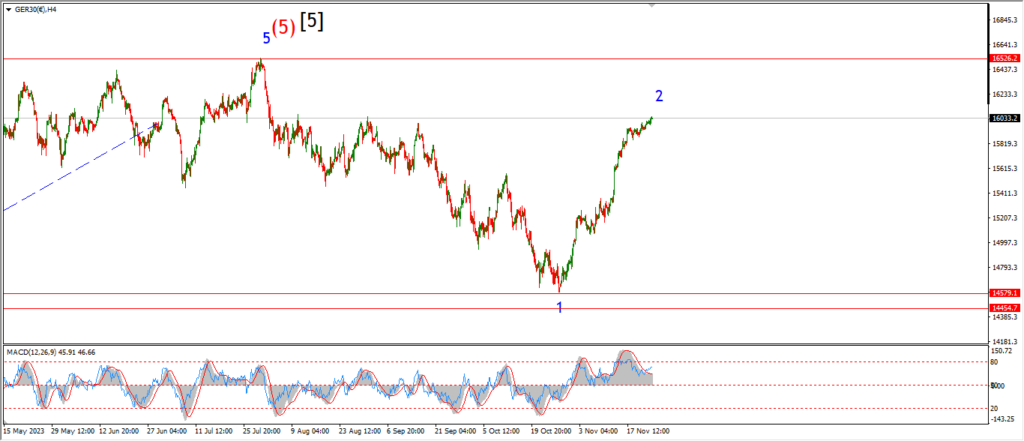
DAX 4hr

DAX daily.
….
NASDAQ 100.

NASDAQ 1hr
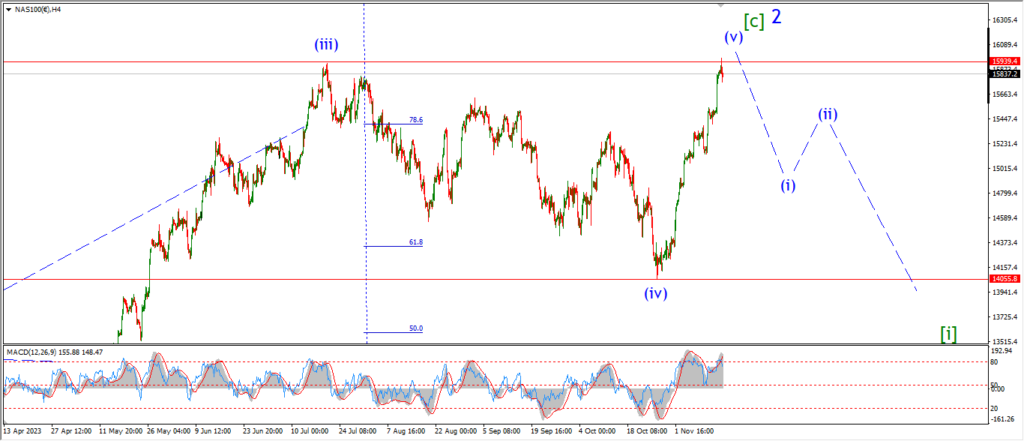
NASDAQ 4hr.
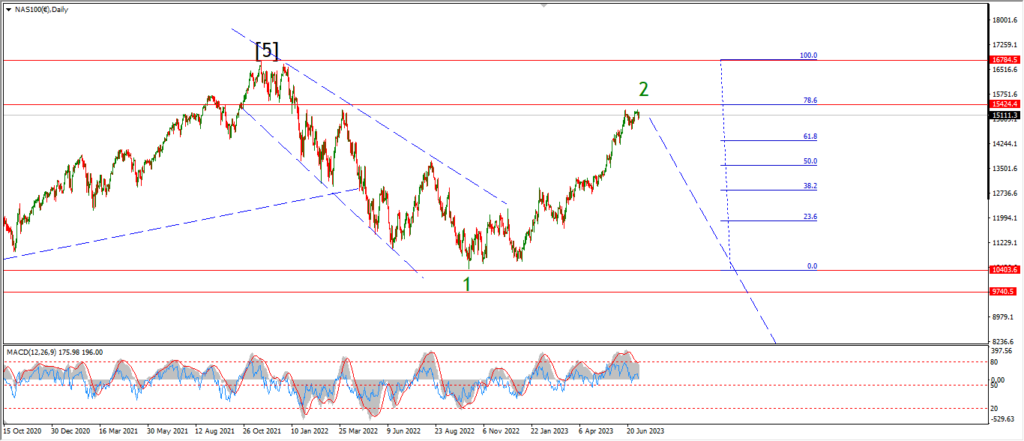
NASDAQ daily.
….