
Good evening to one and all.
If you are like me,
I dont expect you to be,
but if you are like me,
then you tend your view of the longer term is far too heavily influenced by the minute happenings from day to day.
Someone said once not to condemn your whole life just because your having a bad day!
That’s a truism I should live by!
Anyway,
this week has been like chewing glass for me.
The short term action in some of the markets I am following is not going how I suspected it would.
So now I have to take my own advice.
Step back,
take a look at the bigger picture,
and see if my assumptions are completely wrong from the outset.
And if so,
where am I wrong.
So with that said,
I want to concentrate on the 4hr charts tonight,
so lets get into the bigger picture.
https://twitter.com/bullwavesreal
EURUSD.
EURUSD 1hr.
EURUSD 4hr.

EURUSD daily.
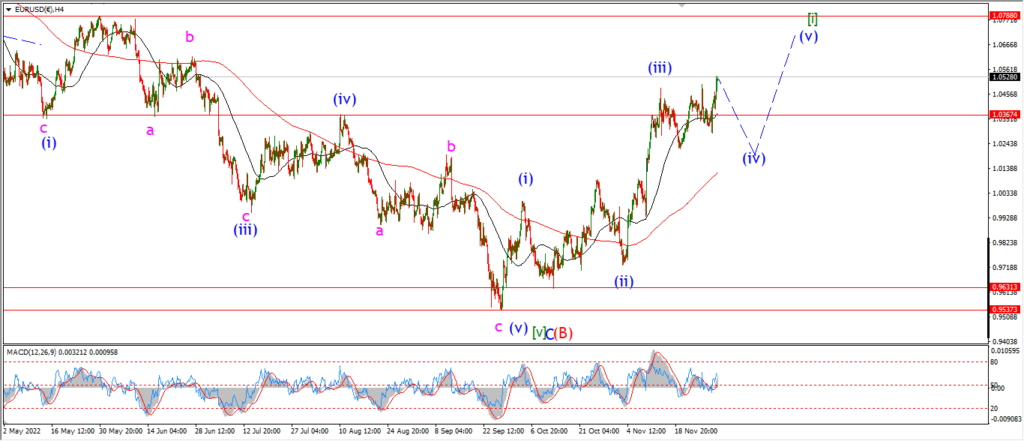
EURUSD has a slightly different pattern operating after we zoom out and take a look at the 4hr chart.
The market has been in corrective mode for about two weeks now.
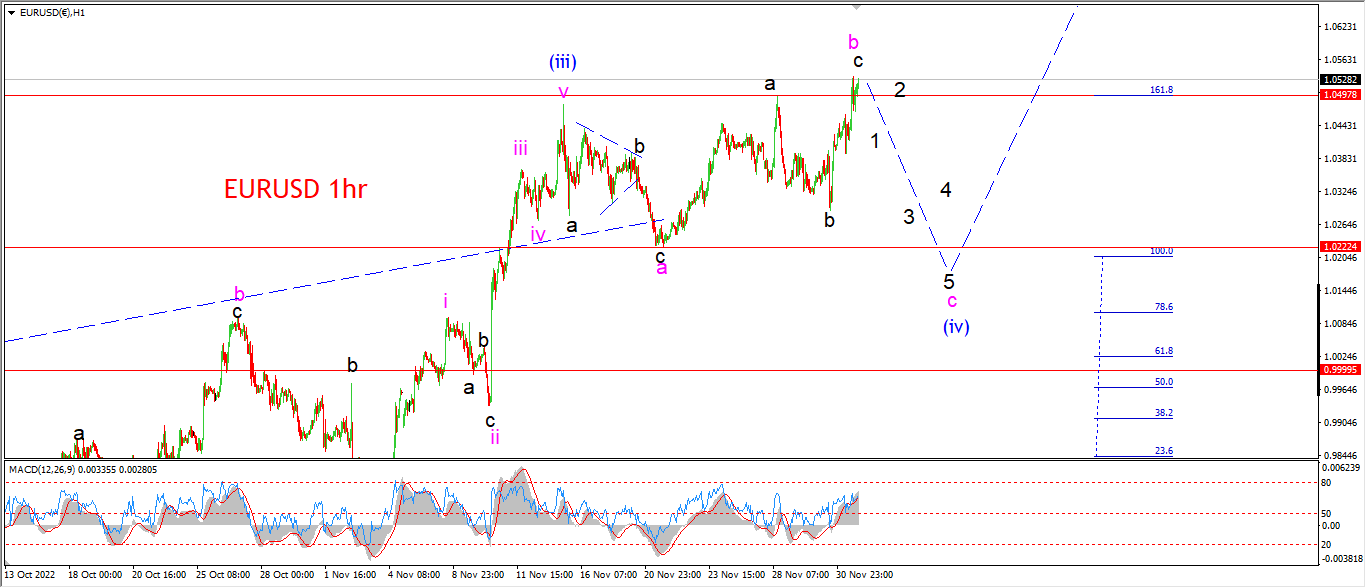
And I now think this whole correction is in wave (iv) of [i].
The new high this week is a three wave rally in wave ‘b’ of (iv).
and if this pattern is correct,
then we will see another decline into wave ‘c’ over the coming days to complete an expanded flat correction.
Wave (v) will come along,
but wave (iv) needs one more drop to complete the pattern.
Tomorrow;
Watch for wave ‘b’ of (iv) to top out and then reverse into wave ‘c’ next week.
GBPUSD
GBPUSD 1hr.
GBPUSD 4hr.

GBPUSD daily.
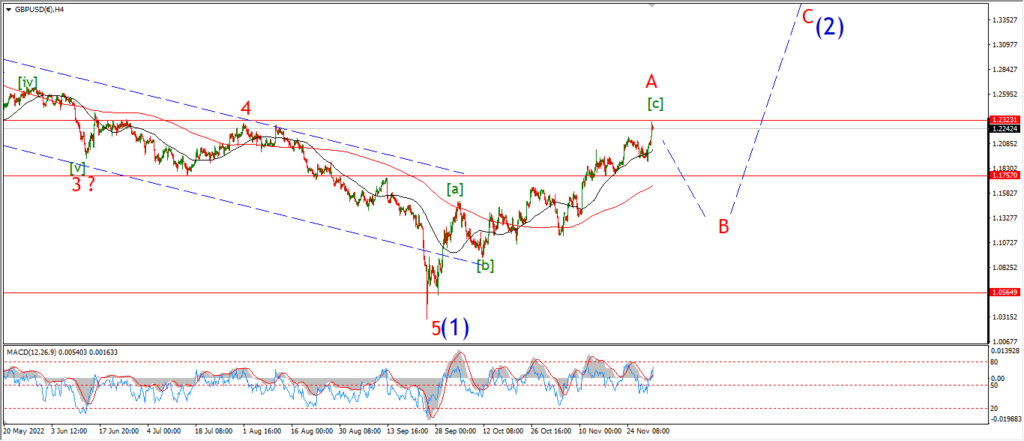
About a month ago I was looking at an initial target for wave ‘A’ up near the 1.23 level.
And even I though that was a stretch to be honest!
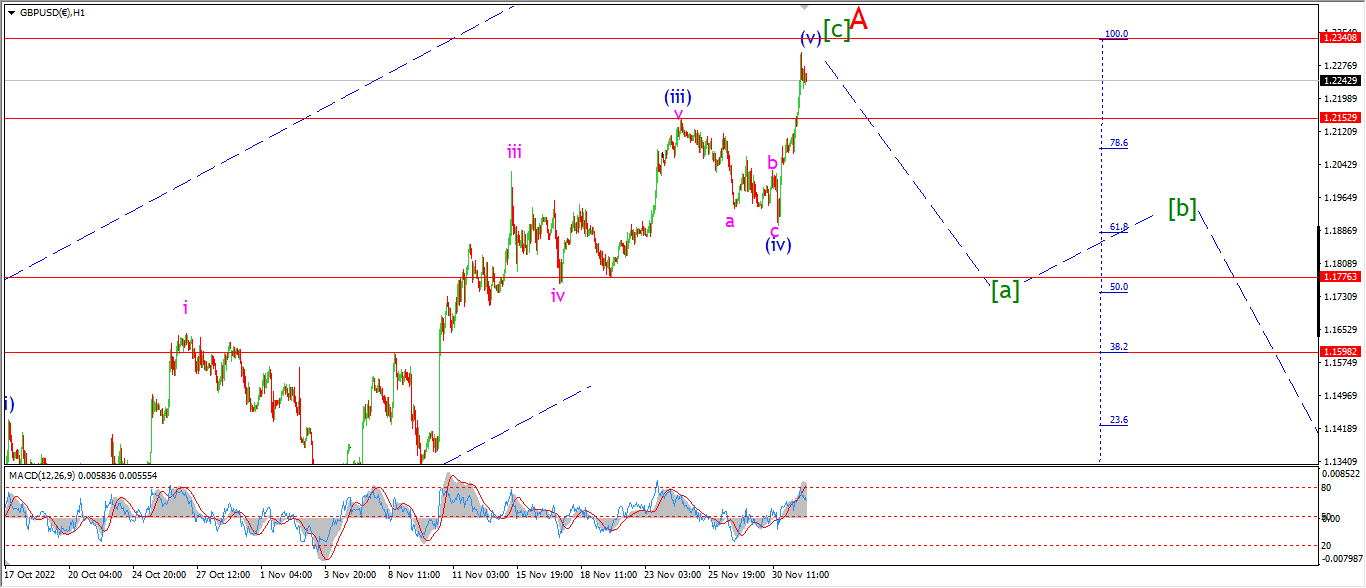
And now here we are hitting 1.2300 and the internal pattern of wave ‘A’ seems complete.
That three wave decline into wave ‘B’ has not begun yet,
but it will soon enough.
and when it does,
I suspect in a months time we will be looking at a low in wave ‘B’ near the 1.1000 area again.
That might seem a stretch now,
but lets wait and see!
I do think wave wave [c] of ‘A’ has traced out an extended pattern for sure,
and that is what I am going with on the 1hr chart.
Tomorrow;
Wave [c] has reached equality with wave [a] today.
That longer term target has now been hit.
I am looking for wave (v) of [c] to top out now and an initial decline into wave [a] of ‘B’ to come bext week.
USDJPY.
USDJPY 1hr.
USDJPY 4hr.

USDJPY daily.
6 weeks ago this pair was on a complete tear and the rally looked like it would never stop.
That of course was a typical fifth wave blow off top,
and we were looking for a top to come in.
And indeed it did.
Now the headlines are talking about the worst month the USD has had in so many years!
How quickly we forget eh!
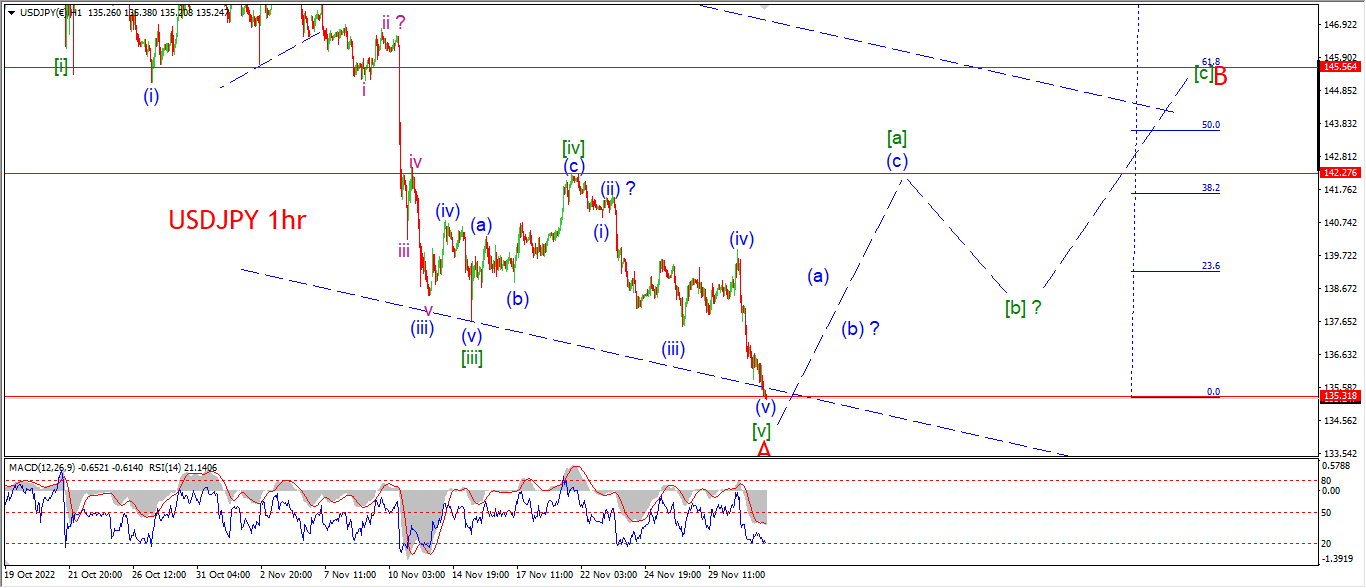
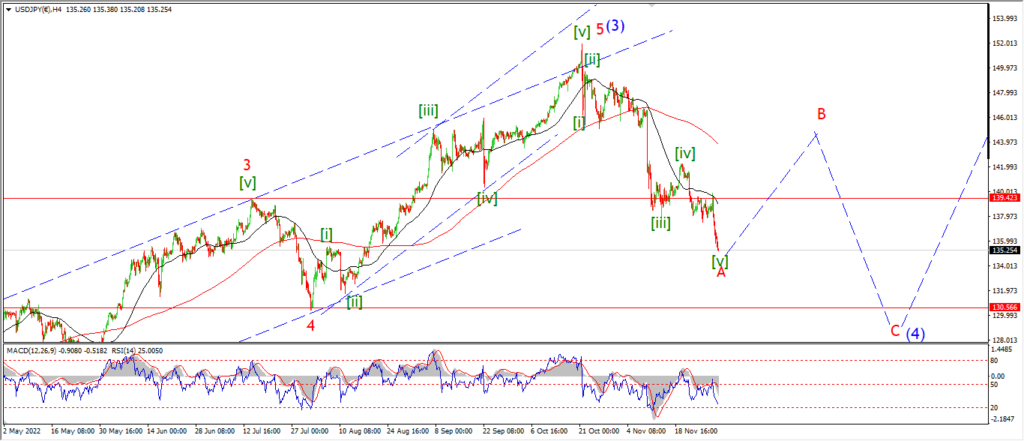
I have switched patterns for wave ‘A’ now and we are closing out a five wave decline rather than the previous three wave pattern I was working with.
The price has retraced back into the price territory of the previous wave ‘4’.
And now I do think it is time for a relief rally in wave ‘B’ as shown.
That three wave rally in wave ‘B’ is coming.
And in a months time I will not be surprised to see this pair up near 145.00 again at the 62% retracement level of wave ‘A’.
Tomorrow;
Watch for wave [v] of ‘A’ to find a low very soon.
A break back above 138.00 again will signal wave (a) of [a] is underway.
DOW JONES.
DOW 1hr.
DOW 4hr
DOW daily.
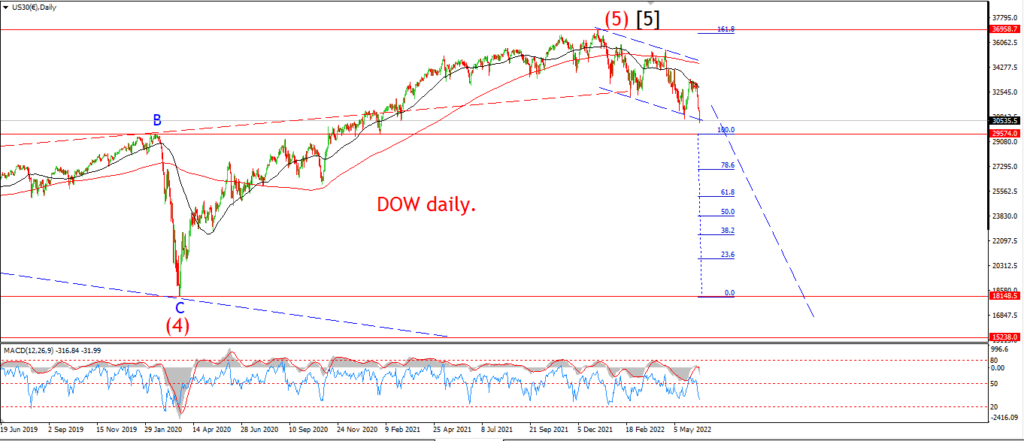
Now the stock market has been the biggest thorn in my side over the the last month.
Back in mid October I was looking for a corrective rally to begin.
I was thinking in terms of a three wave correction in wave (ii) up towards the 32500 area at a stretch.
That size of correction would bring wave (ii) up towards the 62% retracement level of wave (i).
That model failed.
So now we need a new perspective.
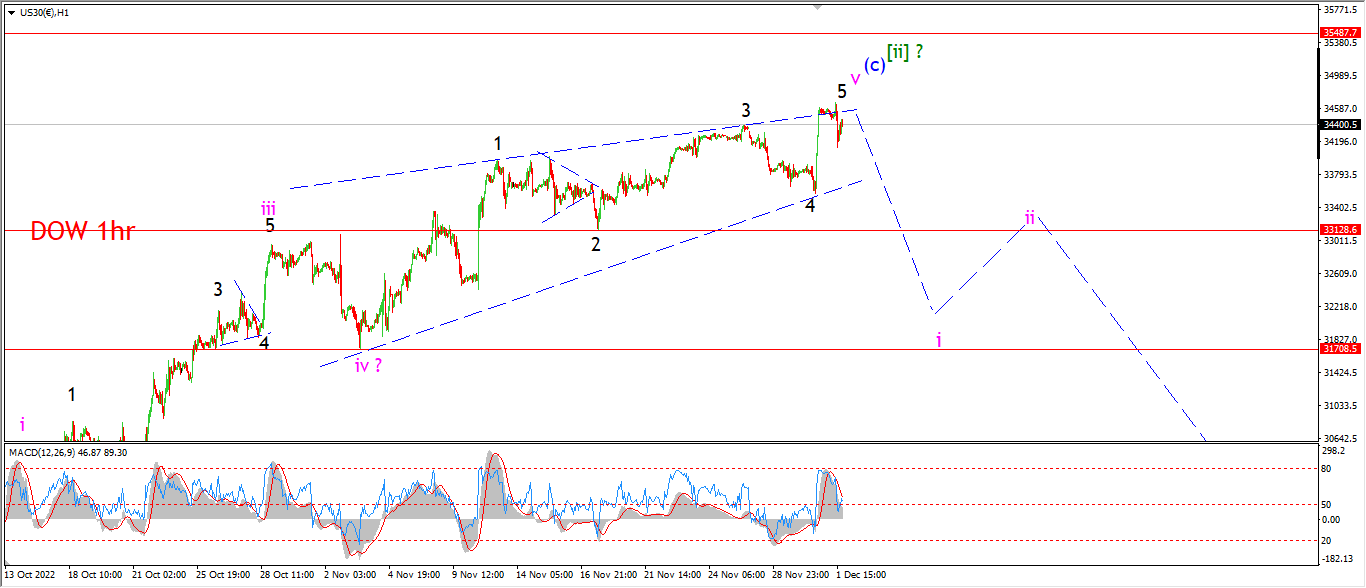
I am still pretty sure this rally is part of a correction alright,
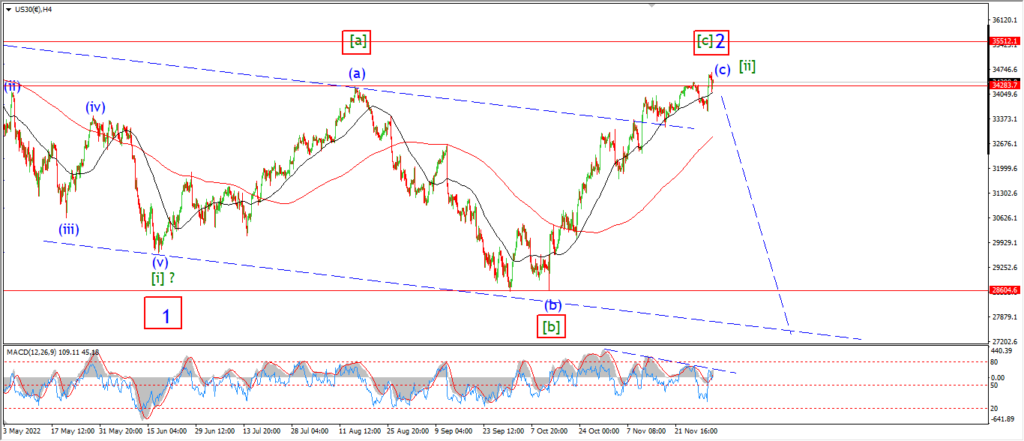
but now I view this rally as either wave (c) of [ii],
or wave [c] of ‘2’.
The pattern is the same,
but latter is one degree higher than the former.
And both wave counts have completed the minimum expected for the expanded flat pattern.
Also,
both counts point lower in a very big way over the next few months.
The danger now in this market is about as large as it was at the highs of the summer rally.
And the outcome will be a larger decline I suspect.
The momentum picture on the 4hr chart is still showing a major bearish divergence.
So I can’t see any other outcome here but a third wave decline coming our way.
The short term may be jubilliant,
long term, there will be tears!
Tomorrow;
Watch for signs of exhaustion at the end of this fifth wave rally.
the breakdown will come,
and when it does the selling will seem relentless.
GOLD
GOLD 1hr.
GOLD 4hr.

GOLD daily.
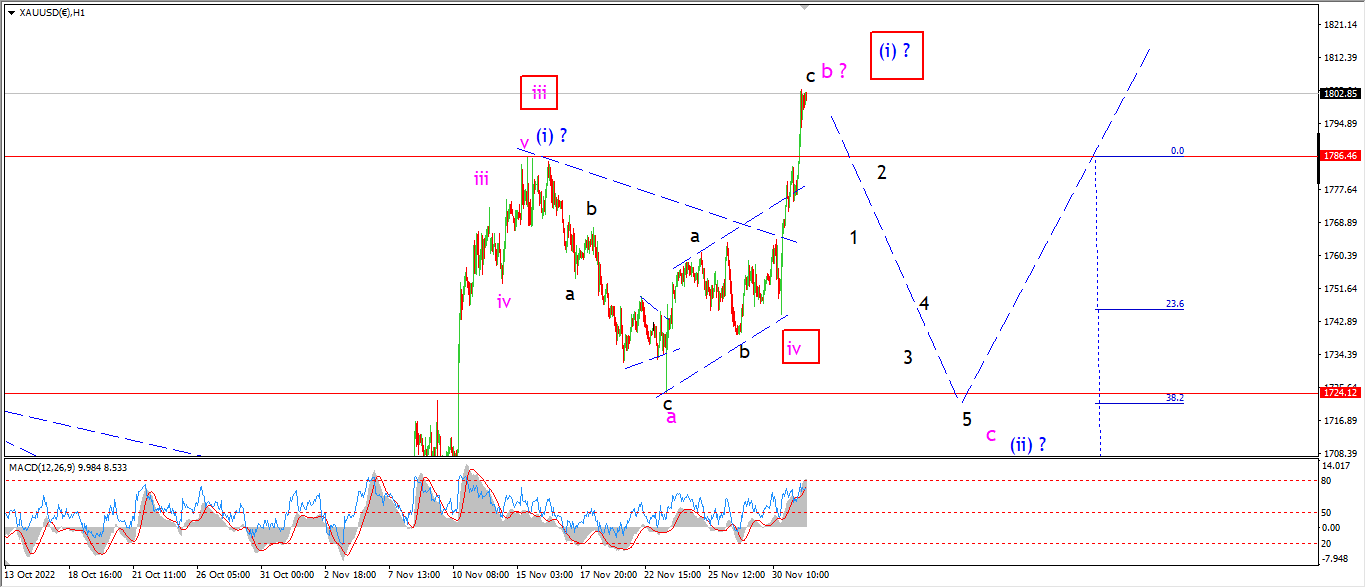
The rally in gold was welcome and I think we are pointing higher for the longer term now.
But that does not mean it is a vertical path higher for years to come.
I think we are on the verge of another selloff in gold.
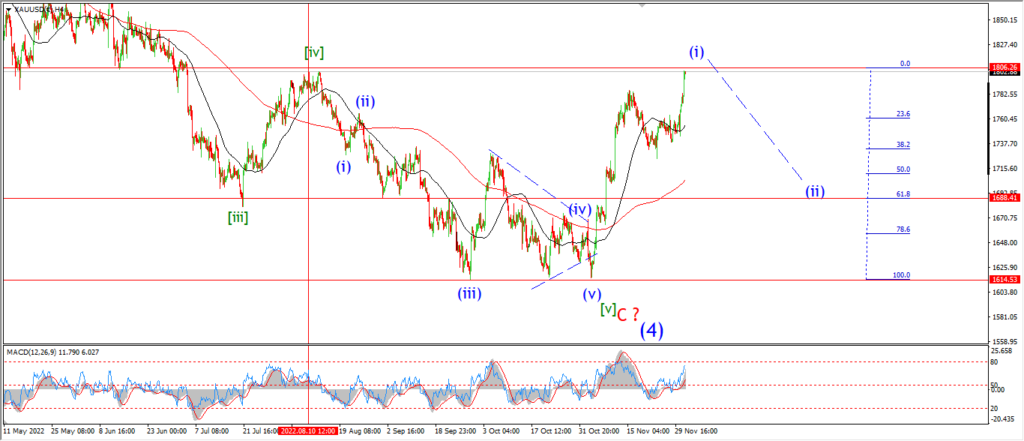
This should prove to be a correction lower in wave (ii).
and I am looking for a low between 1715 and 1688.
that will bring us to the 62% retracement level of wave (i).
And at that point,
we will be ready to put in a bullish higher low and wave (iii) will be ready to rally again.
Tomorrow;
the short term pattern is valid as an expanded flat correction where wave ‘c’ should begin a decline in five waves over the coming weeks.
There is an alternate count for wave (i) which is still looking for that top in wave (i) to come.
either way,
I think this weeks rally will be retraced fully in the next weeks.
CRUDE OIL.
CRUDE OIL 1hr.
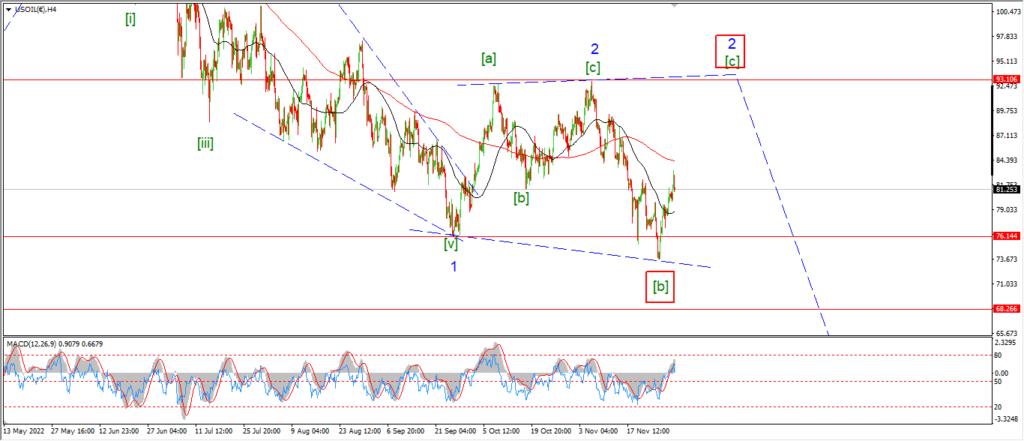
CRUDE OIL 4hr.
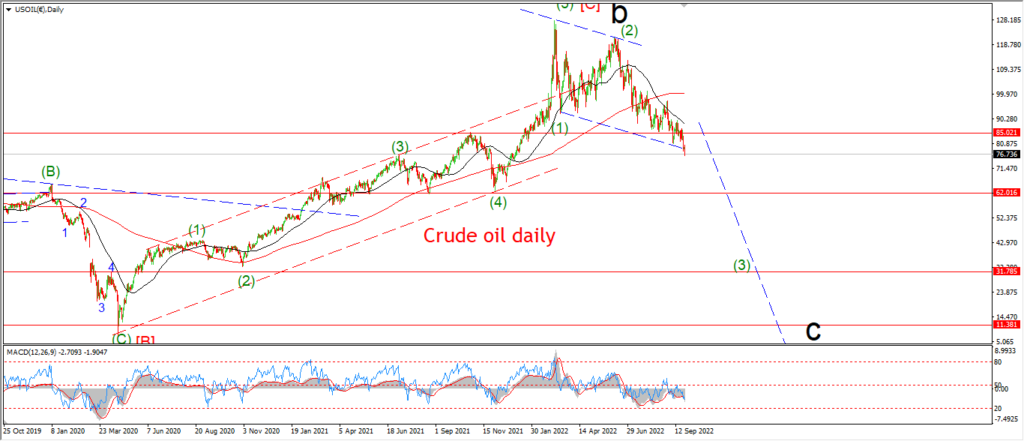
CRUDE OIL daily.
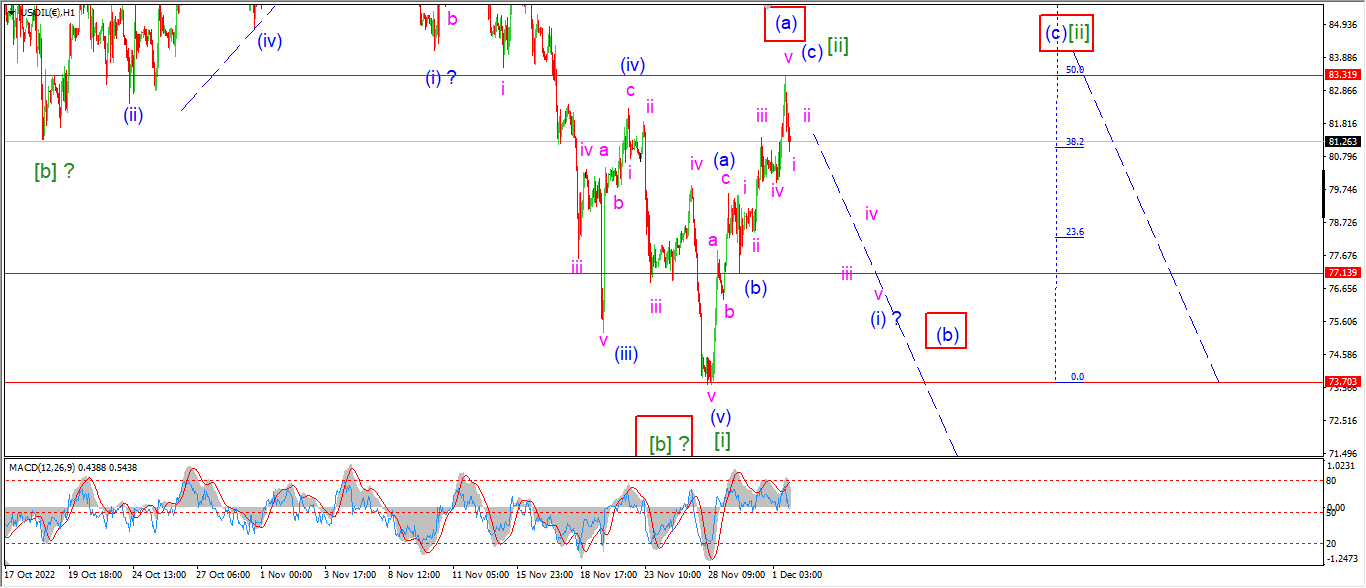
The short term pattern in crude has not been invalidated this week.
In fact it has gone pretty well so far,
but I am not ruling out the alternate count on the 4hr chart at all yet.
In fact,
if the alternate count is correct for wave ‘2’ blue.
then we will see the price action confirm that pattern next week.
So watch out for a possible pattern break in crude next week.
Tomorrow;
As for the main count,
the action has topped out a three wave rally at todays high and the top came in at 50% retracement level of wave [i].
wave [ii] is looking like it is now complete.
A break below the wave (b) low at 77.14 again will signal wave (i) of [iii] is underway.
Watch for wave ‘i’ and ‘ii’ to hold a lower high below wave [ii] tomorrow.
There is an idea also that this top is only wave (a) of [ii],
in that case we will see a drop in three waves next week to a higher low.
S&P 500.
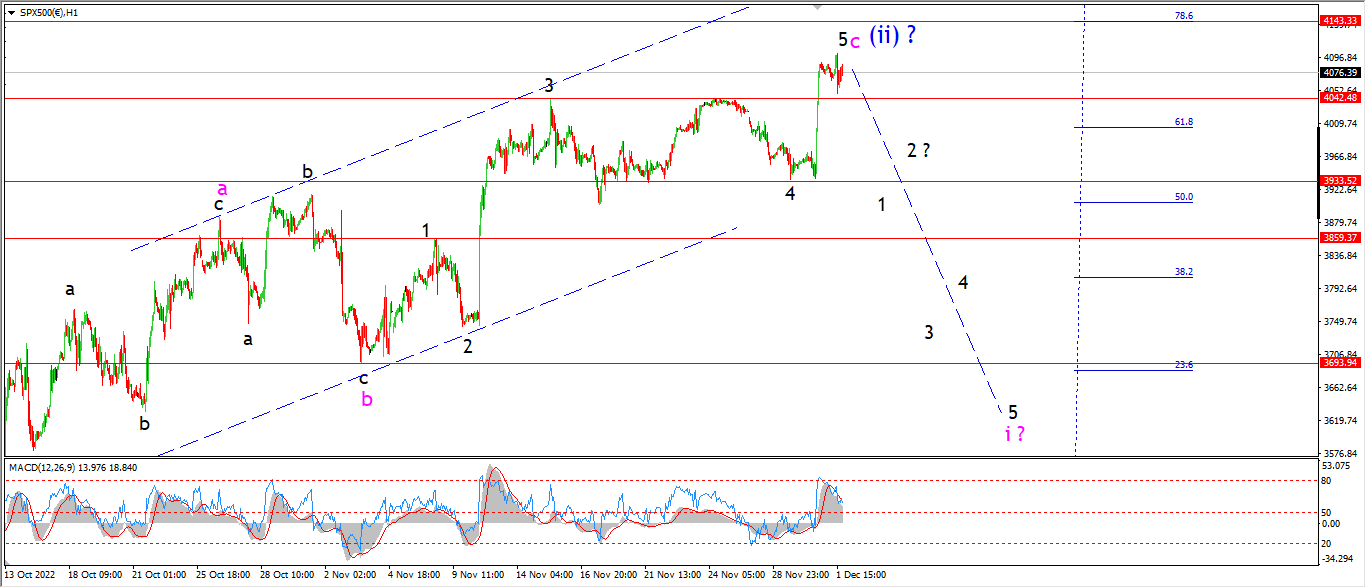
S&P 500 1hr
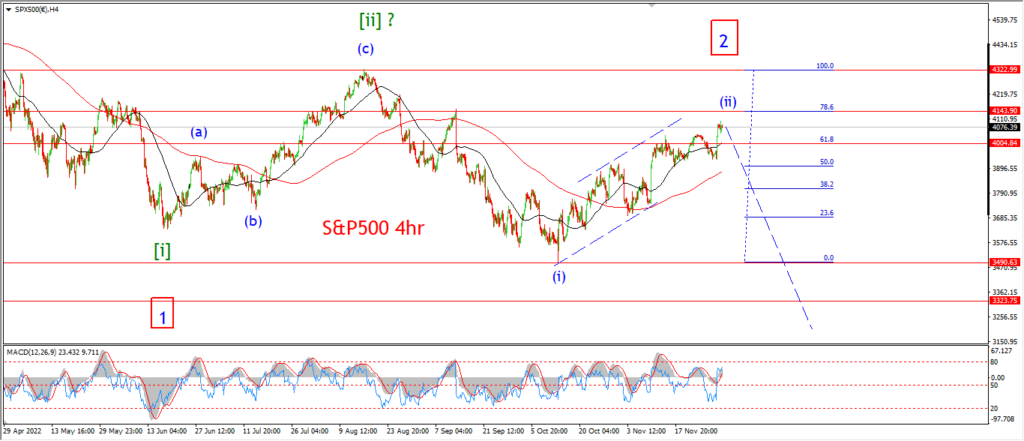
S&P 500 4hr
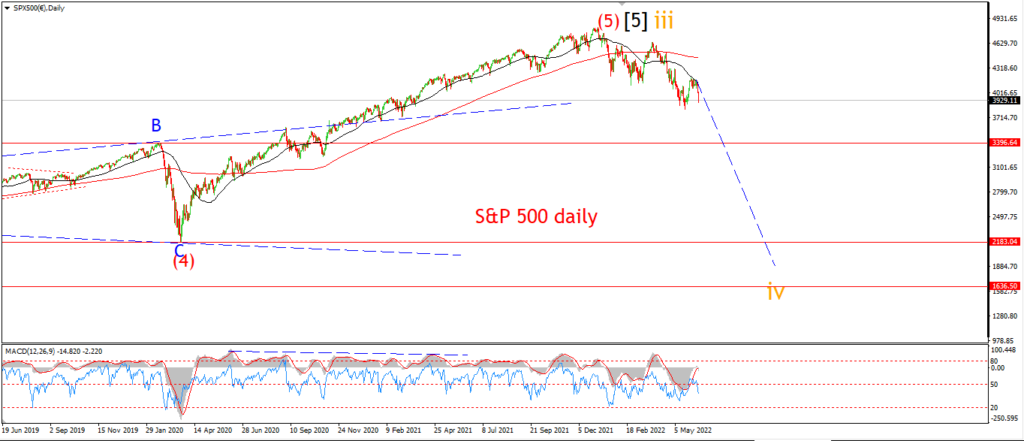
S&P 500 daily.
The rally in wave (ii) has been large enough to convince the crowd that all is well in the markets,
and of course at the end of a corrective rally it is now time to buy the dip…..
On the 4hr chart you can see that the wave (ii) wave count is still in play here.
the price has managed a retracement back between the 62% and 78.6% of the wave (i) decline.
Of course this is not a guarantee that the top is in,
but I can add to that Fib retracement the sentiment in the market.
And I can raise you a bearish divergence in momentum.
And there is the small matter of a collapsing economy underway.
But of course this all means nothing until the the buying public drops the bit out of their mouth,
and sentiment turns to the downside again.
Tomorrow;
Wave ‘5’ of ‘c’ has completed a five wave pattern this evening.
And wave ‘c’ has completed another five wave pattern.
And wave (ii) has a three wave pattern in place now also.
The turn will come.
Lets see if it comes tomorrow.
SILVER.
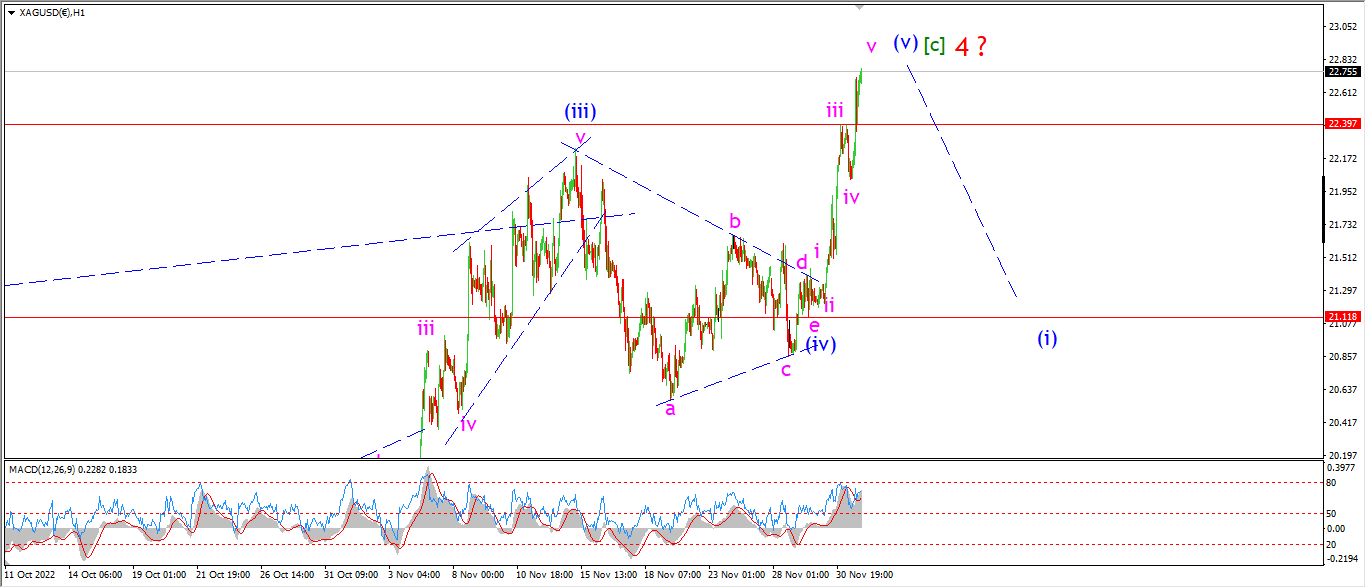
SILVER 1hr
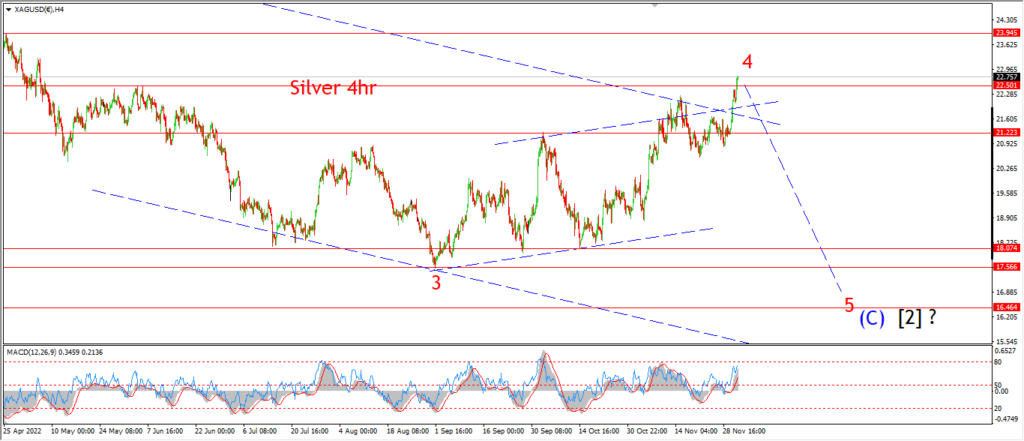
SILVER 4hr.
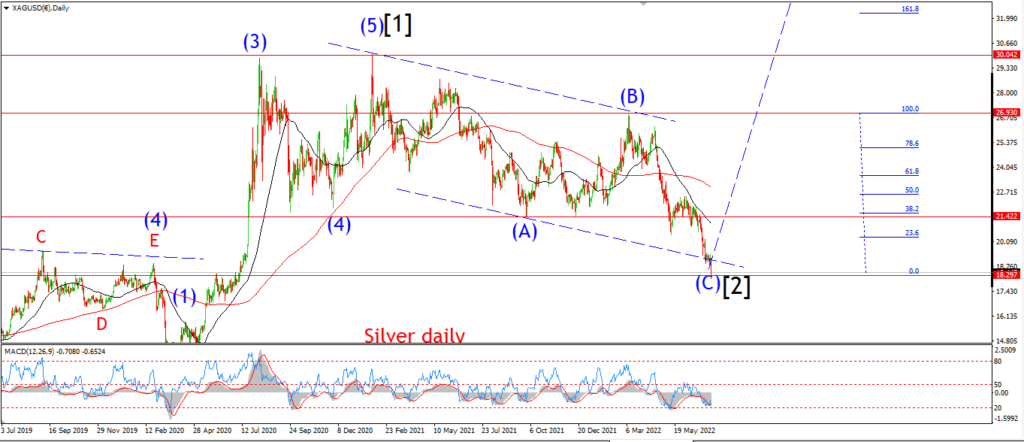
SILVER daily.
I have been wrong over the last two weeks on the timing of the turn into wave ‘5’ down in silver.
The short term pattern caught me off guard.
I apologise for that.
There is no escaping the three wave form of the rally in silver off the lows of late summer.
This market is ripe for a big decline,
and I suspect that decline will be a five wave pattern to a new low in wave ‘5’ of (C).
Tomorrow;
The short term pattern shows a triangle wave (iv) now followed this week by a rally in wave (v).
This completes wave [c] of ‘4’.
and wave ‘5’ down is coming.
The reversal off the rally this week will have to wait until next week now.
But when wave (i) comes,
I think we will see an easy retracement of wave (v) as shown.
BITCOIN
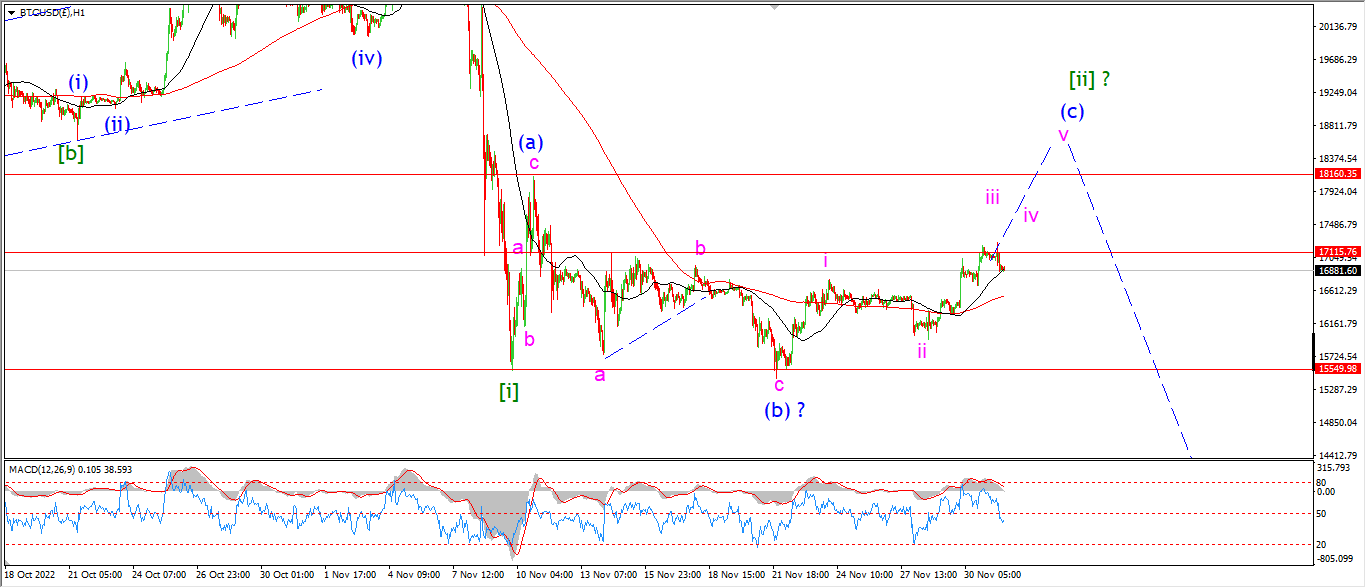
BITCOIN 1hr.
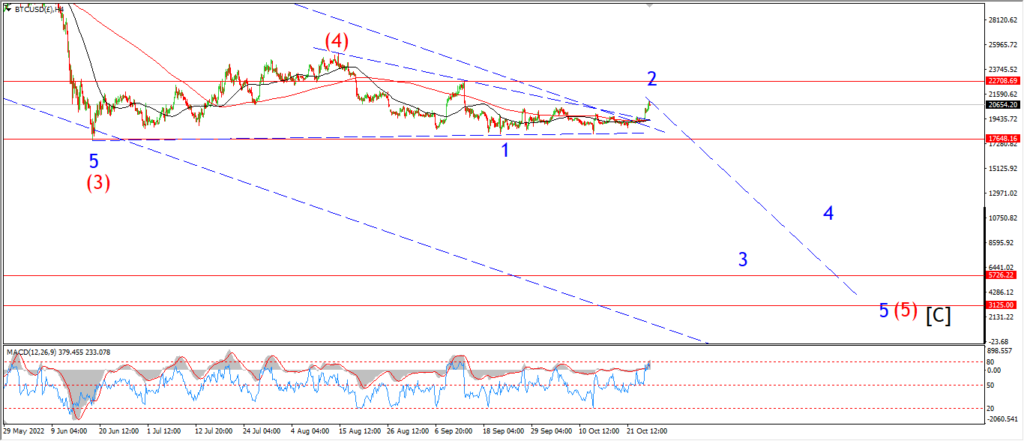
BITCOIN 4hr.

BITCOIN daily.
….
FTSE 100.
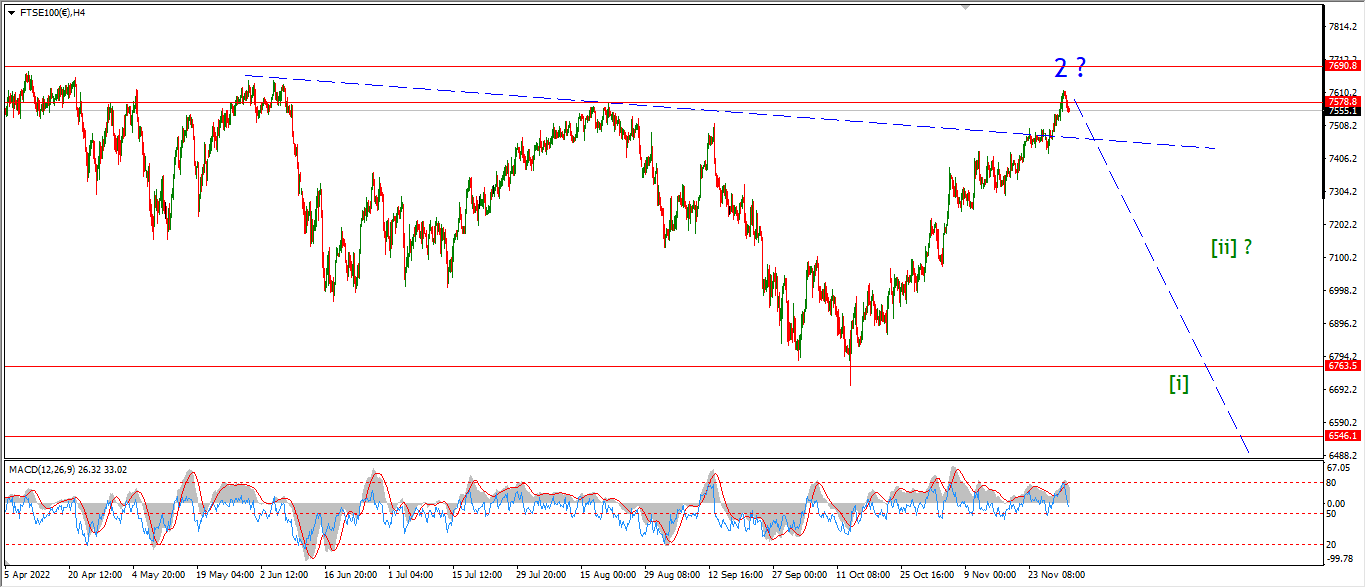
FTSE 100 1hr.
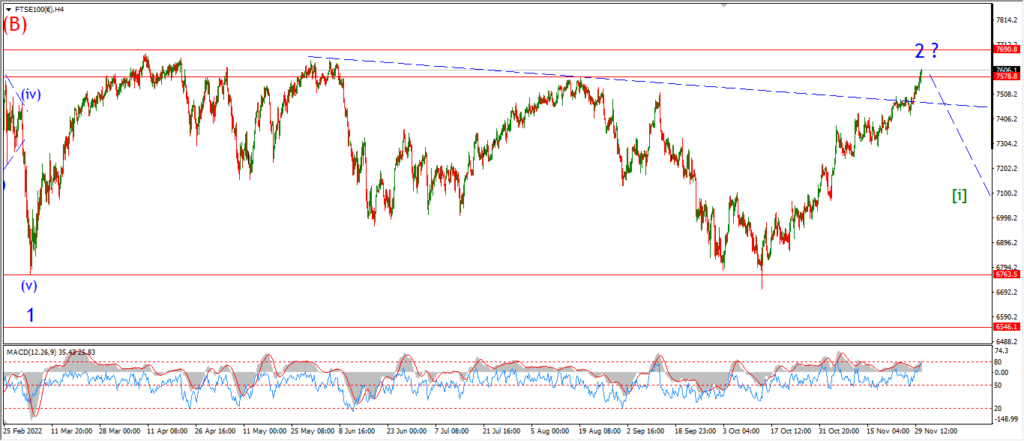
FTSE 100 4hr.

FTSE 100 daily.
….
DAX.
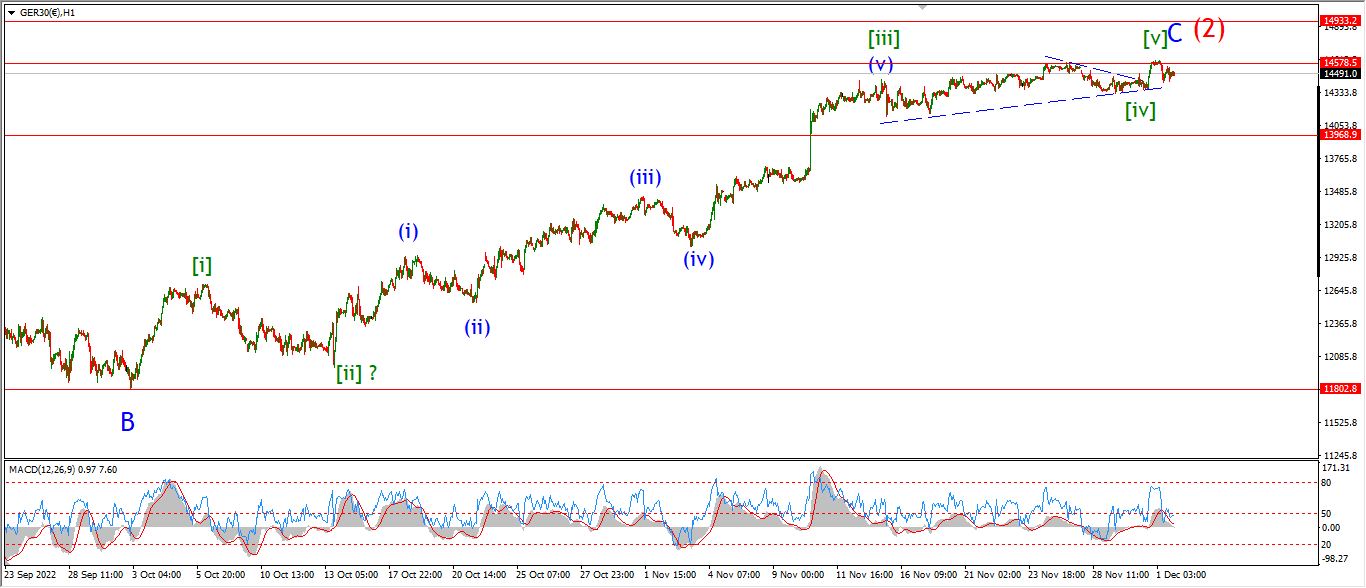
DAX 1hr
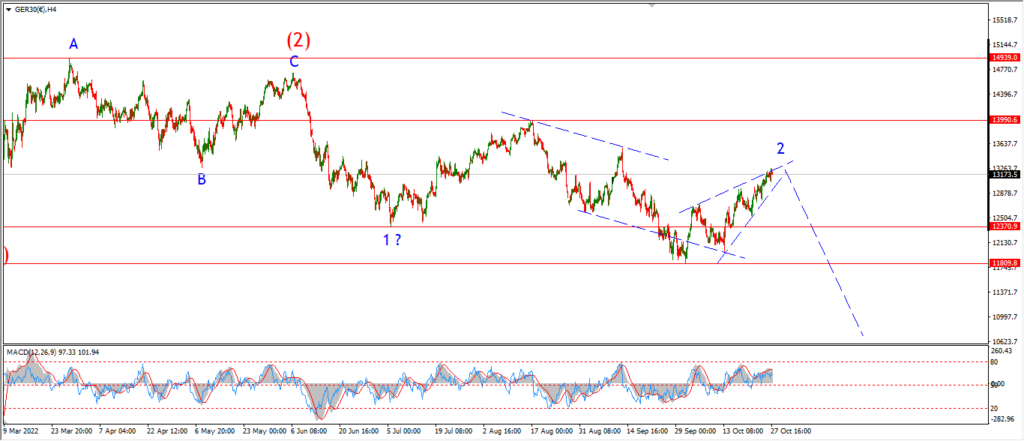
DAX 4hr

DAX daily.
….
NASDAQ 100.
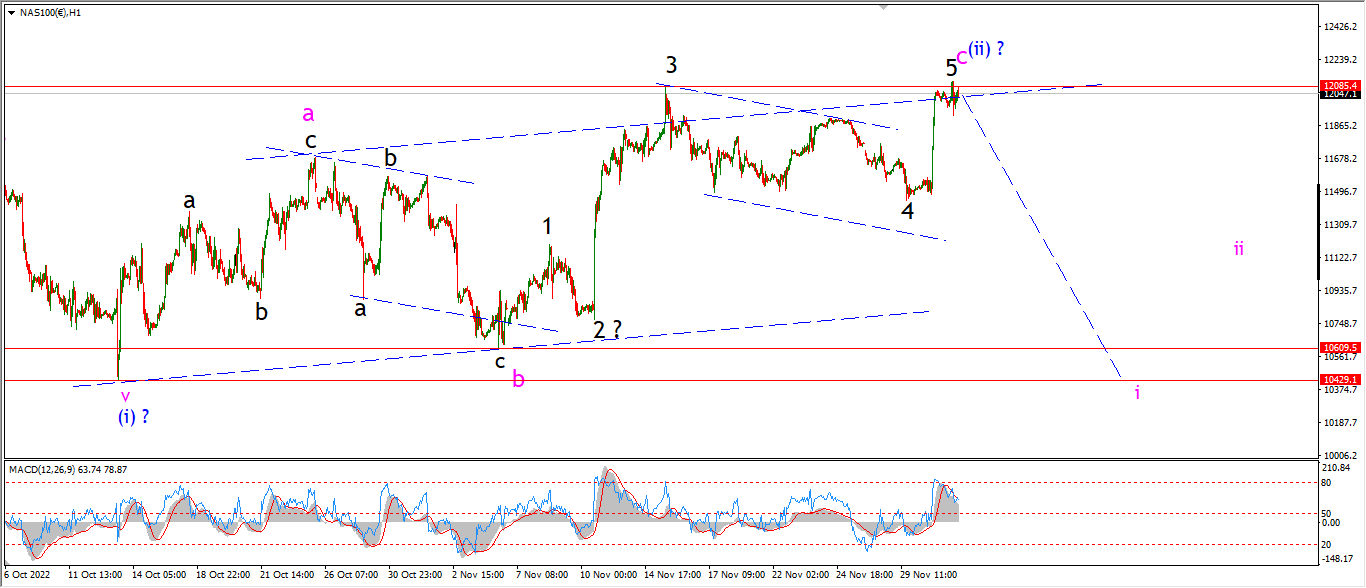
NASDAQ 1hr
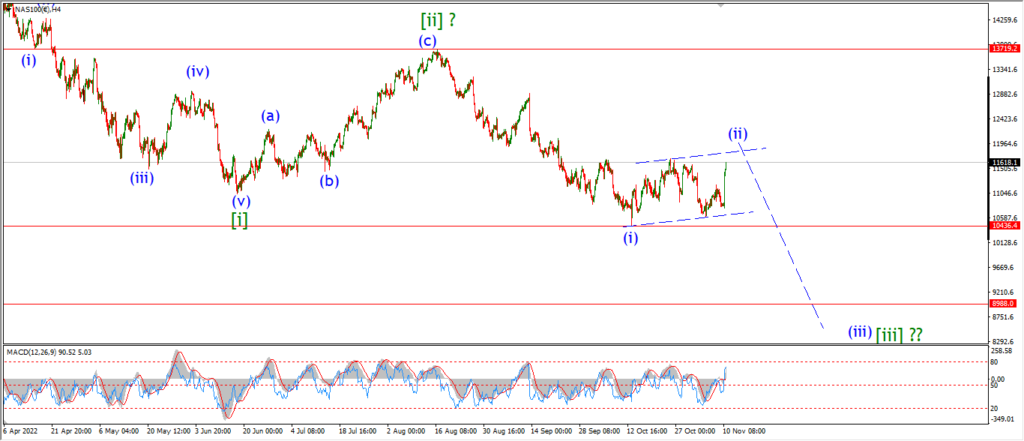
NASDAQ 4hr.

NASDAQ daily.
….