
Good evening folks, the Lord’s Blessings to you all.
https://twitter.com/bullwavesreal
EURUSD.

EURUSD 1hr.
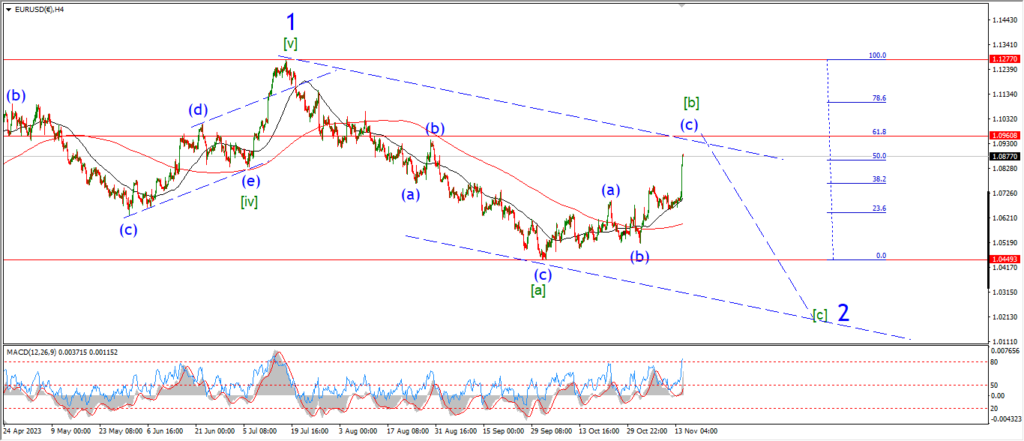
EURUSD 4hr.
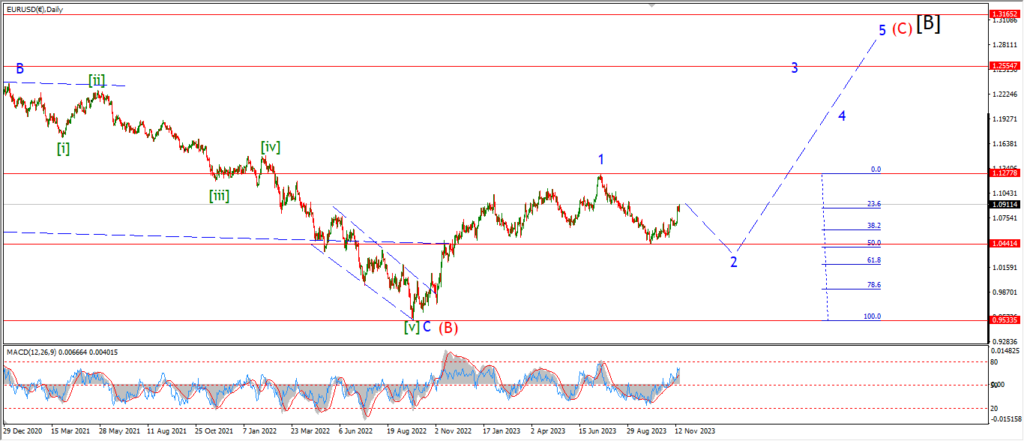
EURUSD daily.
We have some weakness off the top of wave ‘v’ today but without any significant drop to read into yet.
I mentioned the fourth wave ‘iv’ low at 1.0851 as the first level of interest here,
so that I will hold my thoughts until we get a break of that level.
Tomorrow;
I know I am repeating myself alot these days,
but lets see if the price can make a turn into support and break that wave ‘iv’ low again.
GBPUSD
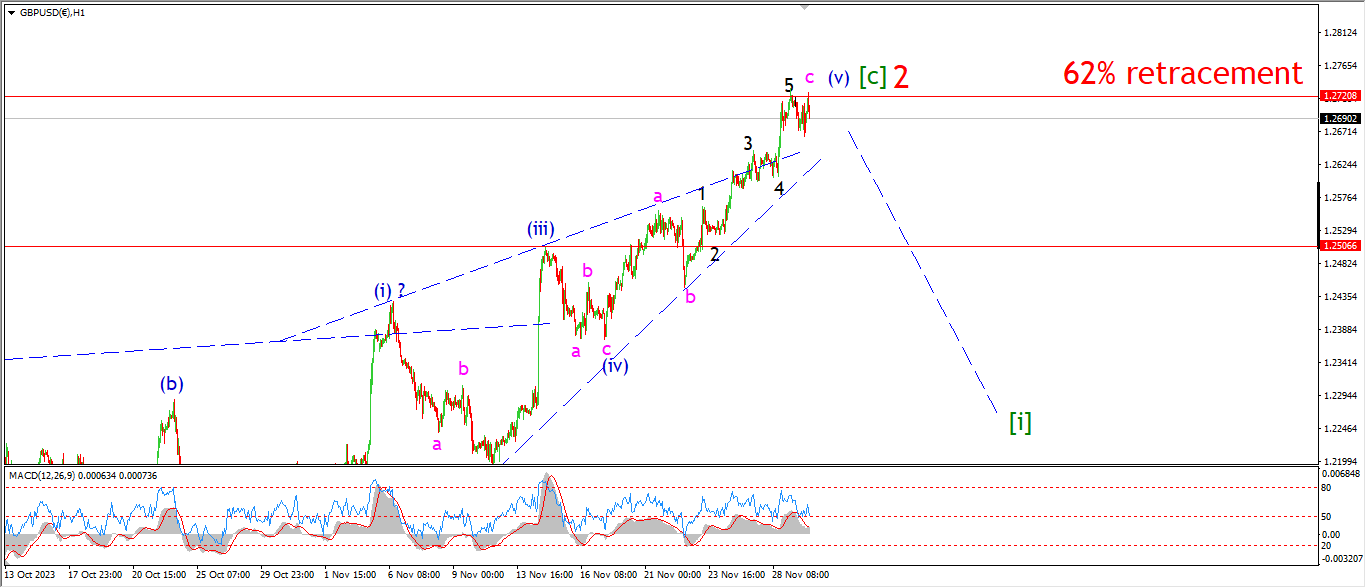
GBPUSD 1hr.
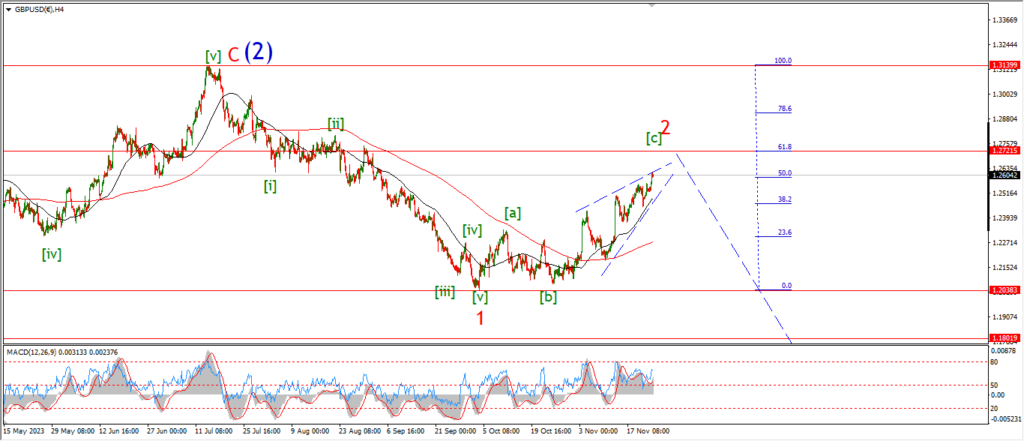
GBPUSD 4hr.
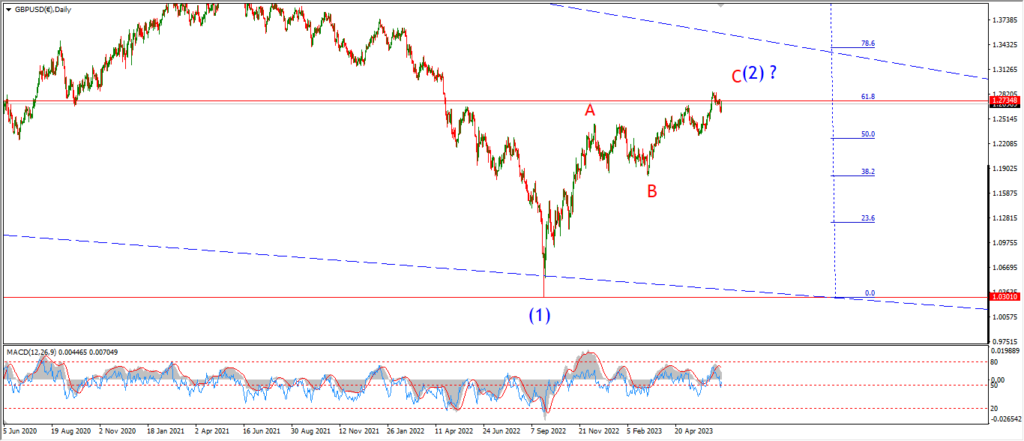
GBPUSD daily.
Cable is now holding at the 62% retracement level of wave ‘1’ over the last few days.
That level comes in at 1.2721.
That retracement level is significant enough to at least expect a resistance to the rally to form in this area.
the price has not dropped impulsively off the high at wave ‘2’ yet,
I do hold out some hope that we can see that happen before the end of the week.
Tomorrow;
Watch for a signal that wave ‘2’ is complete at this Fib retracement level with an impulsive drop off the top.
USDJPY.
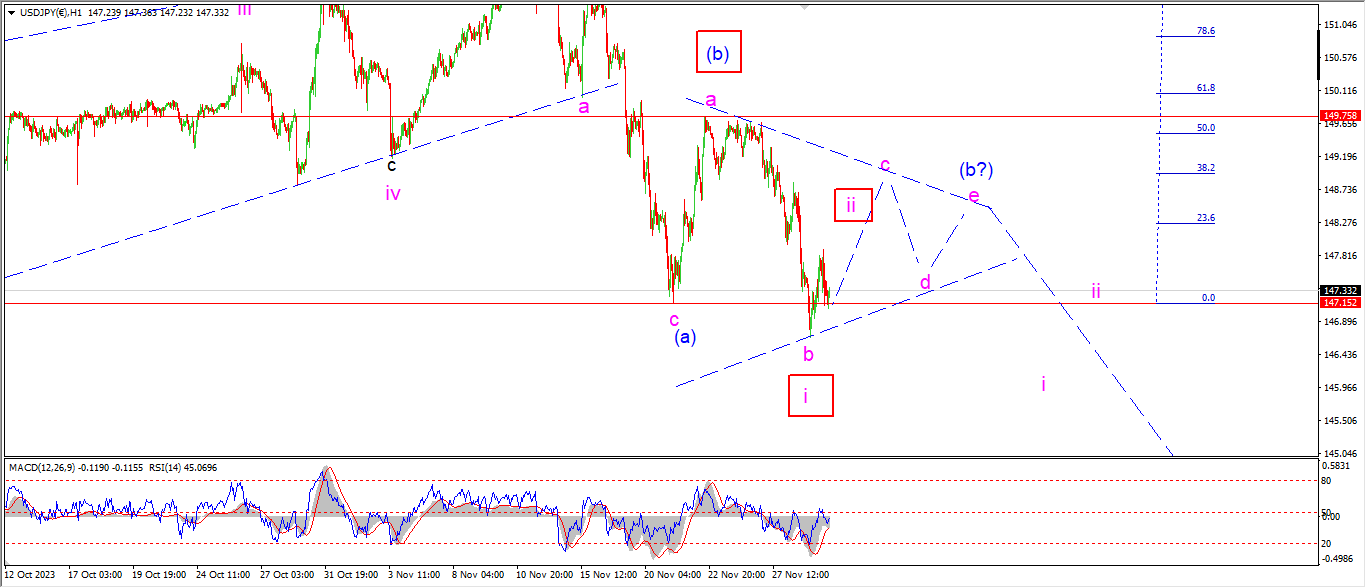
USDJPY 1hr.
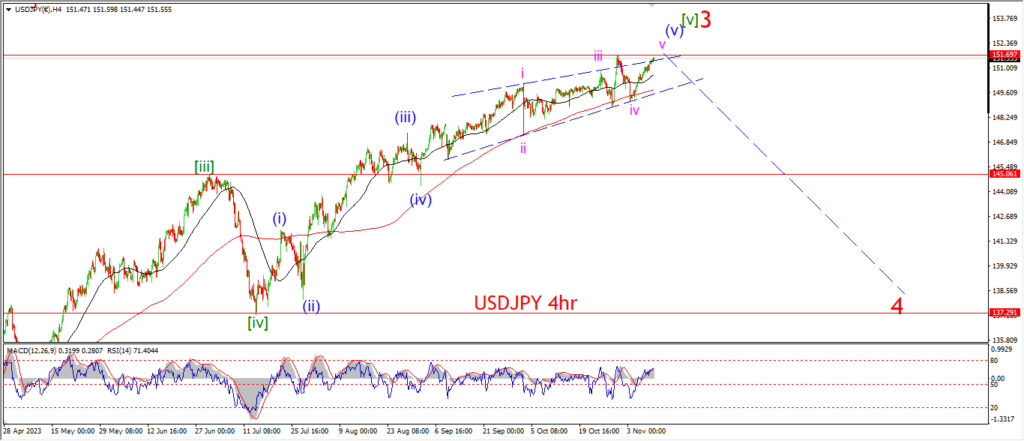
USDJPY 4hr.
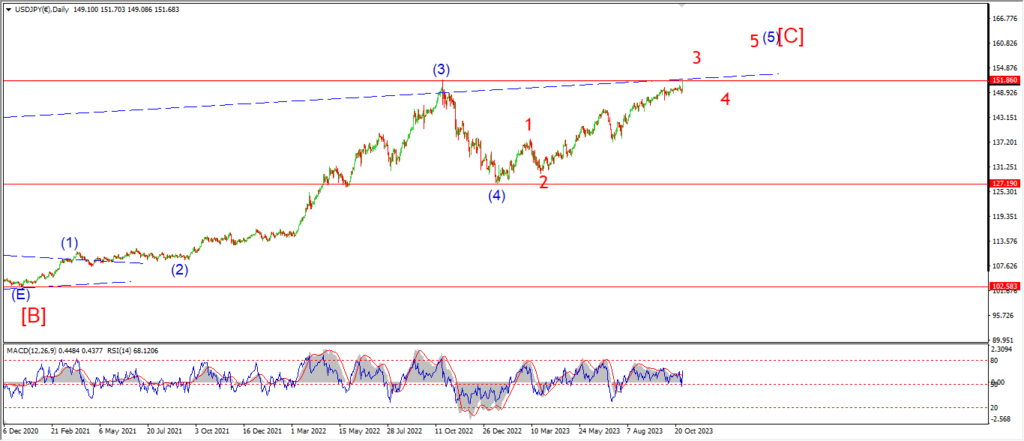
USDJPY daily.
USDJPY did break to a new low today and that does give a small hint at that alternate wave (b) count again.
If the alternate count is correct,
then we have a ‘i’ ‘ii’ scenario playing out here.
and wave ‘ii’ should trace out three waves up a shown.
The price has rebounded off the lows today and that leaves the door open to the main triangle count for wave (b) also.
so I have not changed the main count because of that.
Wave ‘c’ of (b) should track higher in three waves also.
And we shuold see a top in the area of 149.00 to complete.
Tomorrow;
Watch for the price to continue higher in a three wave pattern in both scenarios.
the main count calls this rally wave ‘c’ of (b) with a top in the area of 149.00 again.
DOW JONES.
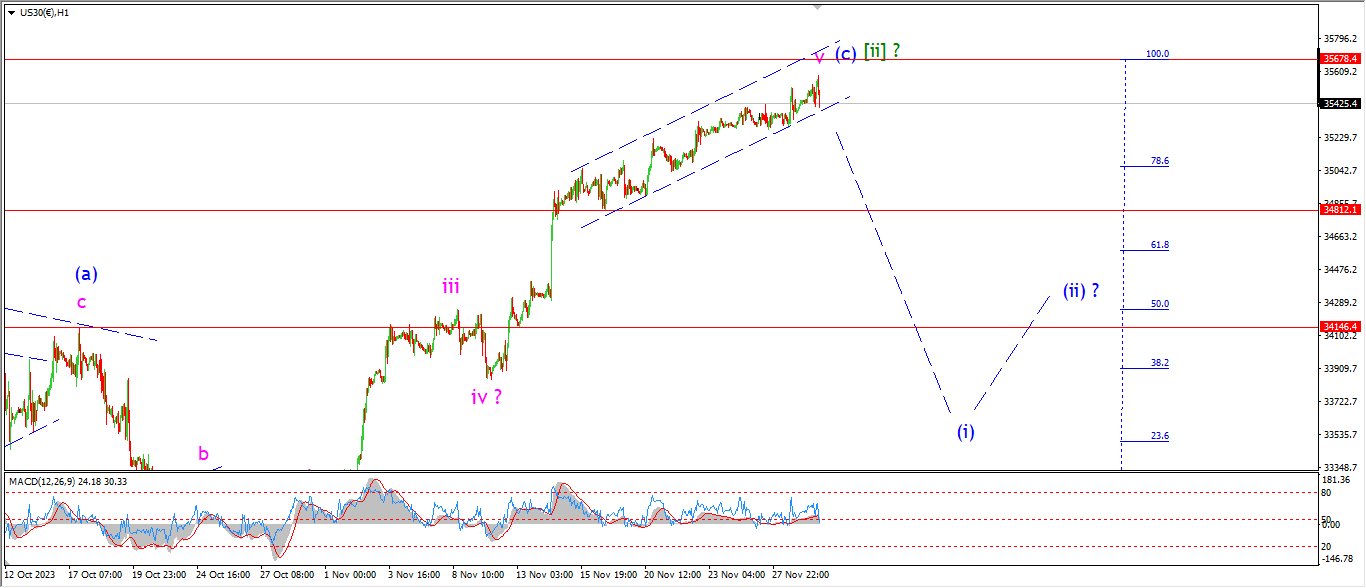
DOW 1hr.
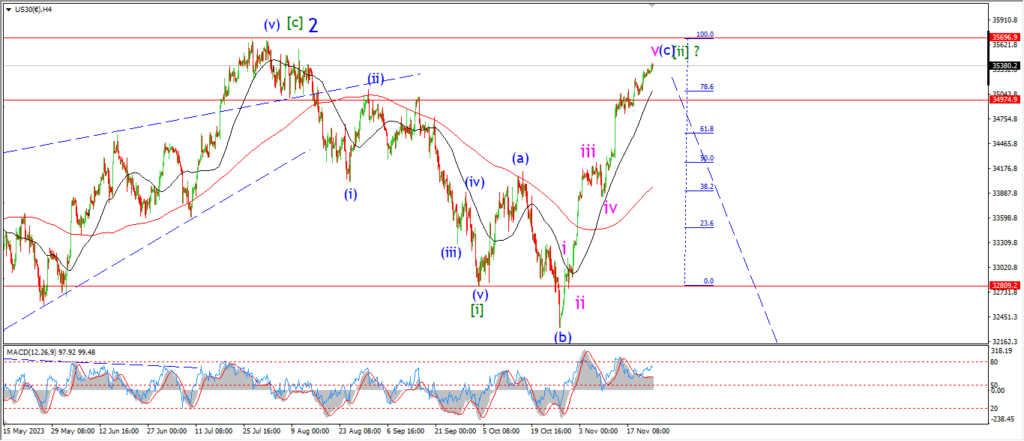
DOW 4hr

DOW daily.
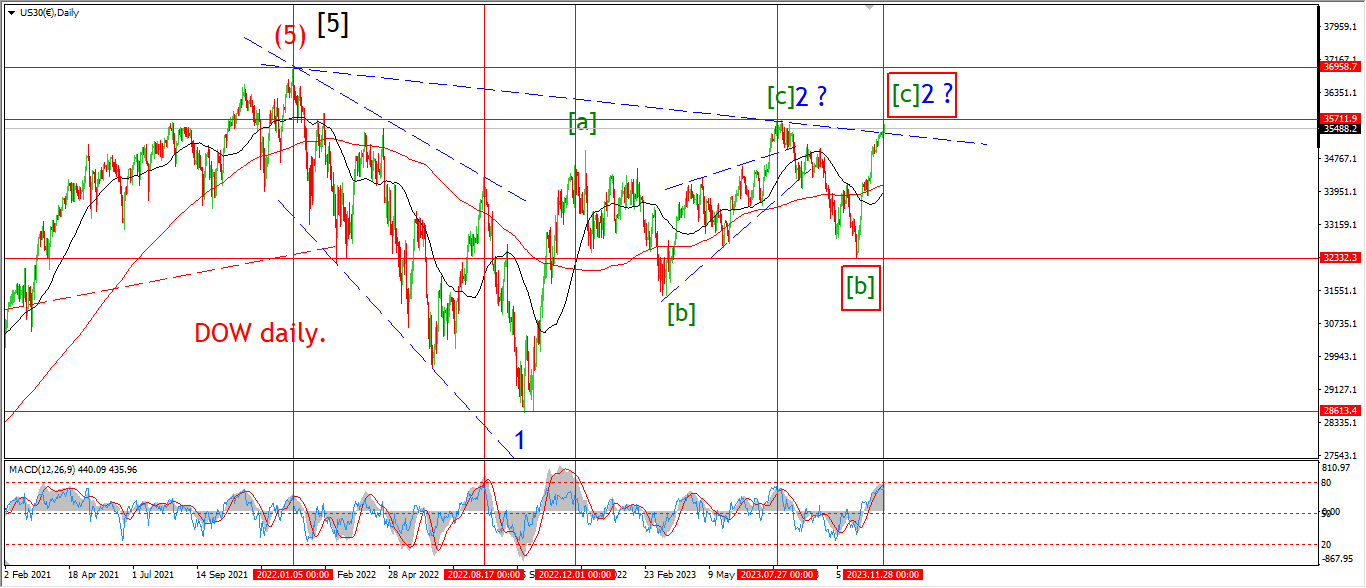 Take a look at the daily chart tonight.
I want to zoom out a lot to see where we stand.
You can see that the market has raced back up to a double lower high,
essentially equal to the previous wave ‘2’ high from mid Summer.
I want to point out the previous times we have been here over the last 2 years.
start with the all time high which happened against a declining momentum bias
and that lead to a 22% decline over the following months.
Now take a look at the relief rallies along the way.
The first was August 22 – a 500 point rally that gave up after maxing out on Momentum at a lower highland then completely gave up the gains.
Next December 22 – a 6000 point rally that maxed out on momentum at a lower high and gave back 50% of its rally.
The next was July 23 – a 4000 point rally that maxed out momentum at a lower high and gave up 80% of that rally.
And now a second major lower high below the all time high which is maxing out on momentum as I write.
The market is at the very point it should give up if we go by the previous model.
The question is not if,
but when.
Tomorrow;
I have shown an alternate count for wave [c] of ‘2’ just in case this market does manage to break to a new lower high.
I don’t have to convince you of what the outcome should be here.
Only this time I think we go all the way into that long awaited wave ‘3’ decline.
GOLD

GOLD 1hr.
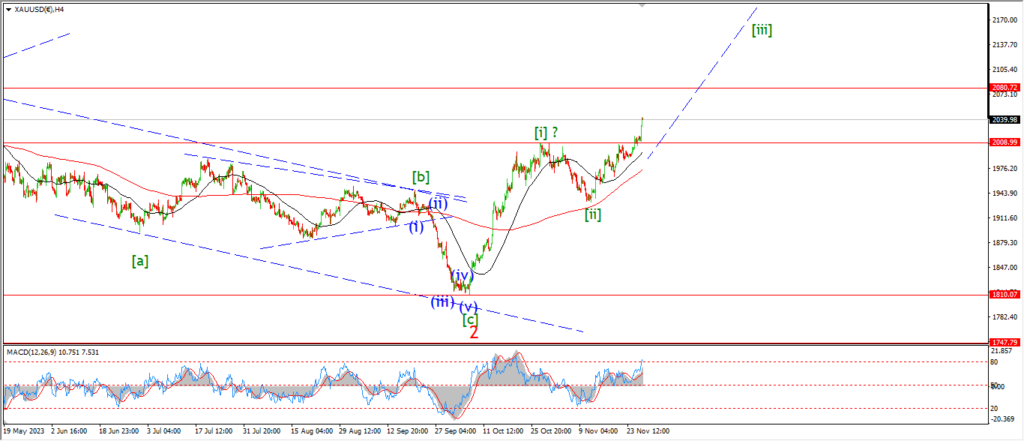
GOLD 4hr.
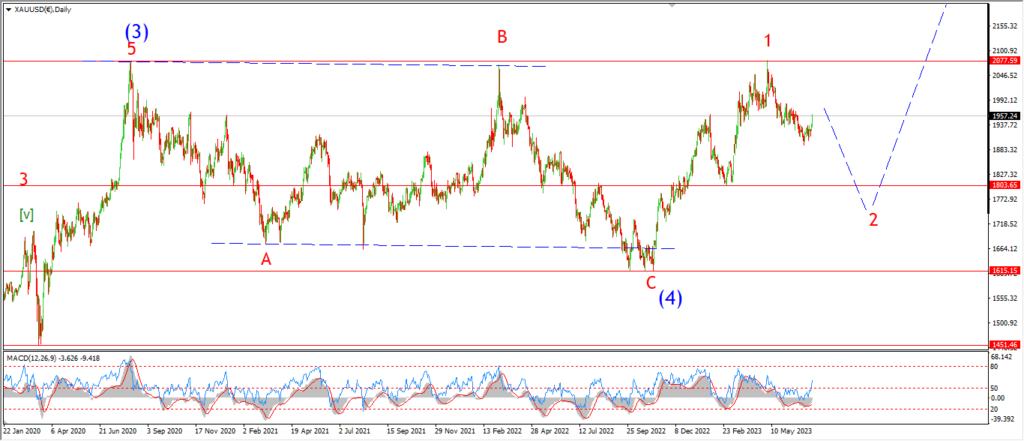
GOLD daily.
Gold has corrected off the top of wave ‘iii’ of (iii) today and it looks like we are going to trace out three waves down into wave ‘iv’ pink now.
I am marking the wave ‘i’ of (iii) high at 2007 as the initial support for this pattern.
If the price holds above that level as this small correction plays out in wave ‘iv’,
then the bullish count is safe for now.
I would still keep an eye on that wave (i) high at 1993 just in case.
Tomorrow;
Watch for wave ‘iv’ of (iii) to complete a corrective pattern above 2007.
CRUDE OIL.
CRUDE OIL 1hr.
CRUDE OIL 4hr.
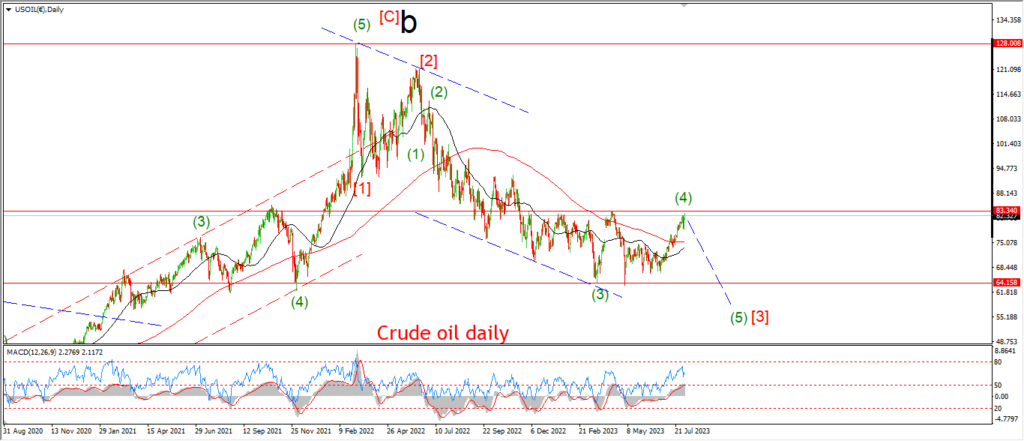
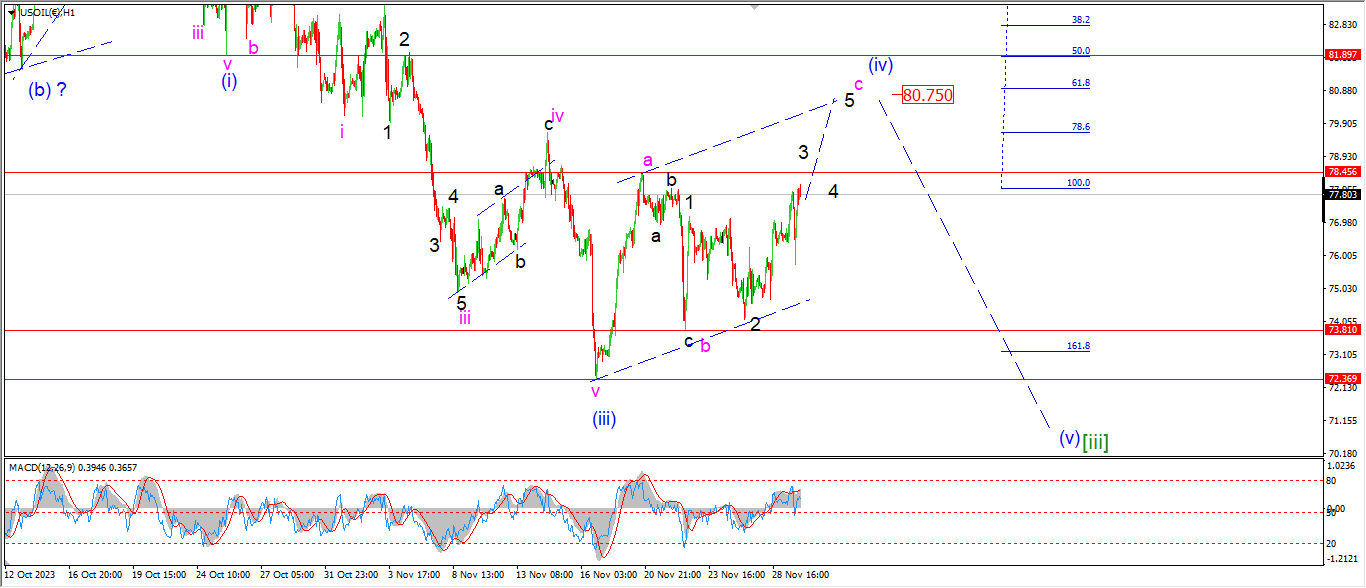
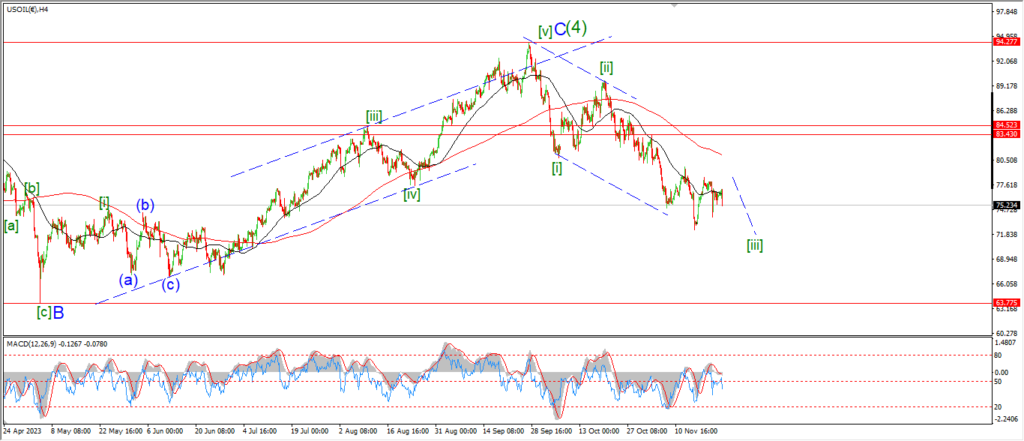
CRUDE OIL daily.
Its been a pretty choppy day today with very little in the way of net progress into that wave ‘3’ of ‘c’ rally.
The price continues to hold below the wave ‘a’ high at 78.45 this evening,
and given the whipsaw action today it is getting harder to stay with this wave (iv) pattern.
It may be the case that wave (iv) is tracing out a triangle pattern here,
and that would explain the overall choppy nature of the action.
but that will be revealed in the next few sessions if that is true.
tomorrow;
Watch for wave ‘c’ of (iv) to continue higher to break 78.45 at a minimum.
The upper target for this rally lies at 80.75.
S&P 500.
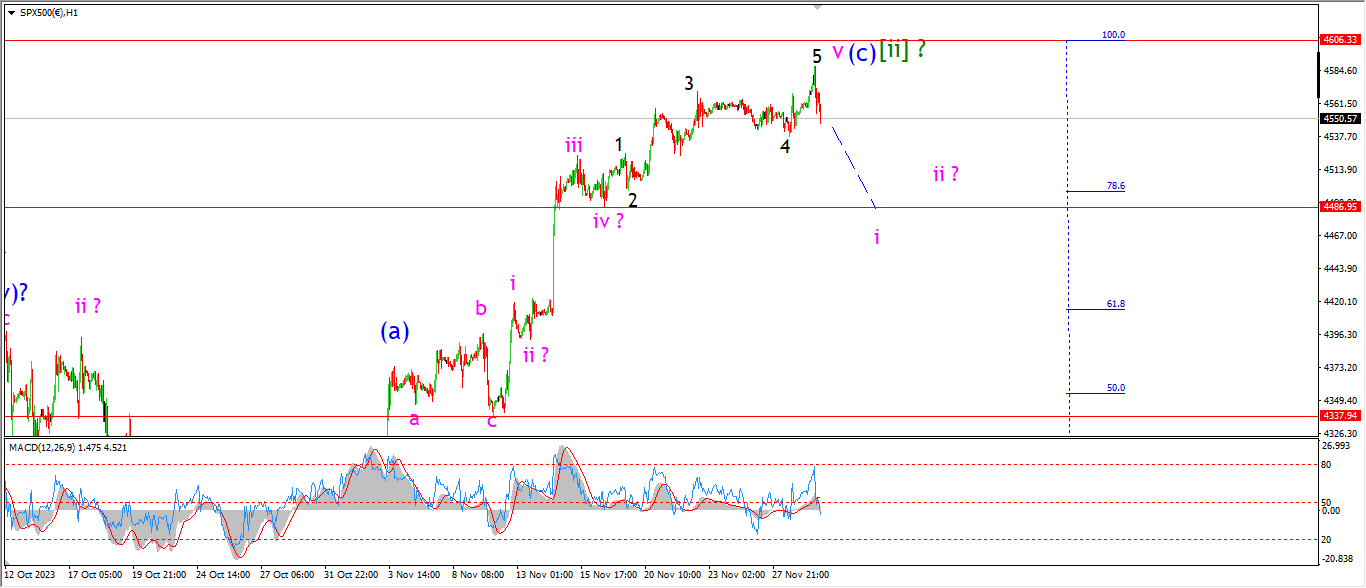
S&P 500 1hr
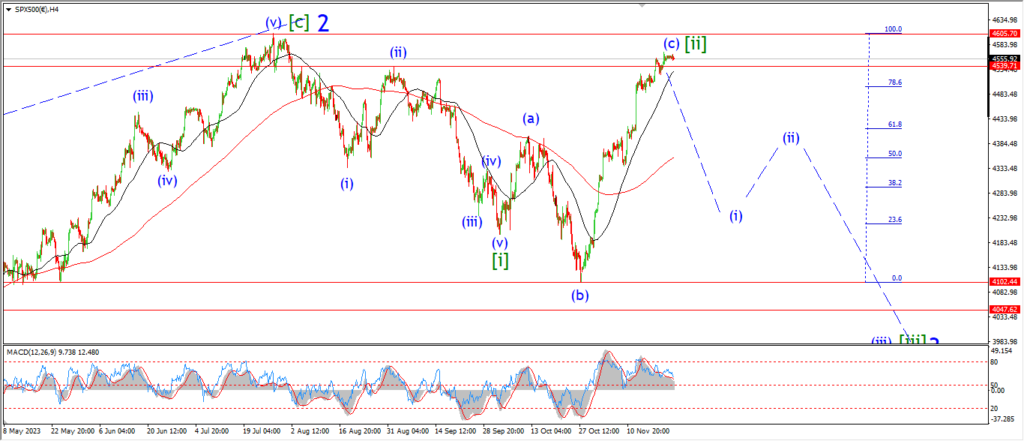
S&P 500 4hr
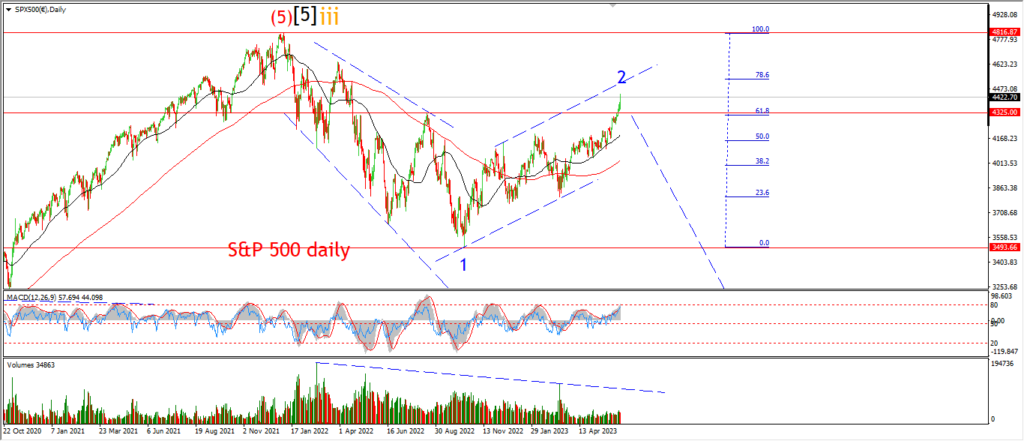
S&P 500 daily.
It is a little early to say but,
I am wondering if the action today can be called a ‘rejection’ below the resistance.
The price is falling into the close this evening and we are back to flat for this weeks trade now.
The important level to watch here is the previous wave ‘iv’ low at 4486.
And a break of that level along with an impulsive decline is a solid move back towards the bearish interpretation here.
We will see tomorrow if this decline can gain some momentum in the short term at least.
The market simply must start taking out supports here to turn back and favor the bearish outlook.
Tomorrow;
Watch for the highs to hold below the invalidation level at 4606.
WAve ‘i’ must turn lower again and break initial support at wave ‘iv’.
SILVER.
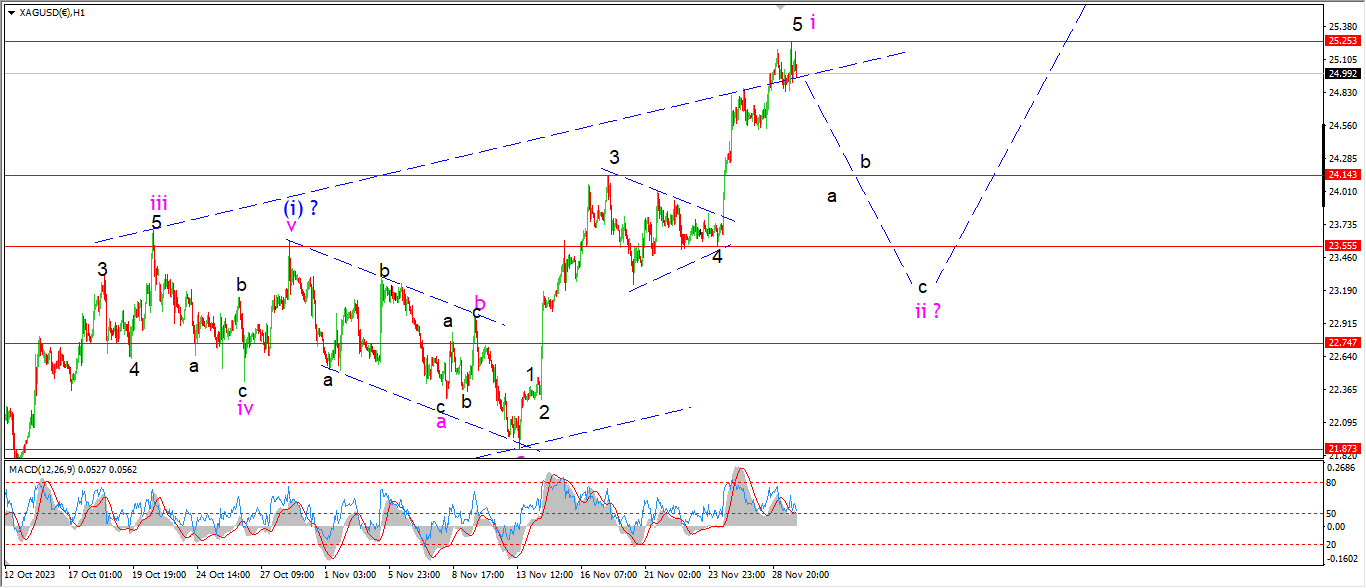
SILVER 1hr
SILVER 4hr.
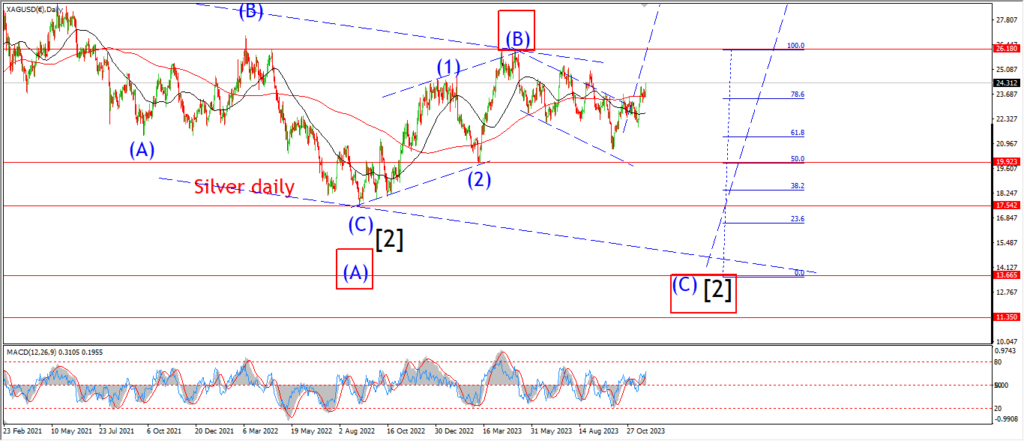
SILVER daily.
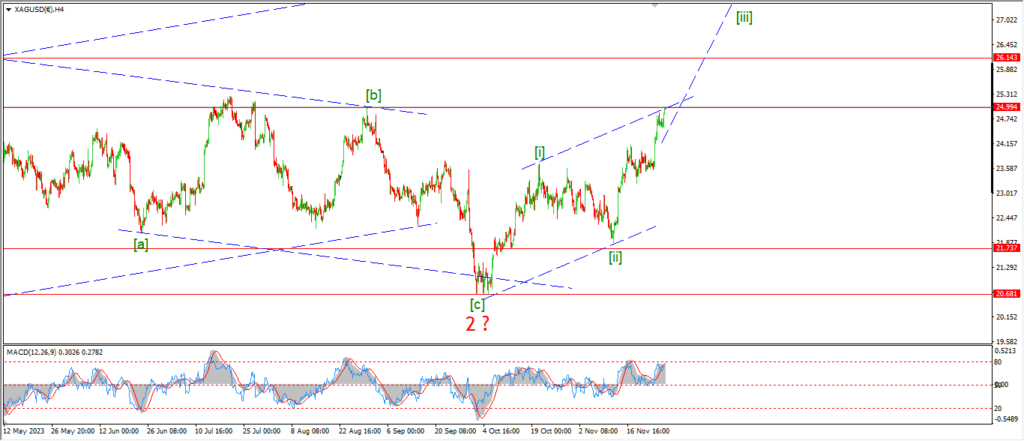
Silver is holding near the highs today and I still think wave ‘ii’ is coming our way now.
The sharp rally into wave ‘5’ of ‘i’ has lost steam now,
andI suspect we will lose most of the recent rally again as wave ‘ii’ plays out in the next week.
I have marked the wave ‘3’ high at 24.14 as the signal level to begin wave ‘ii’.
A break of that level will suggest wave ‘a’ of ‘ii’ is underway.
Tomorrow;
WAtch for the price to fall back below the upper trend channel line again to signal wave ‘a’ of ‘ii’ has begun.
BITCOIN
BITCOIN 1hr.
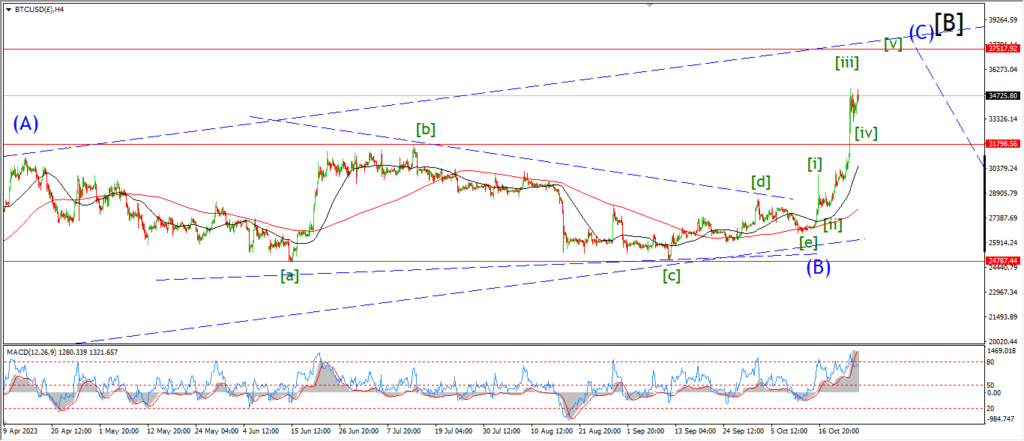
BITCOIN 4hr.
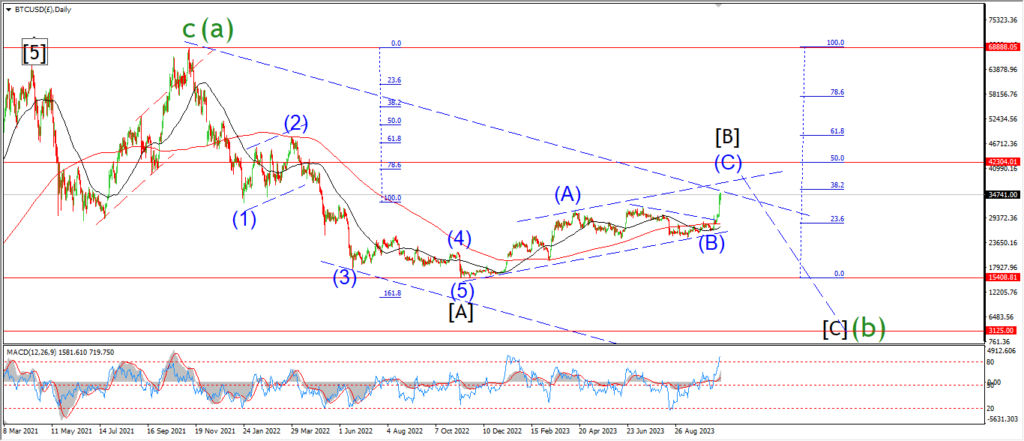
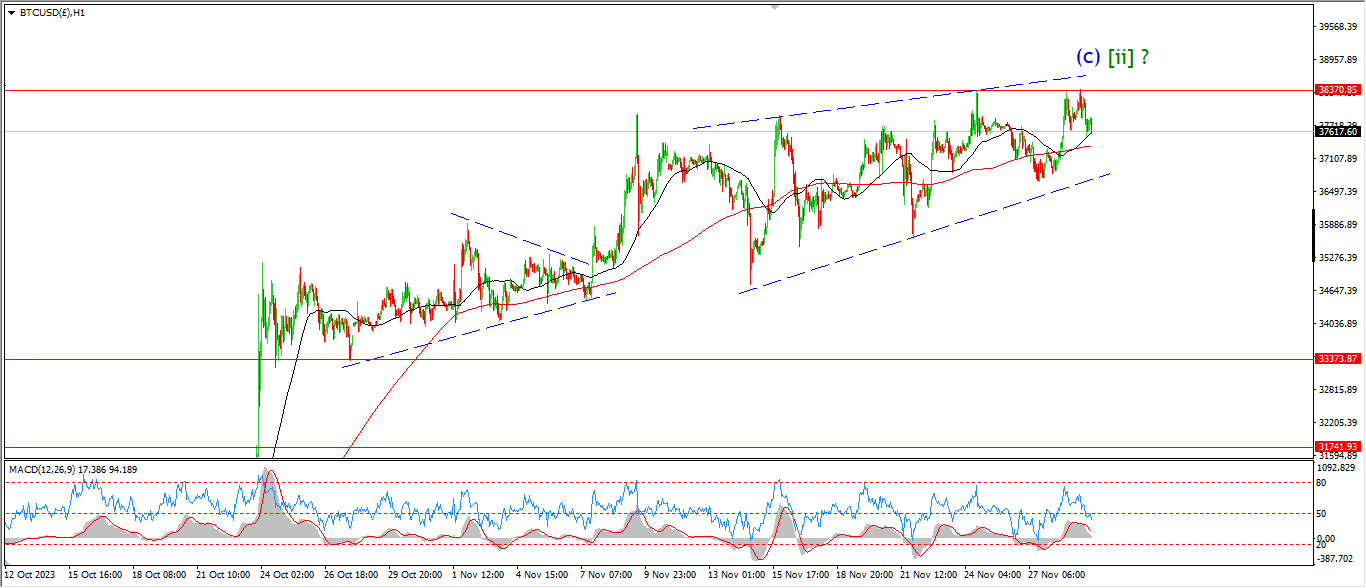
BITCOIN daily.
….
FTSE 100.
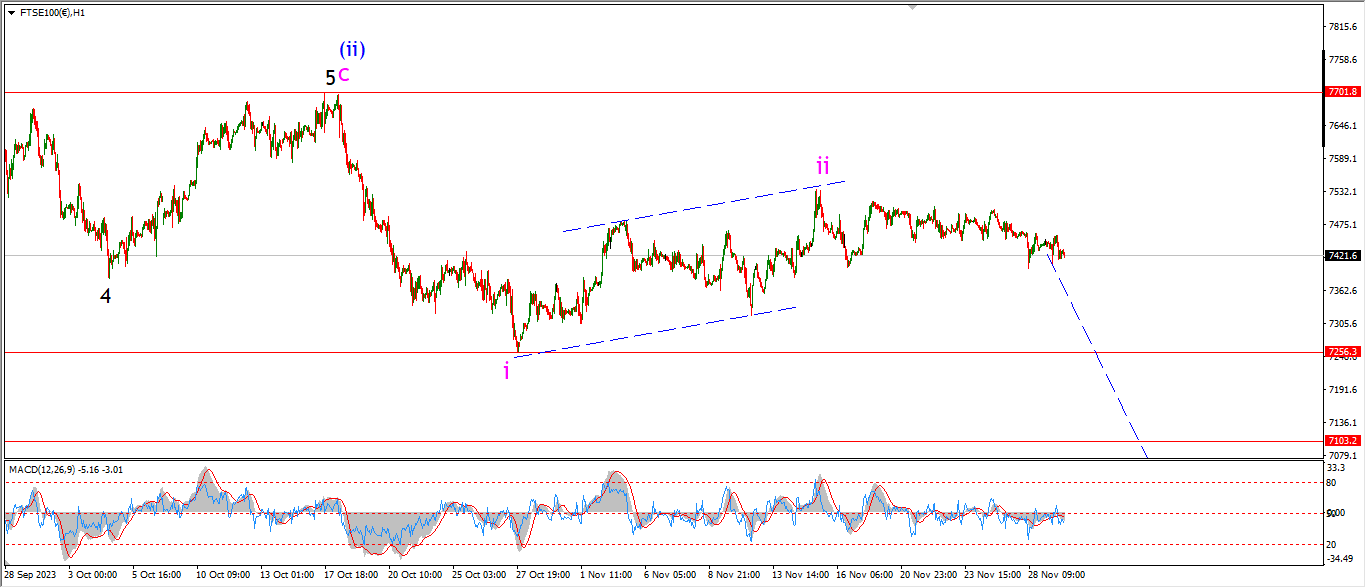
FTSE 100 1hr.
FTSE 100 4hr.

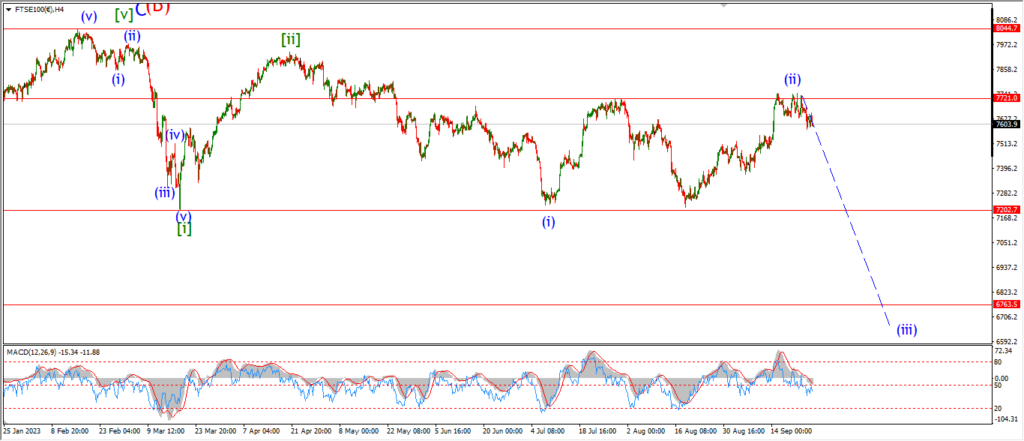
FTSE 100 daily.
….
DAX.
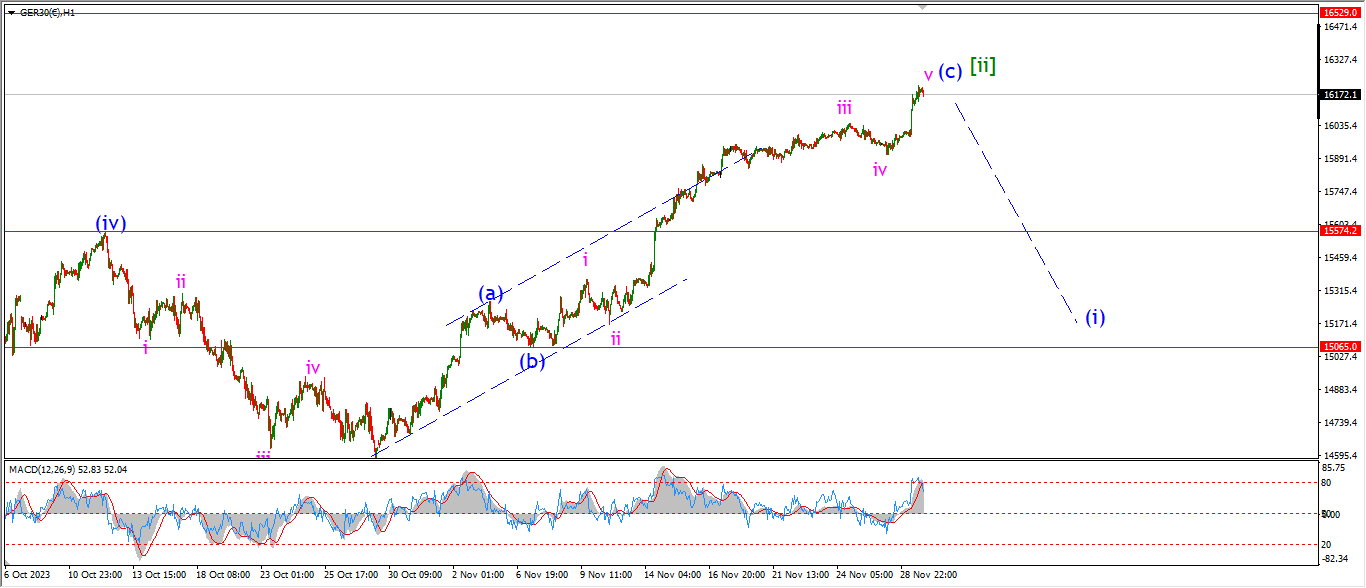
DAX 1hr
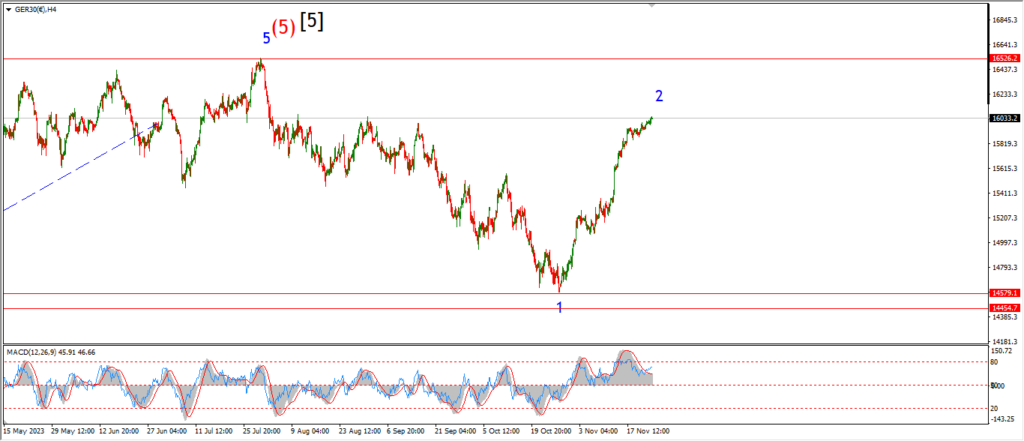
DAX 4hr

DAX daily.
….
NASDAQ 100.
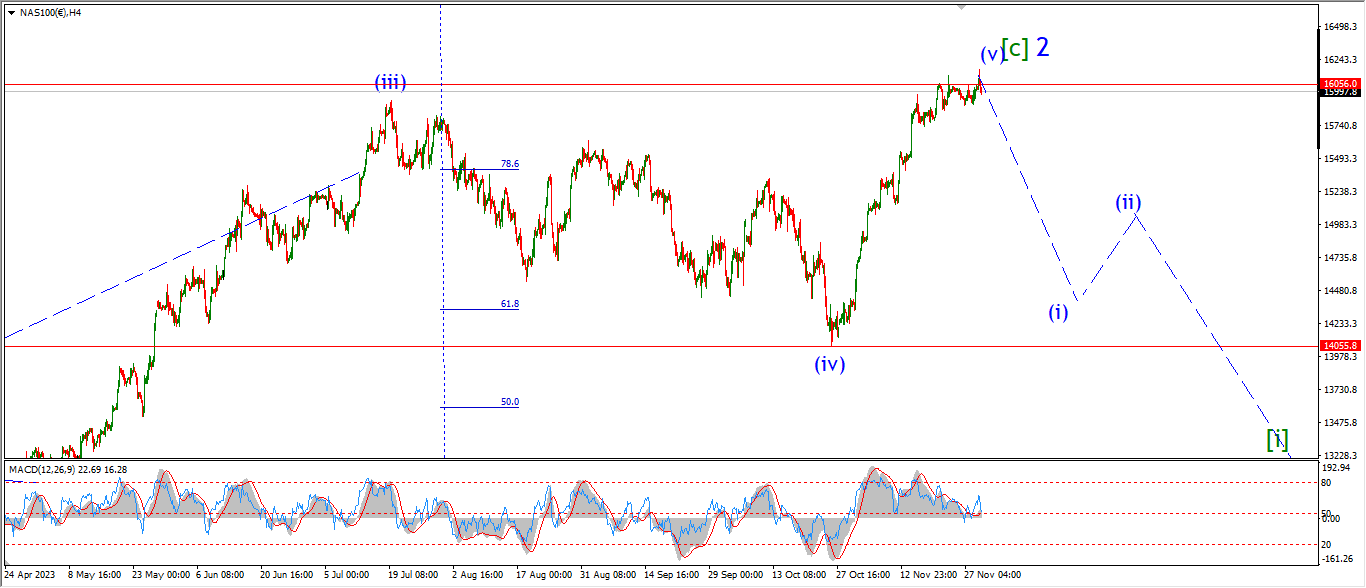
NASDAQ 1hr
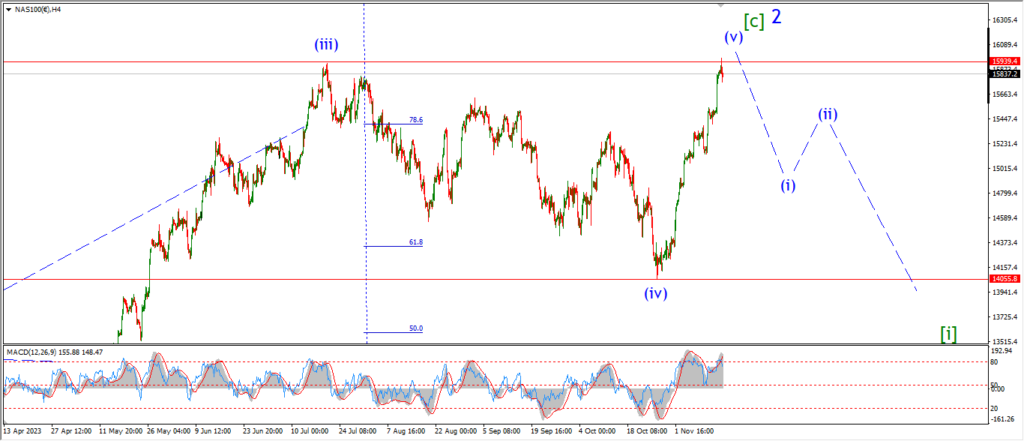
NASDAQ 4hr.
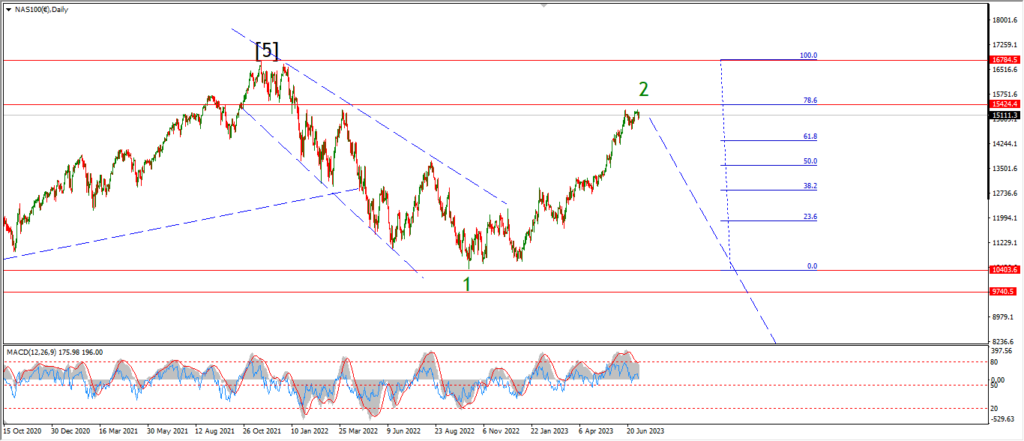
NASDAQ daily.
….