
Good evening to you.
I have frustrated the hell out of you fine folks this weekend, that much I know for sure!
I can only ask for your forgiveness for the failure of the website again,
and push on with the show.
The problem got fixed today thanks GOD!
So I do hope that we have seen the last of crashing websites for a very long time to come.
Ok, here we go.
EURUSD.
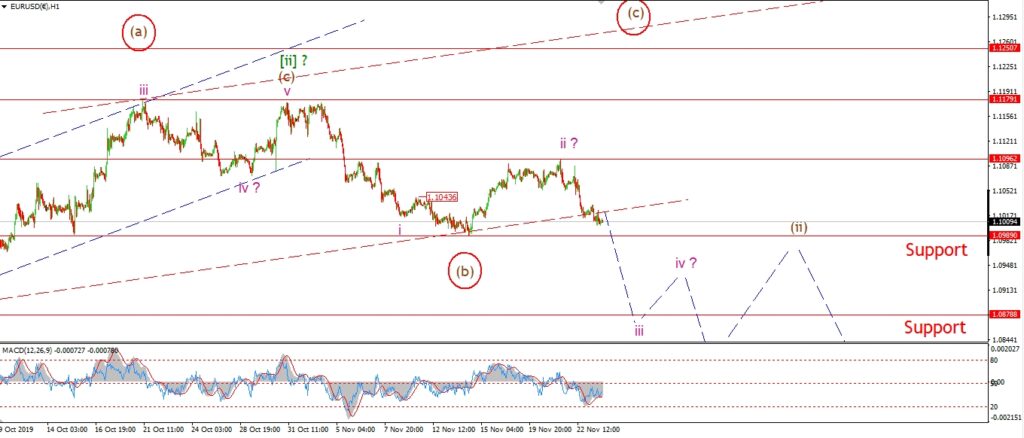
EURUSD 1hr.
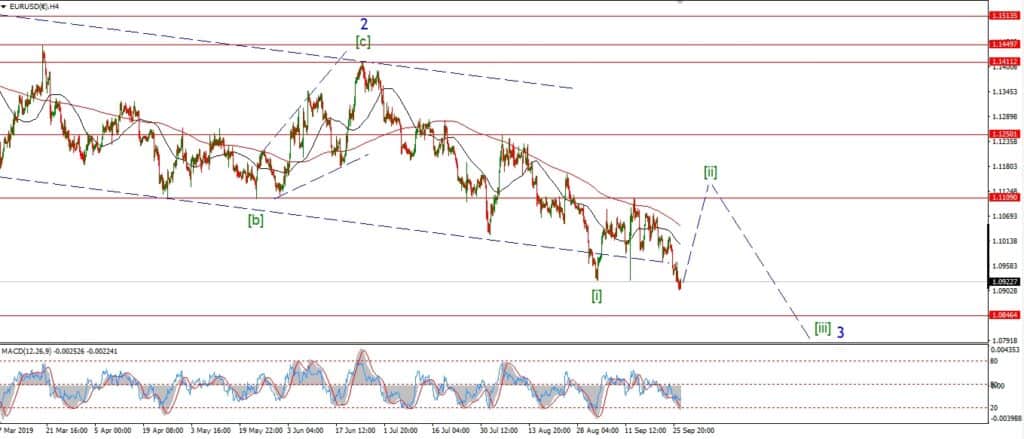
EURUSD 4hr.
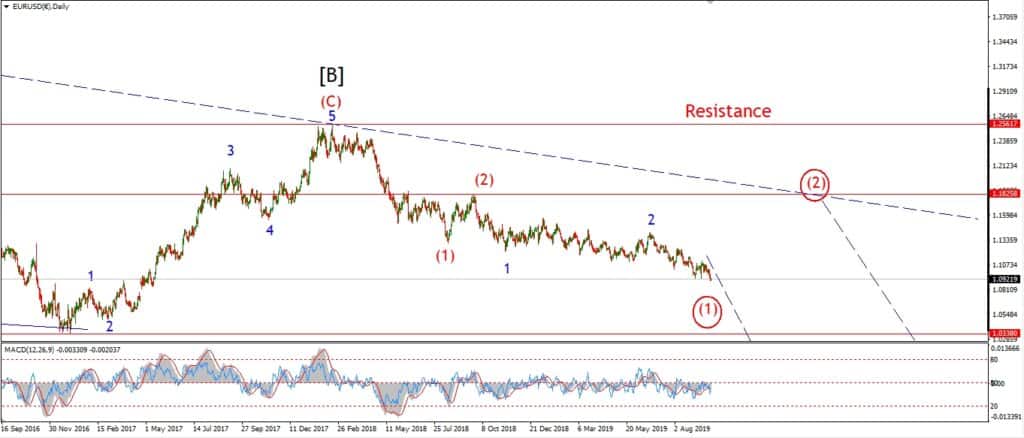
EURUSD daily.
EURUSD is very close to ruling out that bullish alternate count this evening.
The price is hanging just above the support of the previous wave ‘b’ at 1.0989.
If we break below that level,
it should signal that the market has finally turned lower into wave [iii] green
after a long corrective phase in wave [ii] green.
Wave ‘iii’ down is the wave I am concentrating on now to to that work.
And if wave ‘iii’ is underway now,
it should push towards that lower support at 1.0878 with ease this week.
Tomorrow;
Watch for wave price to hold below 1.1096
and continue lower over the coming few sessions in wave ‘iii’ of (i) of [iii].
GBPUSD
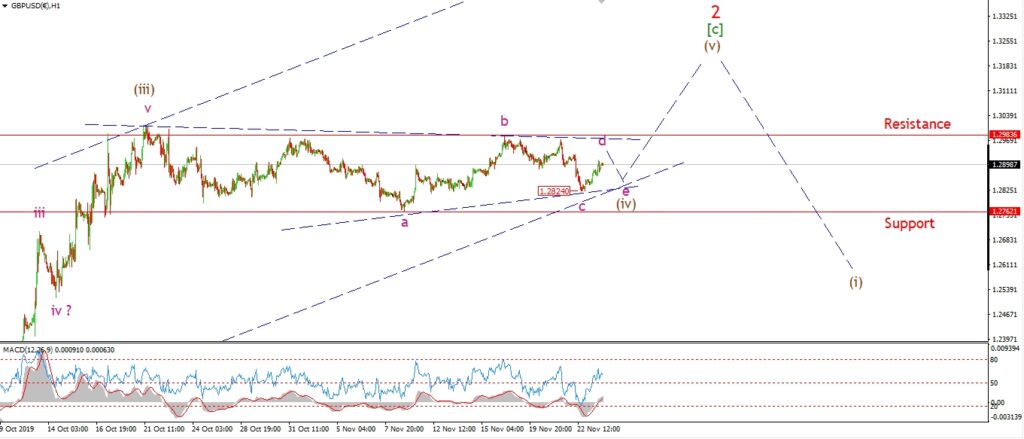
GBPUSD 1hr.
GBPUSD 4hr.
GBPUSD daily.
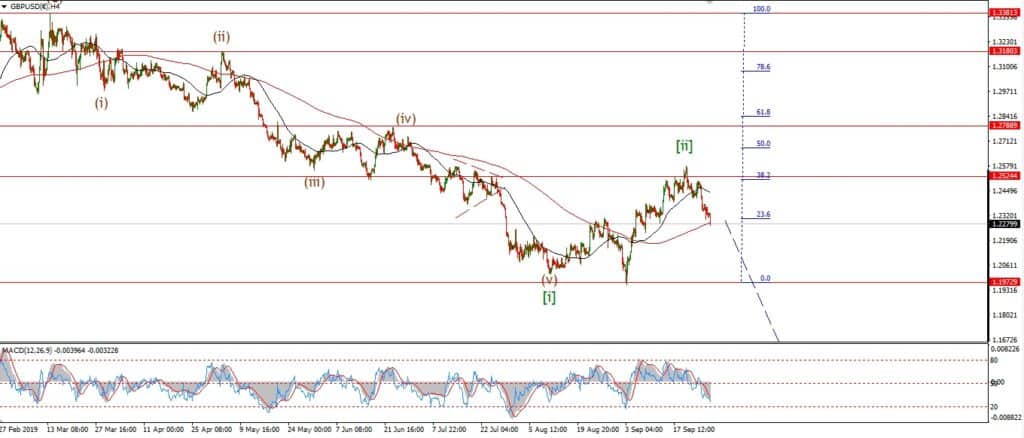
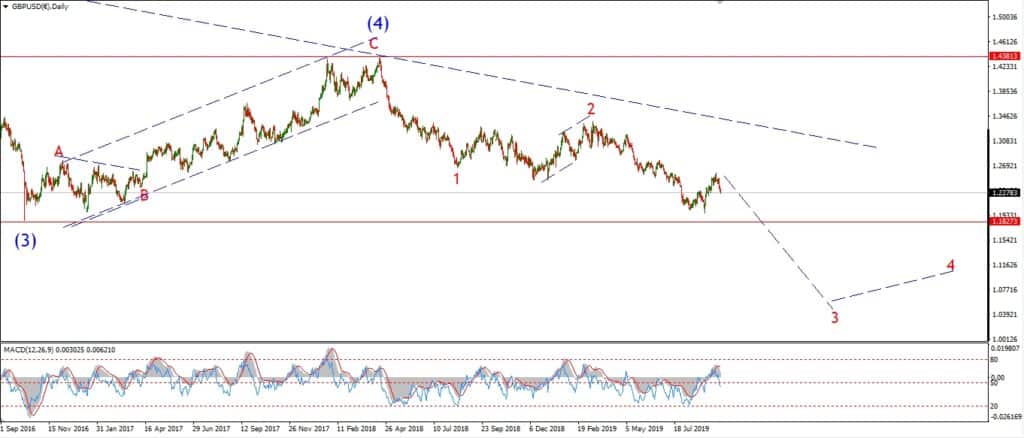
Cable is holding steady in that triangle pattern today for wave (i).
The price rose today to begin a possible wave ‘d’ of (iv),
and so far the price has remained below 1.2983 at the wave ‘b’ high.
That level should continue to hold tomorrow as wave ‘d’ completes.
And wave ‘e’ should then drop back again.
As this triangle moves forwards the margin for error tightens,
Wave ‘e’ must hold above 1.2824 at the wave ‘c’ low.
If that level breaks,
then the triangle is ruled out.
and wave (iv) will fall back into 1.2762 at a minimum.
Tomorrow;
Watch for wave ‘e’ to fall back into the rising trend line at complete above 1.2824.
USDJPY.
USDJPY 1hr.
USDJPY 1hr.
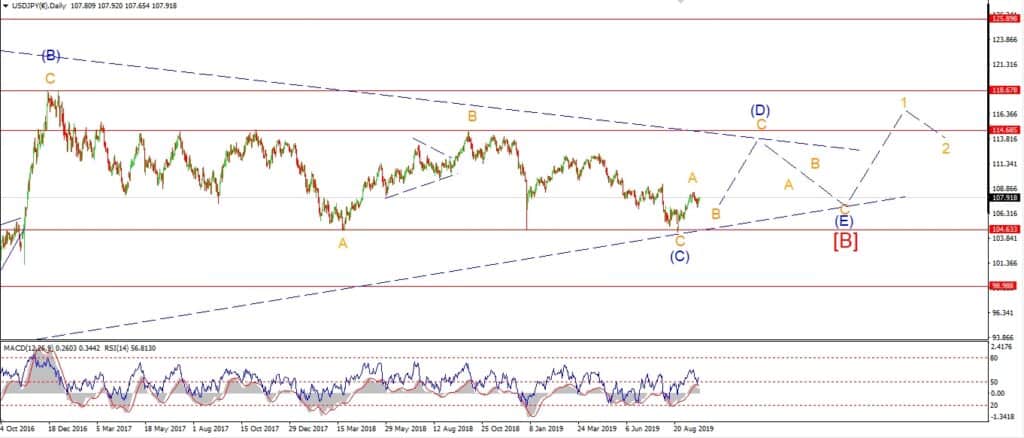
USDJPY daily.
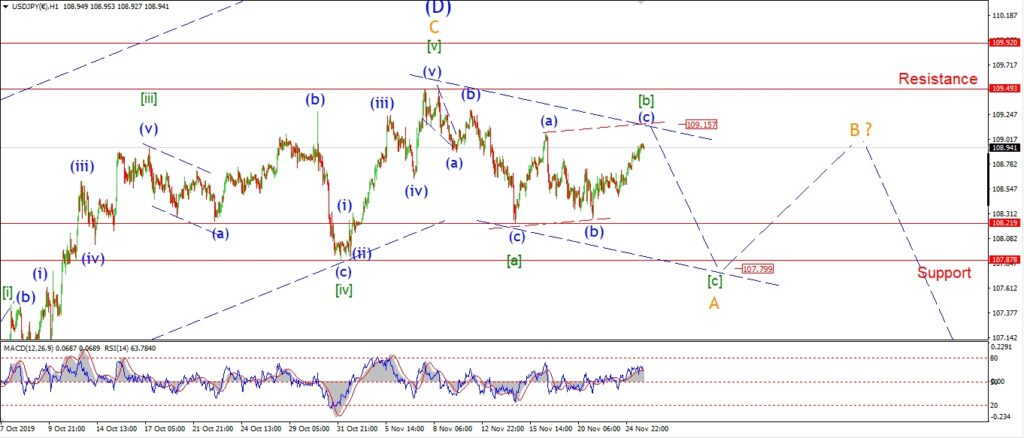
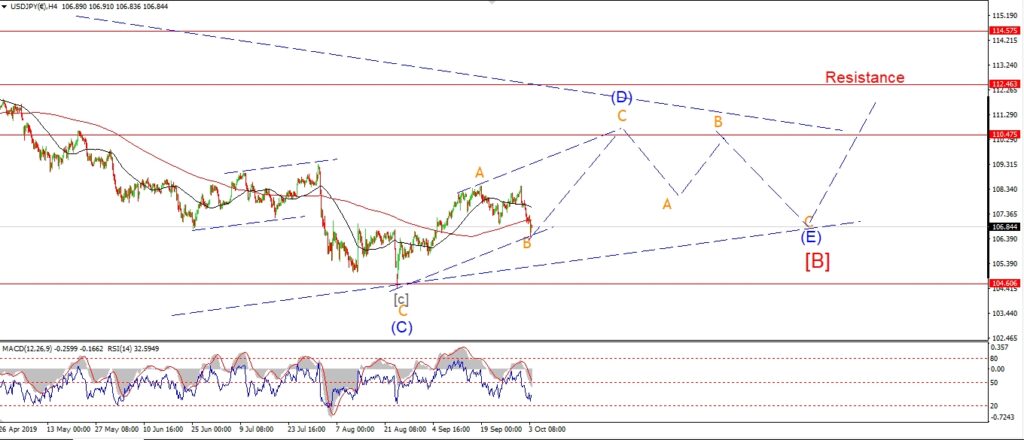
USDJPY rose out of that previous triangle pattern for wave [b] today.
It is likely that wave (c) will now create a regular three wave flat correction
and complete at about 109.15 before turning lower into wave [c] of ‘A’.
It is still possible that a larger triangle will trace out this week,
but the flat correction is very close to target now,
so I will work with that for the moment.
DOW JONES.
DOW 1hr.
DOW 4hr
DOW daily.
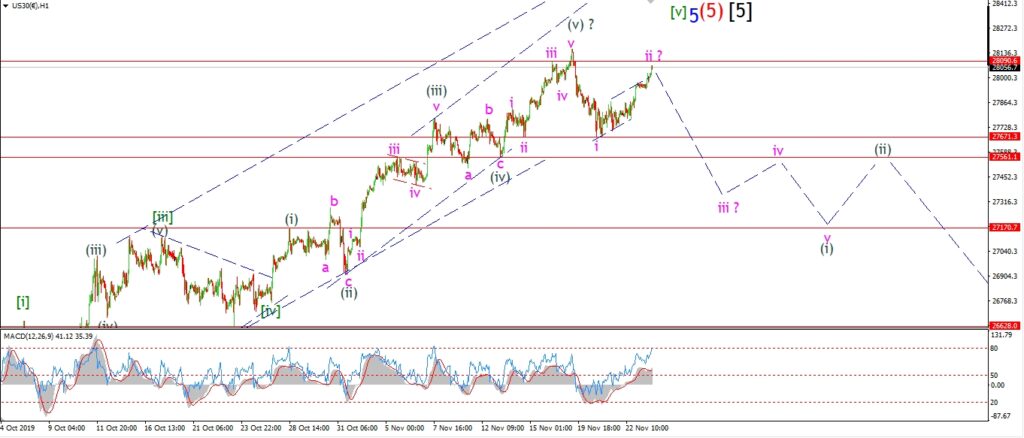
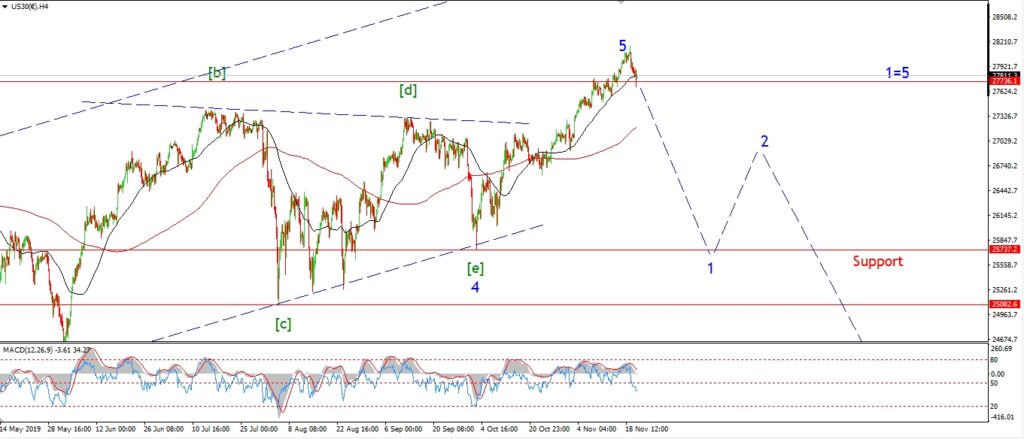
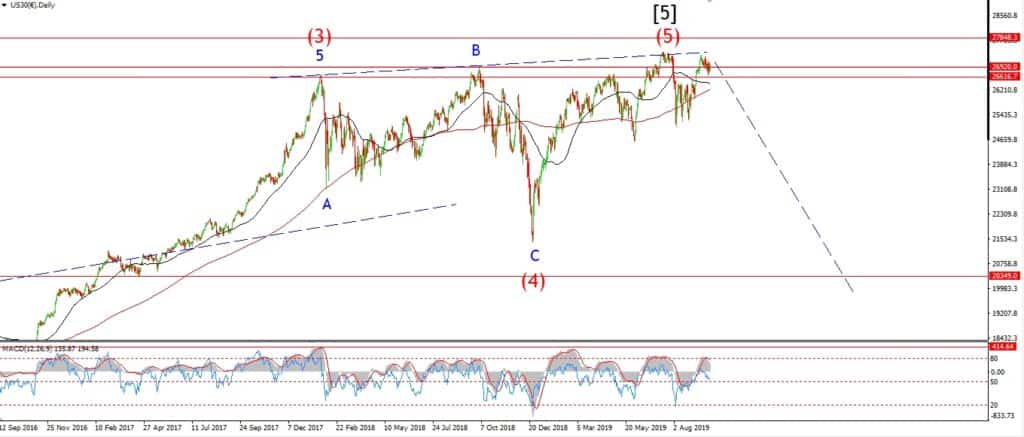
The DOW continued the rally today and is close to creating a new all time high this evening.
The action is so tenuous right now,
that this market could drop like a stone any minute.
If you look at the volume stats alone you will see an extremely complacent market.
Over the last 4 months volume has dropped to about 20% of where we were,
which has created a huge divergence signal.
I have already mentioned the knife edge that momentum stands at now.
So even if we see a new high this week,
it will not be a blow off affair.
There is absolutely no strength in this action now,
so I will stick with the bearish outlook in general.
Wave (i) down is coming soon,
And it will bring with it a wicked selloff which should carry through well into the new year.
Tomorrow;
Lets see if the current high holds.
A drop back below 27671 again will confirm wave ‘iii’ down has begun.
GOLD
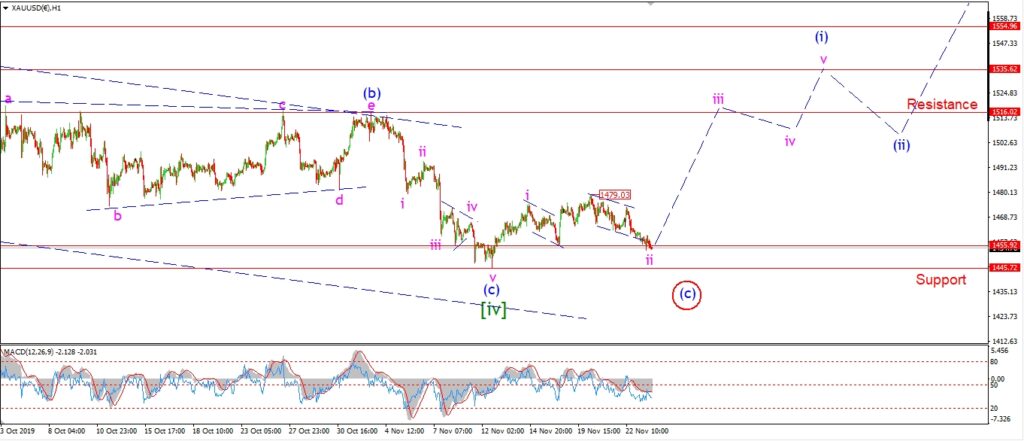
GOLD 1hr.
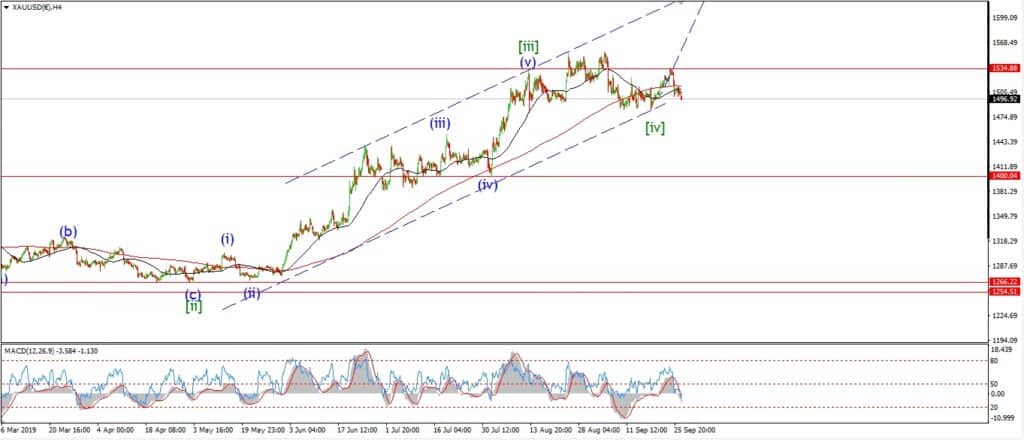
GOLD 4hr.
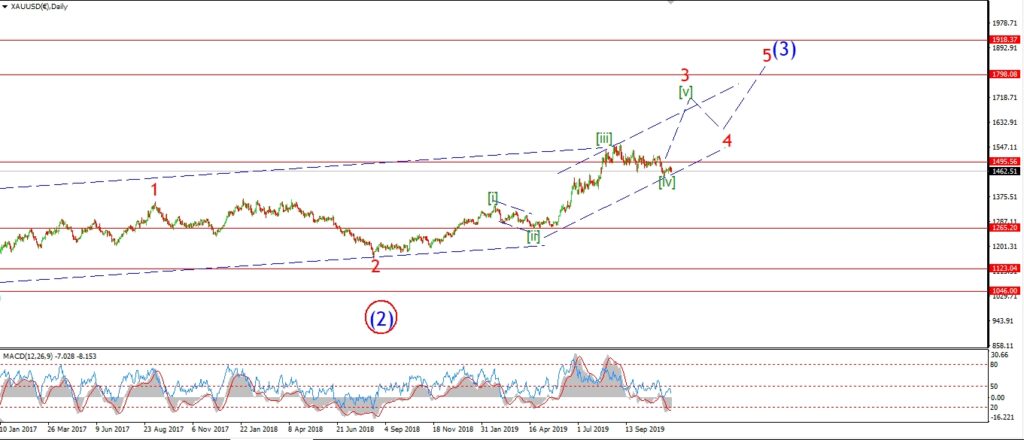
GOLD daily.
Wave ‘ii’ has created a double bottom at 1455 this evening.
The relentless optimism in the market is having its affect on gold for sure.
No-one can see a negative outcome for either stocks or bonds or the general economy,
so gold gets hung out to dry.
In the face of all that optimism and negativity towards the metals,
gold has still held up these last few months.
Long term momentum is signalling a turn higher is coming.
And when the stock market does roll over,
gold will get a major kick in the ass to begin wave [v] up!
In the short term,
it is still possible that wave ‘ii’ is creating a higher low at 1455 now.
If we see a break of 1479 this week,
that will signal wave ‘iii’ of (i) has begun.
Tomorrow;
Watch for 1445 to hold at wave [iv].
A break of that level will mean wave (c) is creating one more small low before heading higher into wave (i) again.
CRUDE OIL.
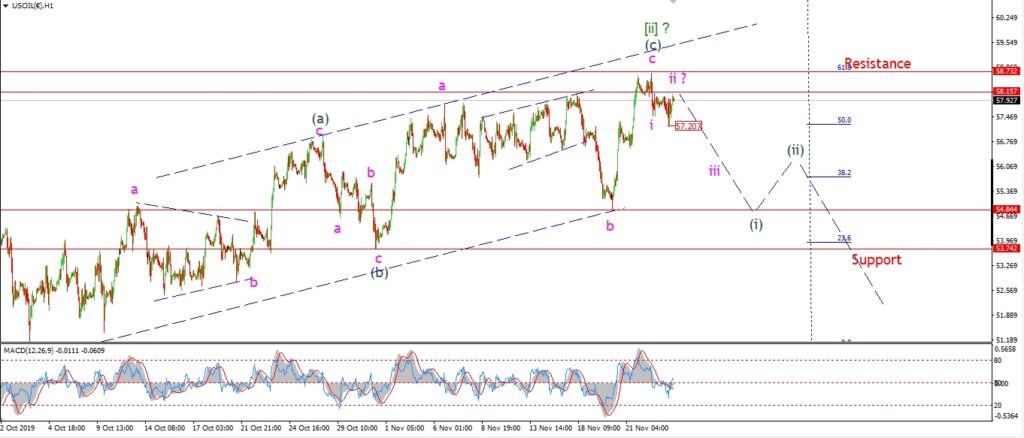
CRUDE OIL 1hr.
CRUDE OIL 4hr.
CRUDE OIL daily.
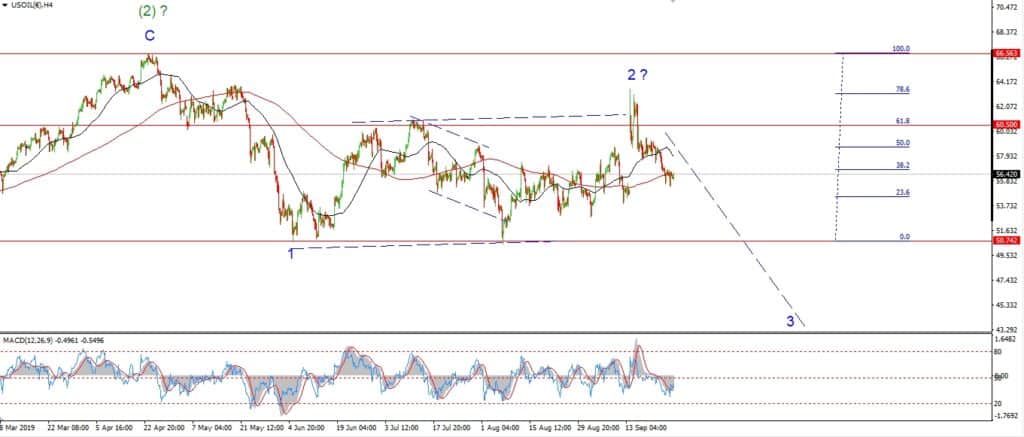
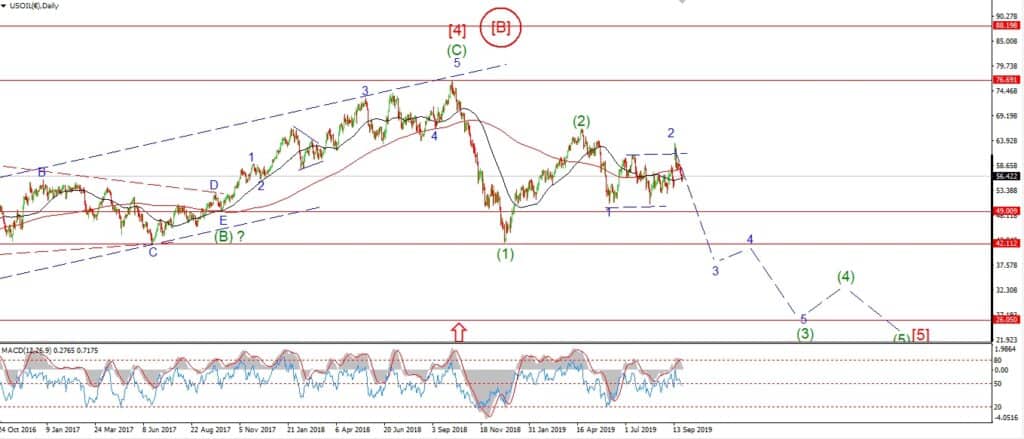
Crude is sitting at a small lower high today after completing a 61.8% retracement in wave [ii] green.
The market should turn lower along with the indexes as we begin wave [iii] down.
And wave [iii] has real potential to push back into the low $40 range before completing.
that is the long term view,
what about the short term pattern.
We need to see a five wave pattern develop to the downside off wave [ii] to begin the next leg.
I will be looking for that pattern to begin this week.
Tomorrow;
Watch for the high at 58.73 to hold.
A break of 57.20 again will signal wave ‘iii’ has begun.
Wave ‘iii’ of (i) should push back into the 55.00 area.
S&P 500.
S&P 500 1hr
S&P 500 4hr
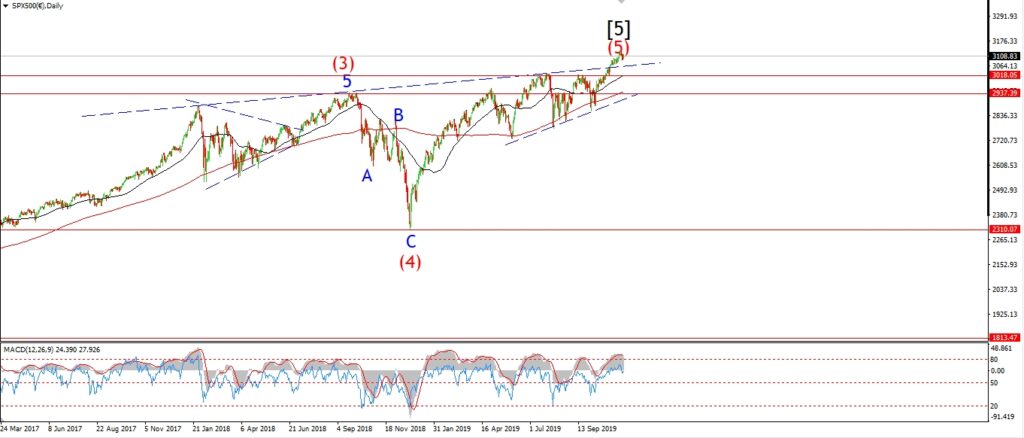
S&P 500 daily.
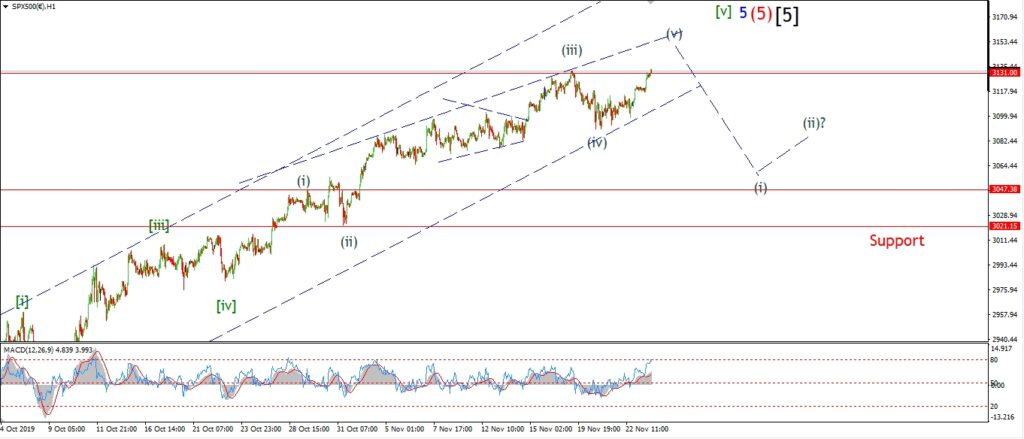
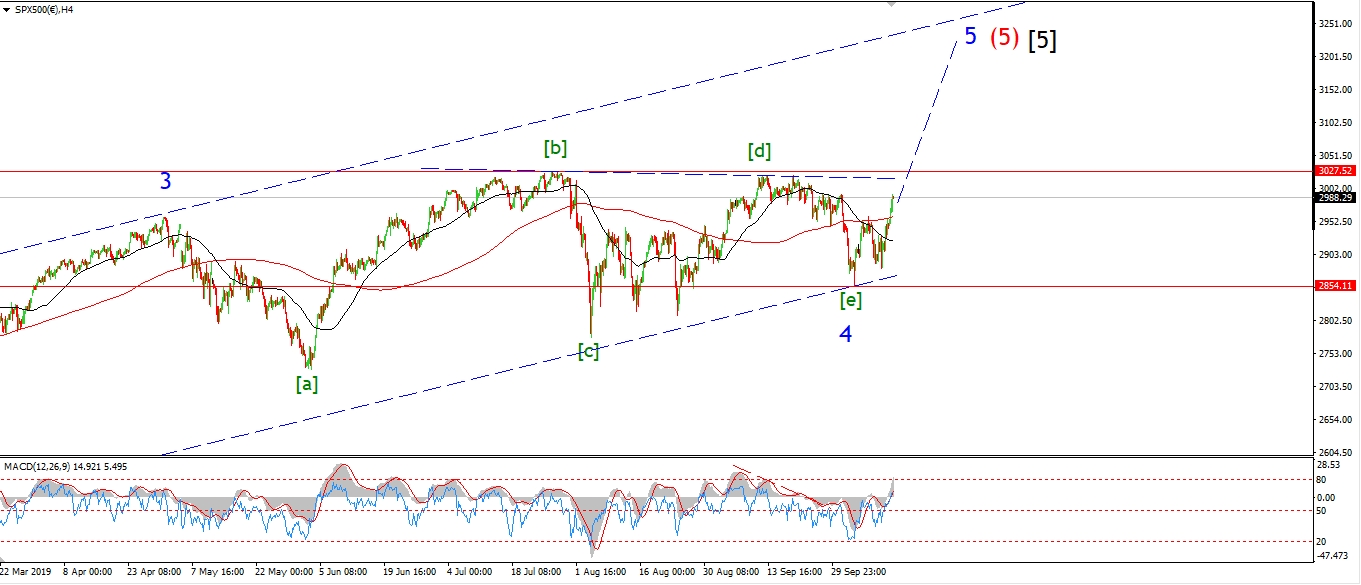
The S&P has dragged itself to a new high this evening.
Last weeks drop has been ruled out as an impulse wave down,
and becomes wave (iv) of [v] instead.
The internal pattern in wave [v] can be viewed a few different ways,
but the most likely count is shown on the short term chart.
Wave (v) might push up towards 3150 but that will be it I think.
The market is almost out of headroom no matter how I slice it now.
And along with the bearish volume and momentum divergence,
we have weak market internals with narrowing leadership in the advance,
less and less individual stocks are pushing the market higher.
Which also means that a larger percentage of the stocks are now falling and creating new lows.
This is the stuff of major trend reversals for sure.
Tomorrow;
this advance in wave (v) is likely to be short lived.
Wave (i) down should push back into the area of 3047 again at the previous wave (i).
I will be looking for the first moves lower this week.
SILVER.
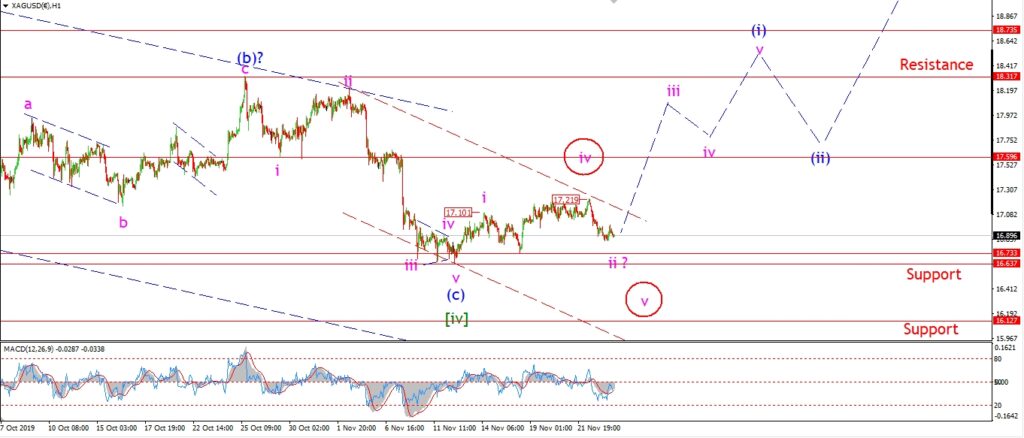
SILVER 1hr
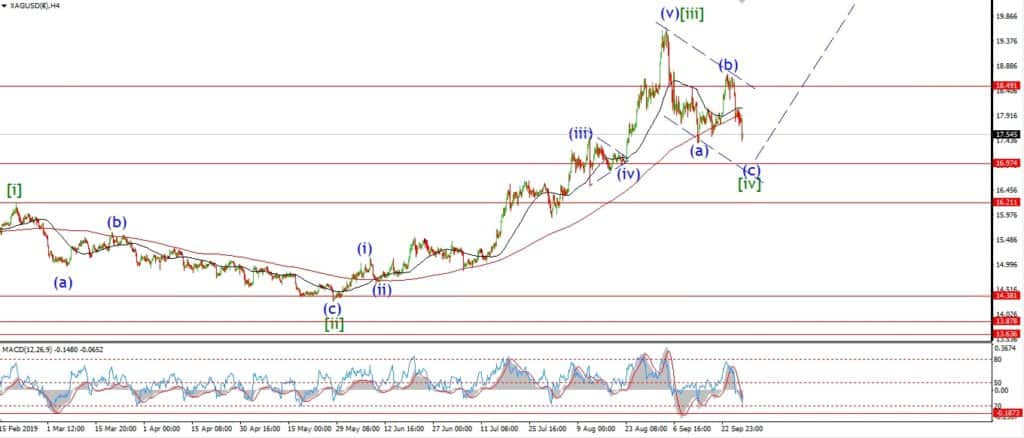
SILVER 4hr.
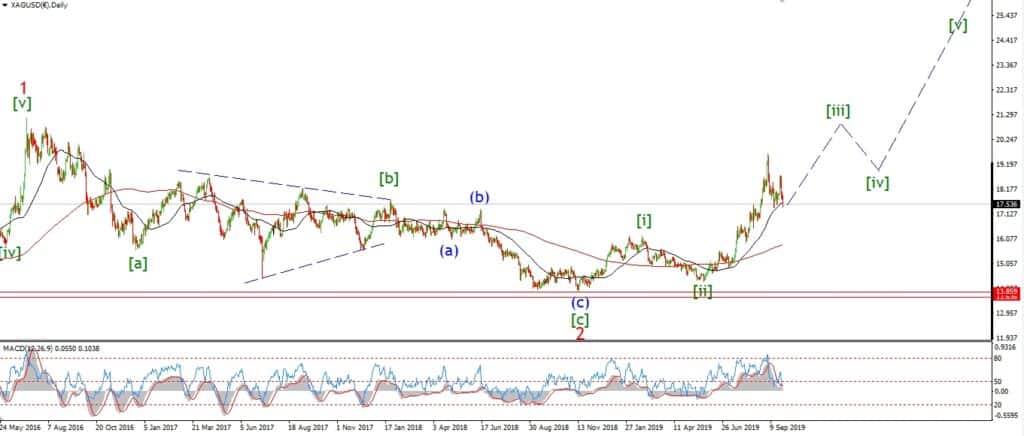
SILVER daily.
There is still no sign of wave ‘iii’ up yet.
Silver dropped off last weeks highs at 17.21 again today,
this decline can still qualify as part of wave ‘ii’ down.
but support at 16.73 must hold now.
A break of 16.63 will trigger the alternate count for wave (c).
In that case,
we should expect wave (c) to find a low at about 16.12 and then turn up into wave (i) again.
Tomorrow;
I am confident that wave (i) will carry price back above 18.00 again in the near future.
If we see a break of 17.21 again that will signal wave ‘iii’ of (i) has begun.
16.63 must hold.
U.S 10YR.
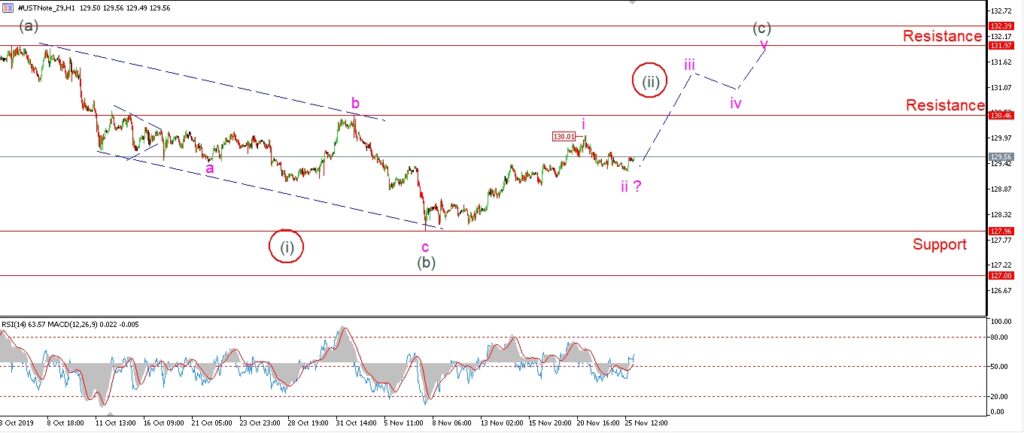
US 10YR 1hr.
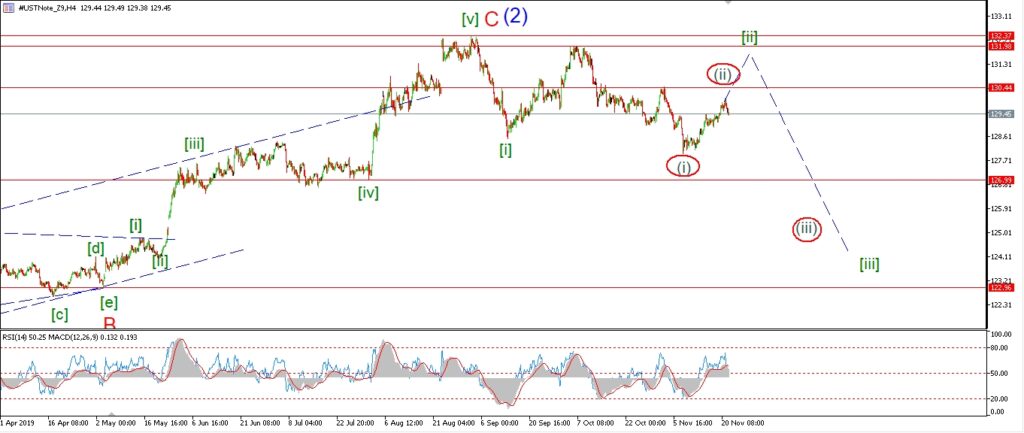
US 10YR 4hr.
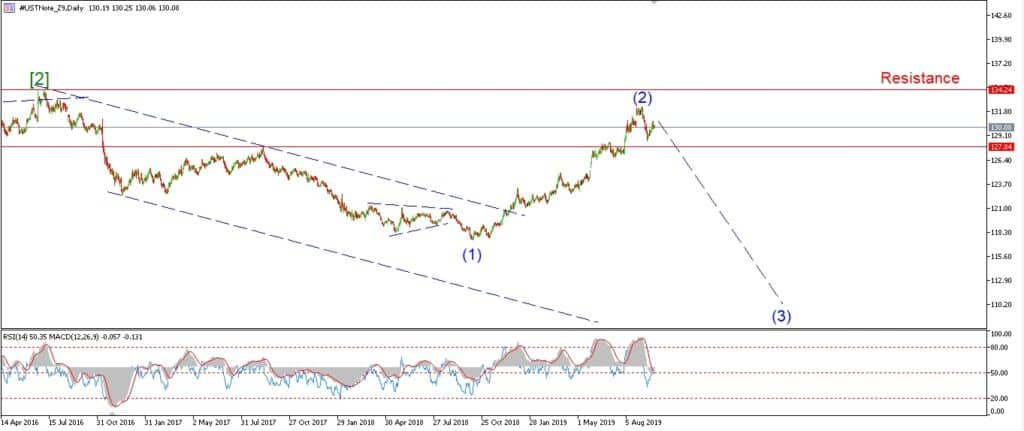
US 10YR daily.
The decline off last weeks highs at 130.00 is in three waves so far.
This pattern is now most likely wave ‘ii’ of (c) as shown.
If this short term count is correct,
then wave ‘iii’ of (c) will push above resistance at 130.46 again later this week.
I have shown a slightly different alternate count this eveing.
This count is tracking an expanded flat correction in wave (ii).
this would allow for a rally above 130.46 to complete wave (ii).
And then we should decline into wave (iii) of [iii].
Tomorrow;
Watch for price to turn higher and break 130.46 again.
The action at that level will dictate which short term count is correct.