
Good evening folks, the Lord’s Blessings to you all.
I simply must comment on todays wild action in the market after that cpi report.
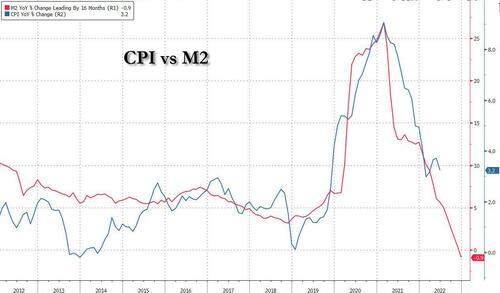
We got a decline again in the cpi which the market reads as – no more rate hikes, and maybe even rate cuts by the fed.
And that is bullish for the market…………..?
Well,
be careful what you wish for, is my take on this cpi data.
It is common knowledge that the fed raises rates into a market top, chasing the top all the way.
And then,
it cuts rates all the way down into the crash.
The rate hikes do not stop the rally,
and the rate cuts do not stop the crash.
The driver for rates is the bond market.
Rising rates suggest low demand for us govt debt,
which happens in a bull market scenario.
and falling rates suggests high demand for US govt debt,
which is exactly what happens in a market crash scenario!
The market crash scenario is dead ahead of us now.
And that cpi data already calls it.
The consumer has shunned economic activity and is starting to hold back.
the economic data is showing this for a while now,
and the cpi is a lagging indicator which is following the disinflation caused by the contracting economy.
The consumer is puffed out after years of overspend.
And now we have the natural reversal in that pendulum.
Here comes wave ‘3’ down.
https://twitter.com/bullwavesreal
EURUSD.
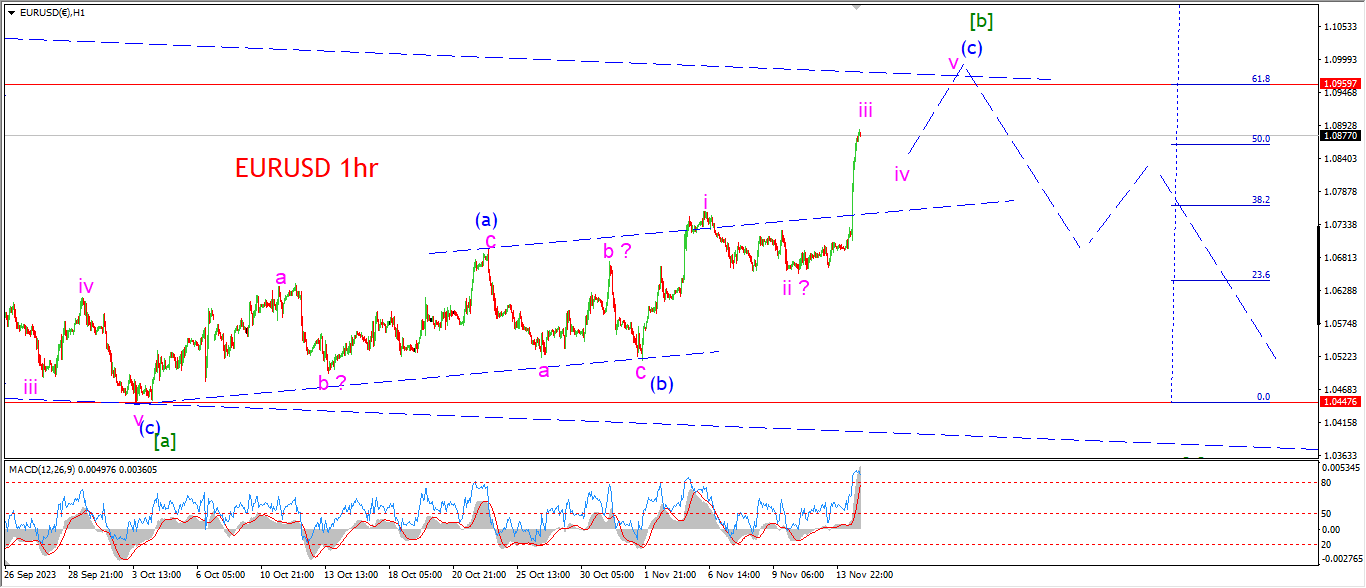
EURUSD 1hr.
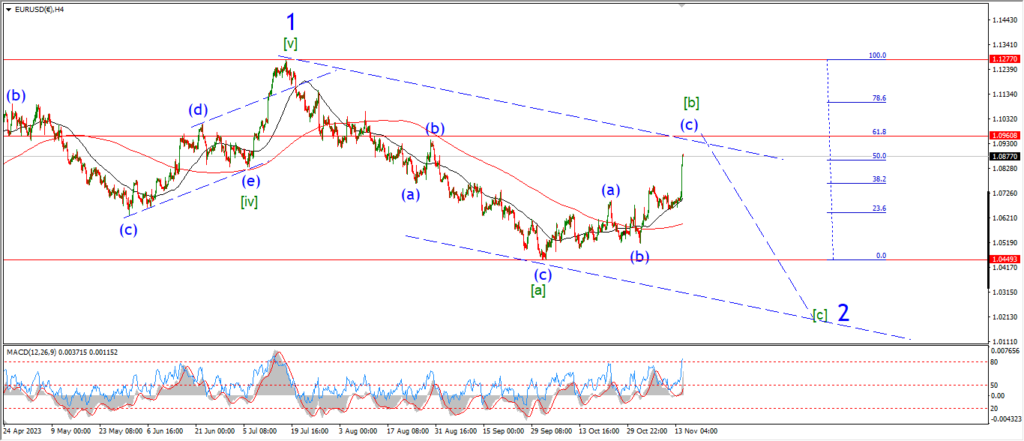
EURUSD 4hr.
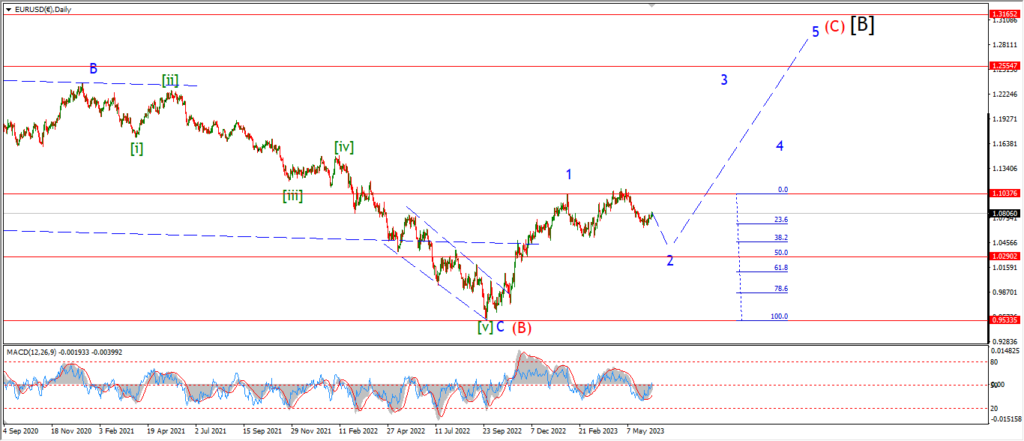
EURUSD daily.
We got a big spike higher in EURUSD today and that has invalidated the short term count now.
I gotta go back to the drawing board tonight as a result.
start with the 4hr chart.
The five wave decline into wave [c] of ‘2’ is not a good fit anymore.
I am now looking at a larger three wave decline into wave ‘2’.
With this recent rally happening in wave [b] of ‘2’.
Wave [b] has just hit the 50% retracement level of wave [a] today.
and we should be close to completing wave (c) of [b] now.
The hourly chart shows a possible five wave rally in wave (c) underway now.
and todays spike higher happened in wave ‘iii’ of (c) of [ii].
Wave ‘iv’ and ‘v’ should finish this pattern off for wave [b].
and then I will look lower into wave [c] next week.
Tomorrow;
Watch for wave (c) to complete a five wave rally near the 62% retracement level at 1.0960.
GBPUSD
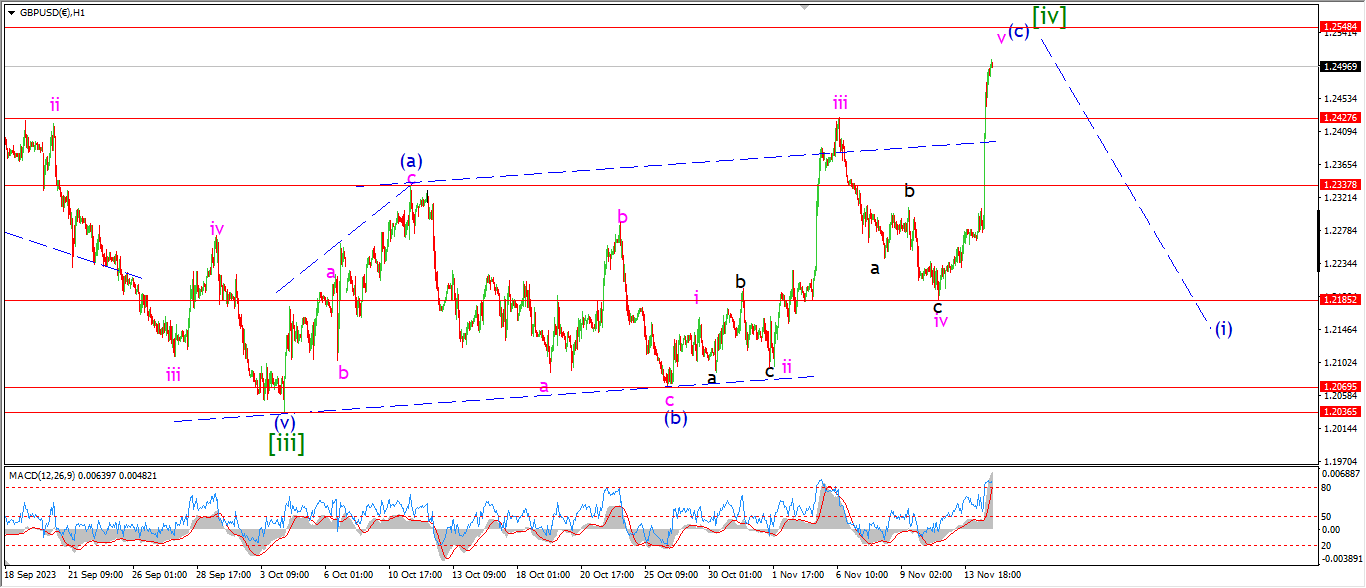
GBPUSD 1hr.
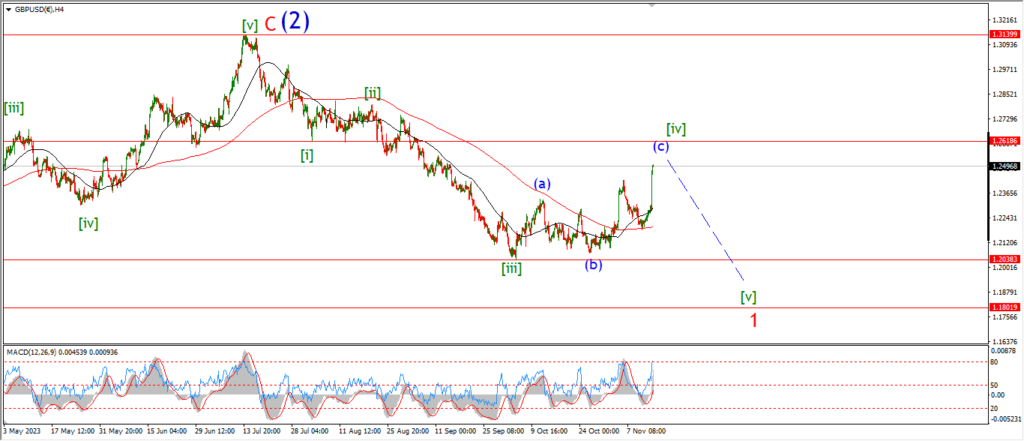
GBPUSD 4hr.
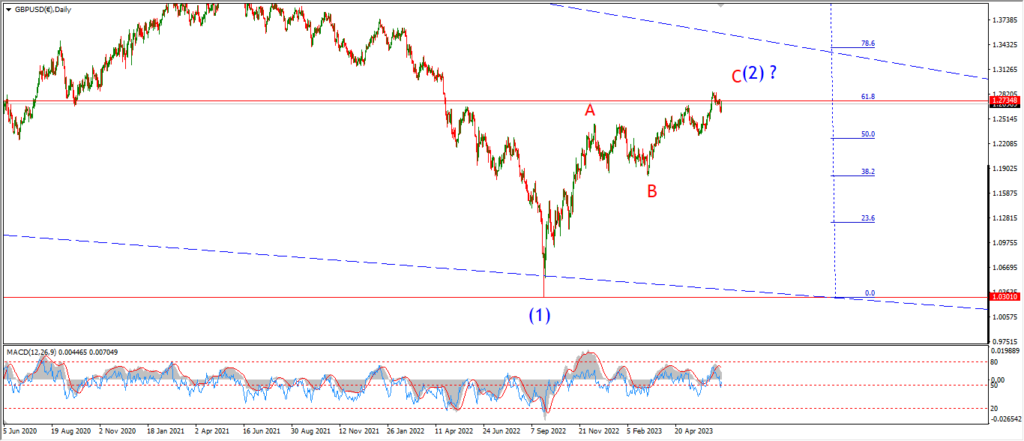
GBPUSD daily.
I am surprised by todays rally in cable also today but I think the pattern here wave [iv] still stands.
So there is no big changes in this overall out look for wave ‘1’ after that rally today.
The internal pattern of wave [iv] is still showing a 3,3,5 flat correction.
And now we have a new high for wave ‘v’ of (c) after toays burst higher.
The pattern within wave (c) of [iv] is a bit unorthodox I will admit.
But the decline last week can be counted as wave ‘iv’ down.
and now that wave ‘v’ has already reached a new high,
This pattern has done more than enough to complete the correction and the first move down into wave [v] will likely retrace most of todays rally.
It will be a case of easy come/easy go I think.
And lest we forget,
the very same rally/reversal happened here only a week ago within the same wave [iv] correction.
Tomorrow;
wAtch for wave ‘v’ of (c) to complete again with this throw-over above the upper trend line.
WAve (i) down will break 1.2185 after a five wave decline.
USDJPY.
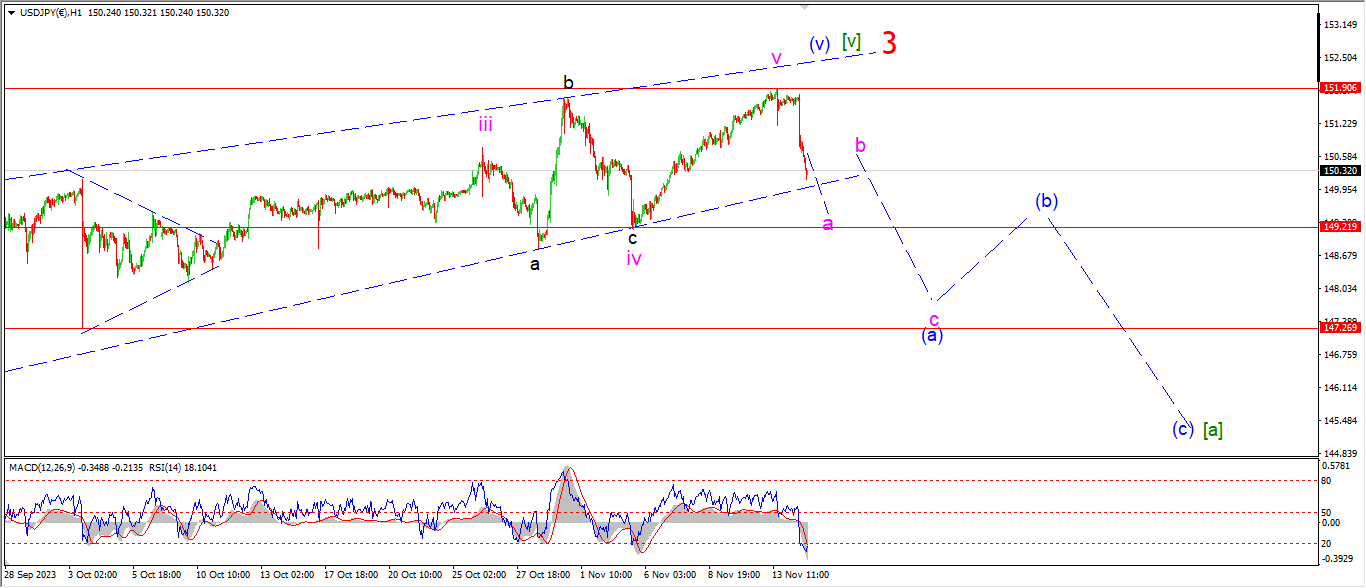
USDJPY 1hr.
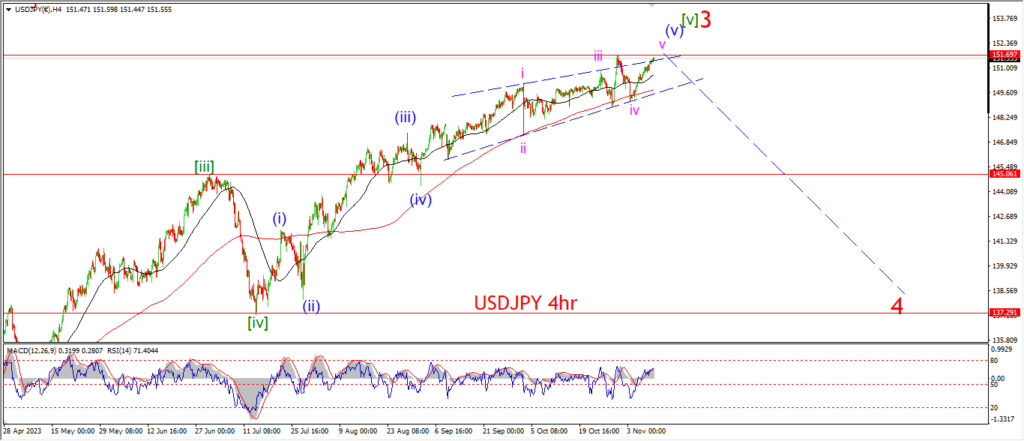
USDJPY 4hr.
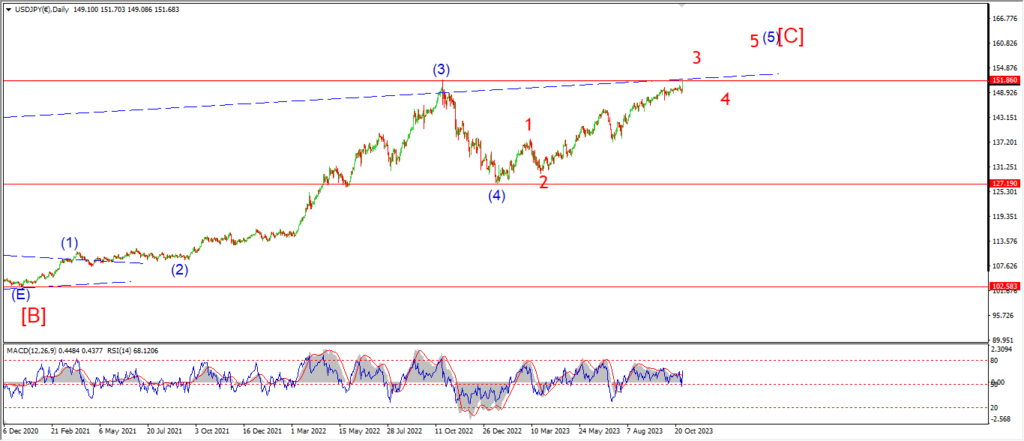
USDJPY daily.
The decline in USDJPY today was actually anticipated, for a change!
so it seems wave (v) of [v] is now suggesting a top again.
The price has not broken below the lower trend line yet,
so I am looking for a break of that level in wave ‘a’ of (a) as shown.
The larger wave (a) blue should trace out three waves down at a minimum.
And wave (b) Will then form a lower high next week.
Tomorrow;
WAtch for a signal that wave (a) is underway with a break of that lower trend line.
149.21 should offer support to wave ‘a’ down.
DOW JONES.
DOW 1hr.
DOW 4hr
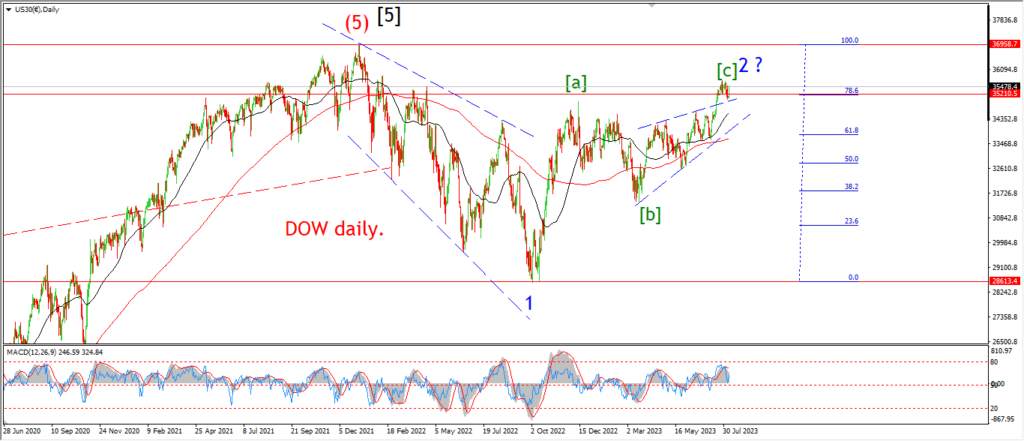
DOW daily.
I am going to go through two different scenarios for the Dow today after that insane spike rally today.
Both scenarios call this rally a second wave retracement in wave [ii] green.
The first is on the 4hr chart.
This involves an expanded flat correction higher in wave [ii].
Wave (c) of [ii] is now holding just below the 78.6% retracement of wave [i] at todays highs.
And wave (c) is very extended now after another rally today in wave ‘v’ of (c) of [ii].
the second scenario is shown on the 4hr chart.
Wave [ii] begins at the recent extreme lows in this scenario.
Wave (c) of [ii] is now hitting the 78.6% retracement level of wave [i] after todays rally.
And the channel is almost full now in wave (c) of [ii].
I want to see a top form in wave [ii] here very soon.
I will be dealing with a complete failure of the bearish setup if the rally goes on much more.
So it is important that we see a reversal over the next few sessions into wave (i) of [iii].
Tomorrow;
The extended rally into wave [ii] has already shown an extreme in momentum which is now forming a lower high on the 4hr chart.
This will usually lead to a reversal off the top.
so I am watching for wave (i) of [iii] to begin soon.
GOLD
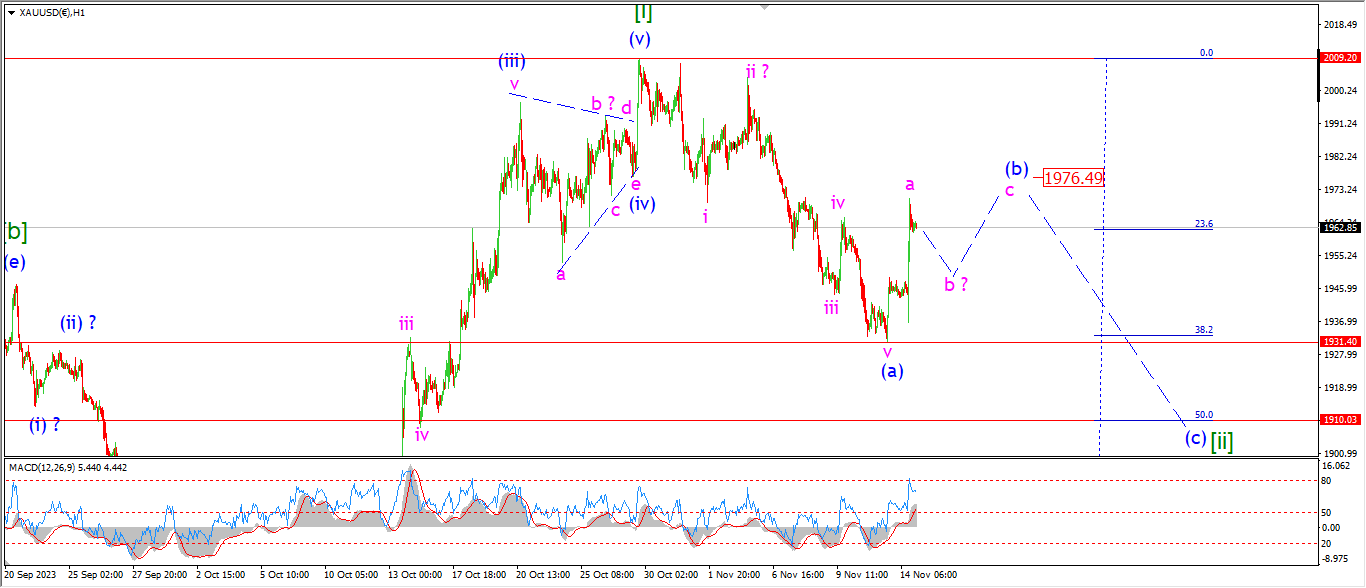
GOLD 1hr.
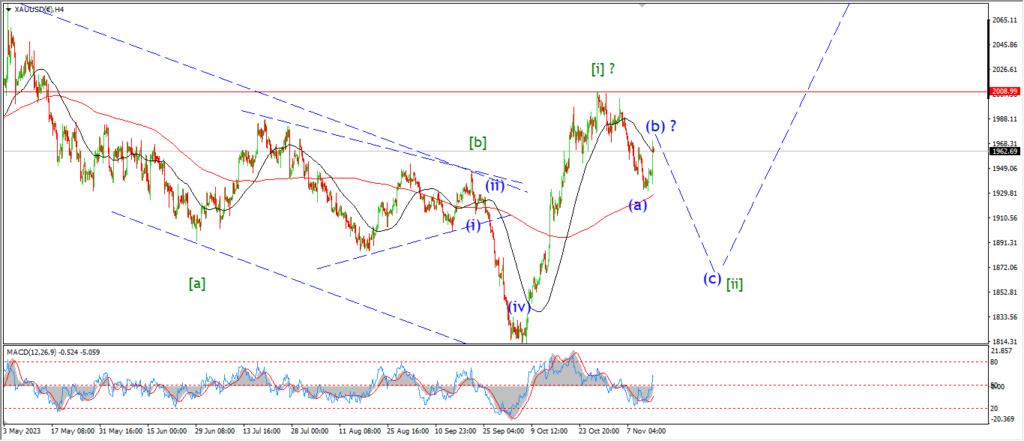
GOLD 4hr.
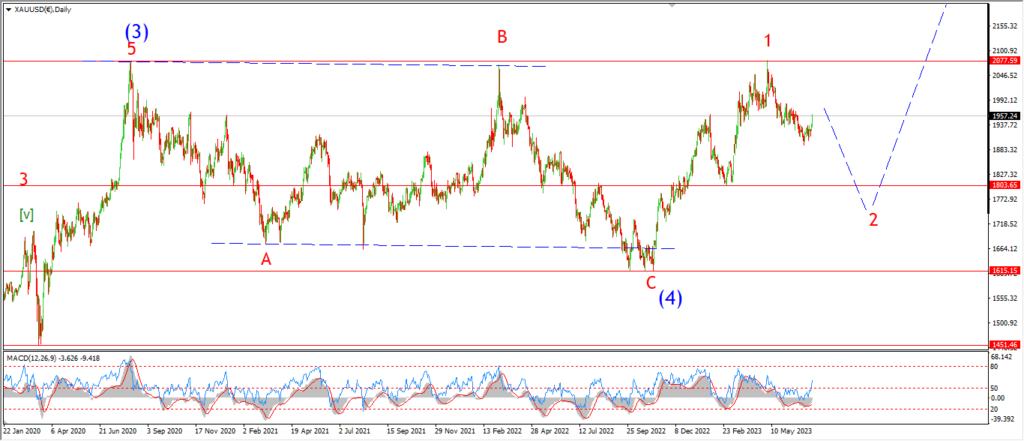
GOLD daily.
Gold got a boost today from that general knee jerk reaction in the markets.
Wave ‘a’ of (b) seems to be complete after todays spike higher.
so I am looking for wave ‘b’ to turn lower and form a higher low near 1950 over the next few days as shown.
Wave ‘c’ should come in before Friday and complete wave (b) near 1980 again.
Tomorrow;
Watch for a three wave decline in wave ‘b’ to complete near the 1950 area.
CRUDE OIL.
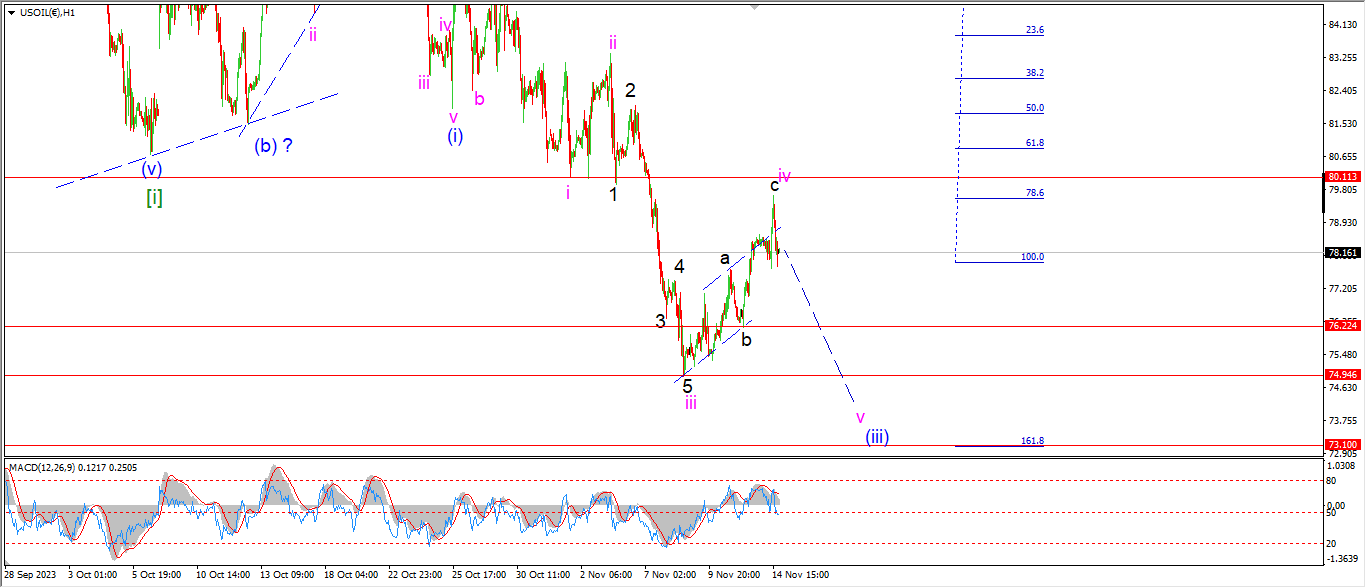
CRUDE OIL 1hr.
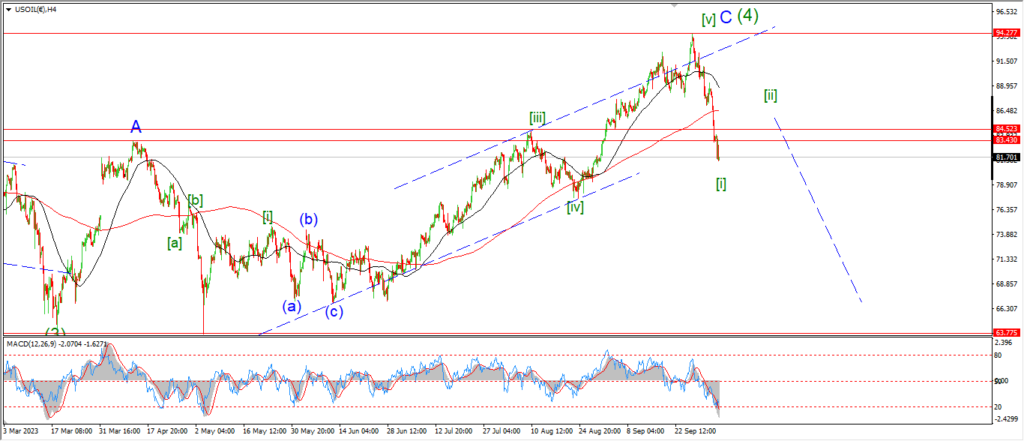
CRUDE OIL 4hr.
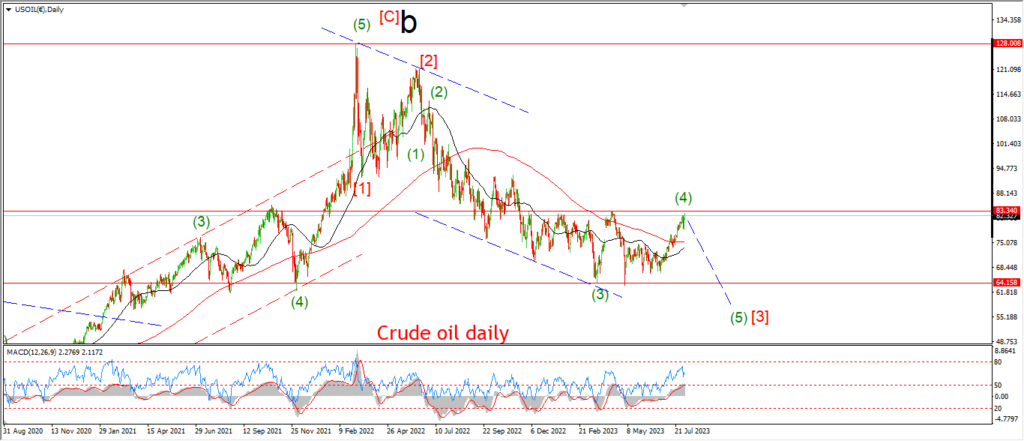
CRUDE OIL daily.
Crude oil tried to rally out of the channel today but gravity pulled it right back down again!
This market may be signalling the very temporary nature to todays bounce.
In fact thee rally in crude has been fully retraced this evening,
and again I am looking at the possibility for wave ‘v’ of (iii) to turn lower again as shown.
Tomorrow;
The low at wave ‘b’ of ‘iv’ is the first support level for this decline in wave ‘v’.
So a break of 76.22 again is the main level I am looking at here to signal wave ‘v’ is underway.
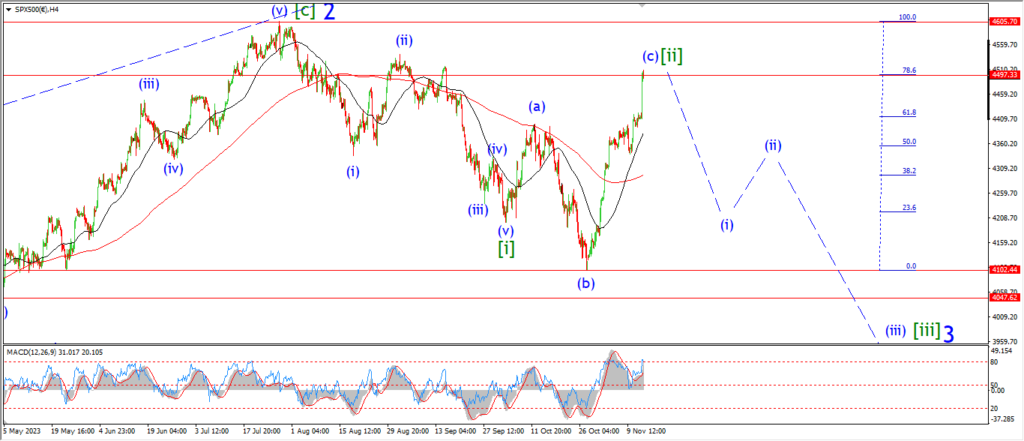
S&P 500.
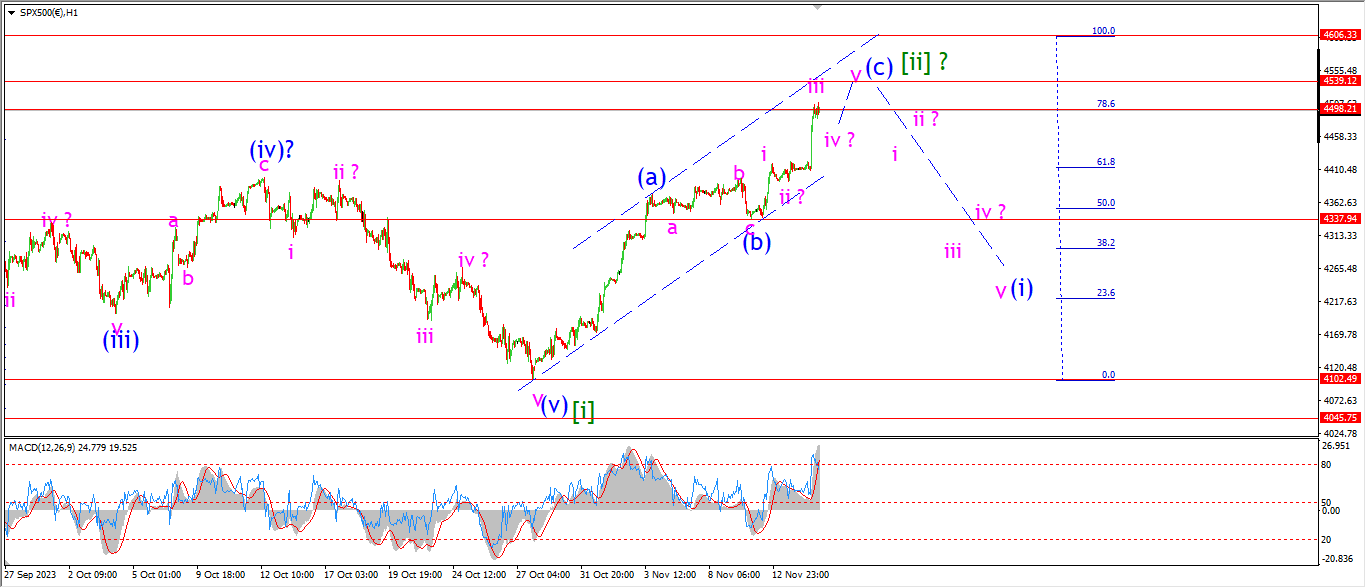
S&P 500 1hr
S&P 500 4hr
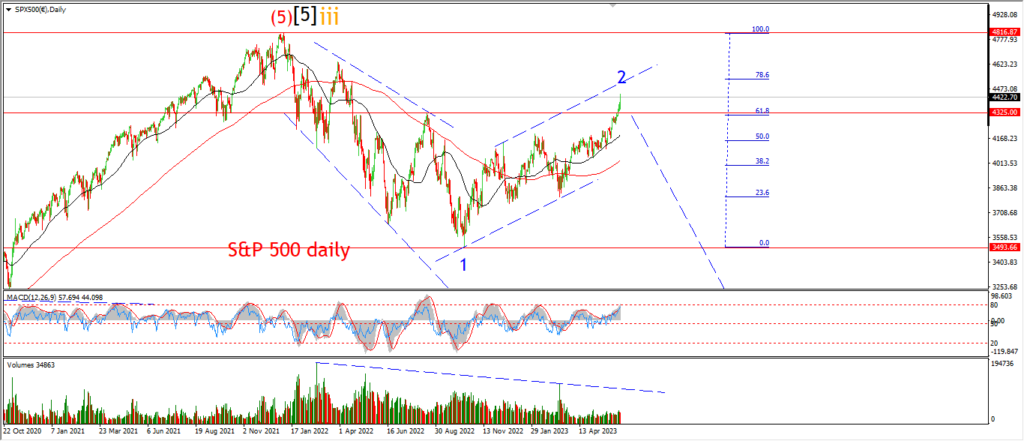
S&P 500 daily.
The S&P is getting close to that danger area also tonight after a sharp rally in this market also.
I am showing a few changes to the internal pattern for wave [ii] here,
but the overall idea remains the same.
We have three waves up into wave [ii] underway.
And todays rally has brought the end of this pattern one step closer.
Wave (c) of [ii] is shown as a five wave pattern.
and todays spike higher is labelled as wave ‘iii’ of (c) of [ii].
There have been enough typical retracement levels already hit in this wave [ii] rally to call it complete.
and yet the pattern has refused to halt this rally yet at least.
So I want to see the top of wave (c) come in tomorrow and then a reversal down into wave (i) of [iii] tomorrow.
Tomorrow;
Watch for wave (c) to complete five waves up as shown.
Lets see if the invalidation line at 4606 will hold.
A break of that level will invalidate the whole pattern.
SILVER.
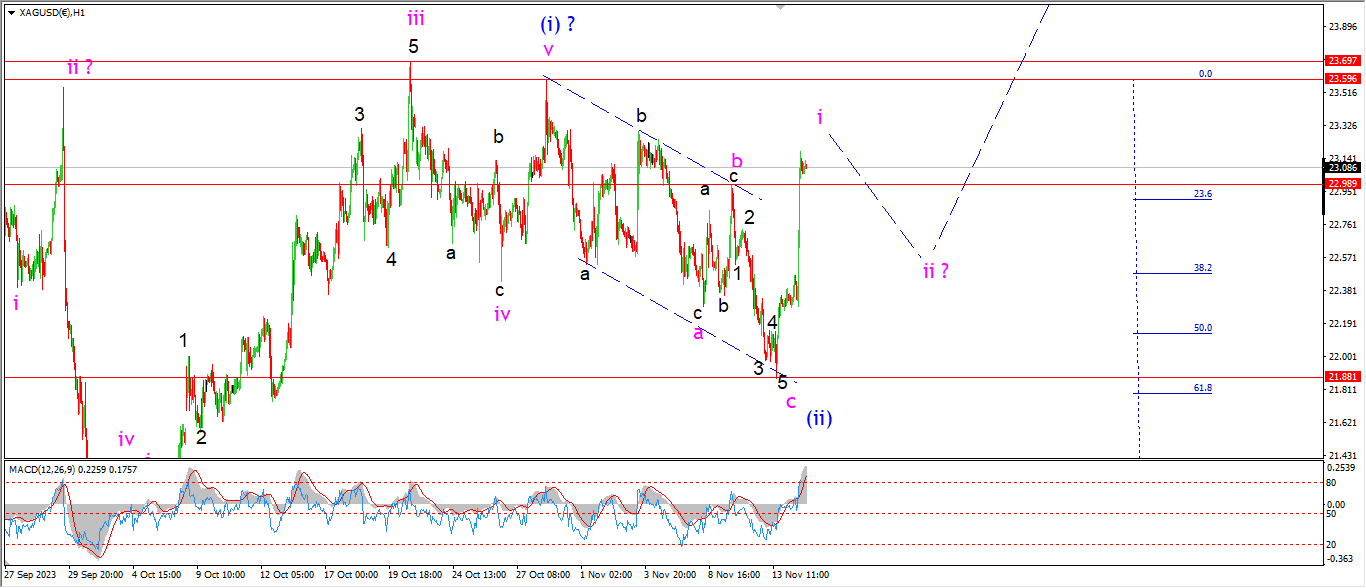
SILVER 1hr
SILVER 4hr.
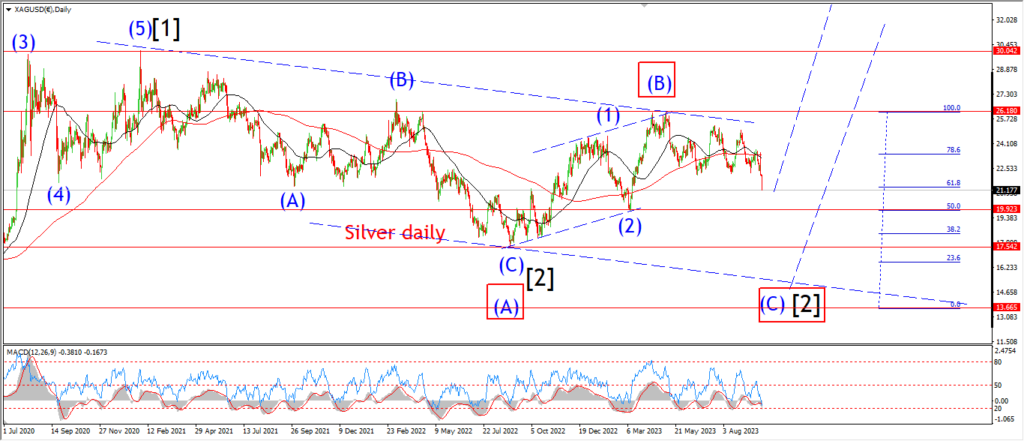
SILVER daily.
Silver spiked higher also today and the wave ‘b’ high was broken at the top this evening.
Wave ‘i’ of (iii) should be close to complete now.
And I am looking for a correction lower into wave ‘ii’ over the coming days.
If we see a drop into the 22.50 area in wave ‘ii’ then we will be in line for a bullish higher low in wave ‘ii’ to form.
Tomorrow;
watch for one more small pop to complete wave ‘i’ of (iii) tomorrow.
A drop back below 22.90 again will signal wave ‘ii’ is underway.
BITCOIN
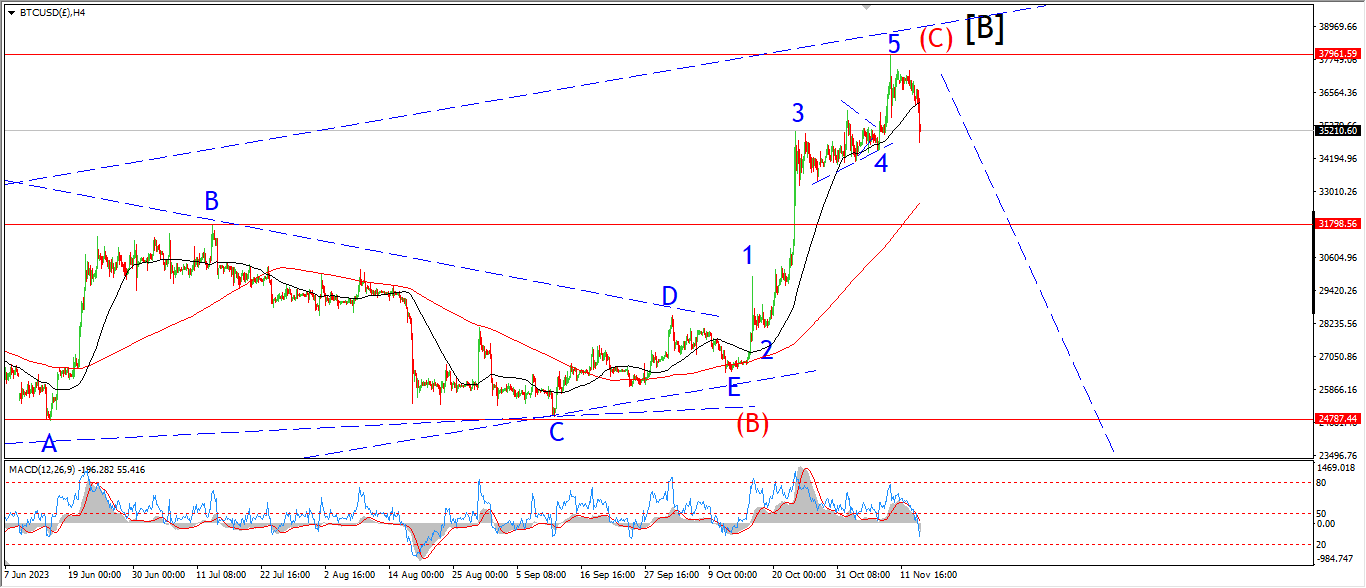
BITCOIN 1hr.
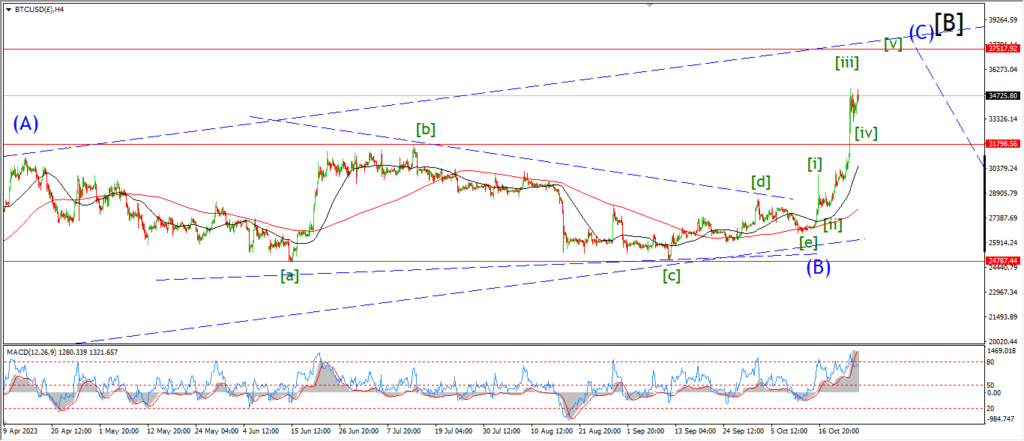
BITCOIN 4hr.
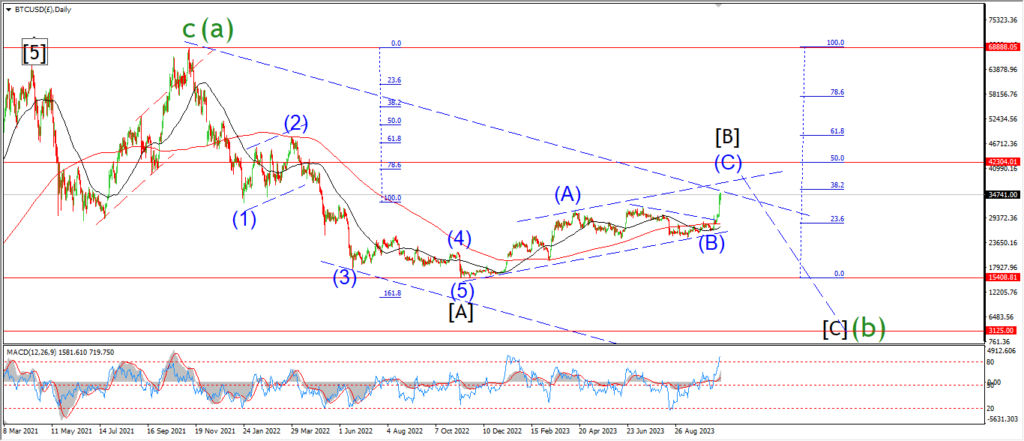
BITCOIN daily.
….
FTSE 100.
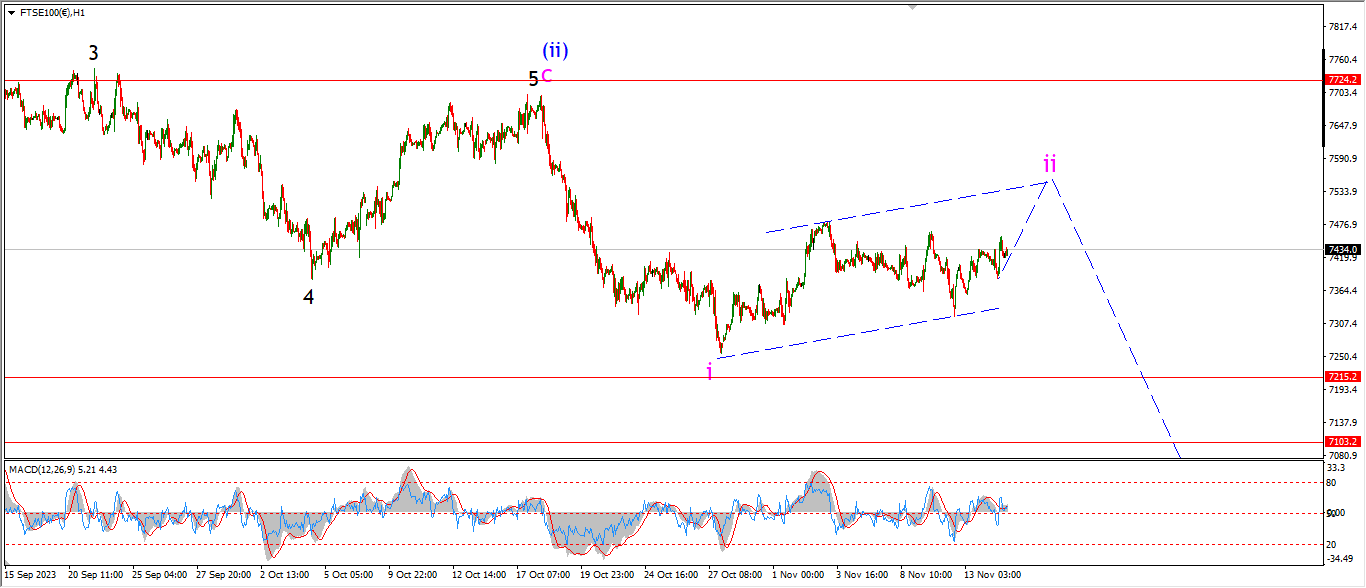
FTSE 100 1hr.
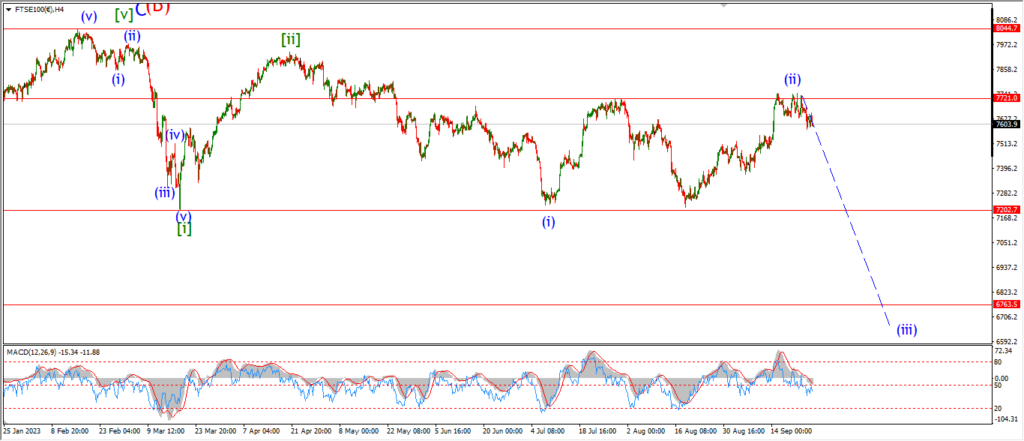
FTSE 100 4hr.

FTSE 100 daily.
….
DAX.
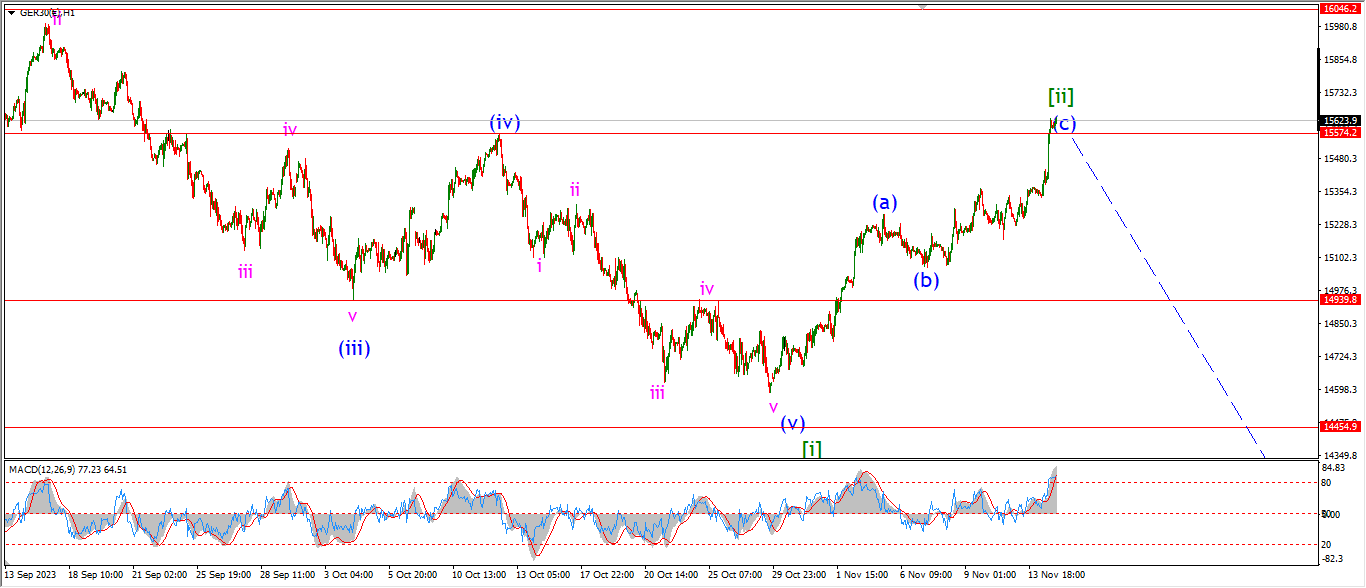
DAX 1hr
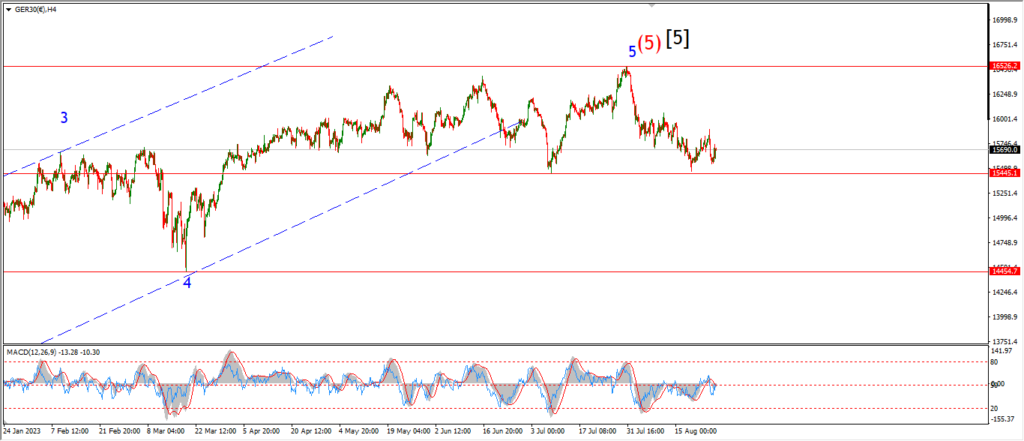
DAX 4hr

DAX daily.
….
NASDAQ 100.
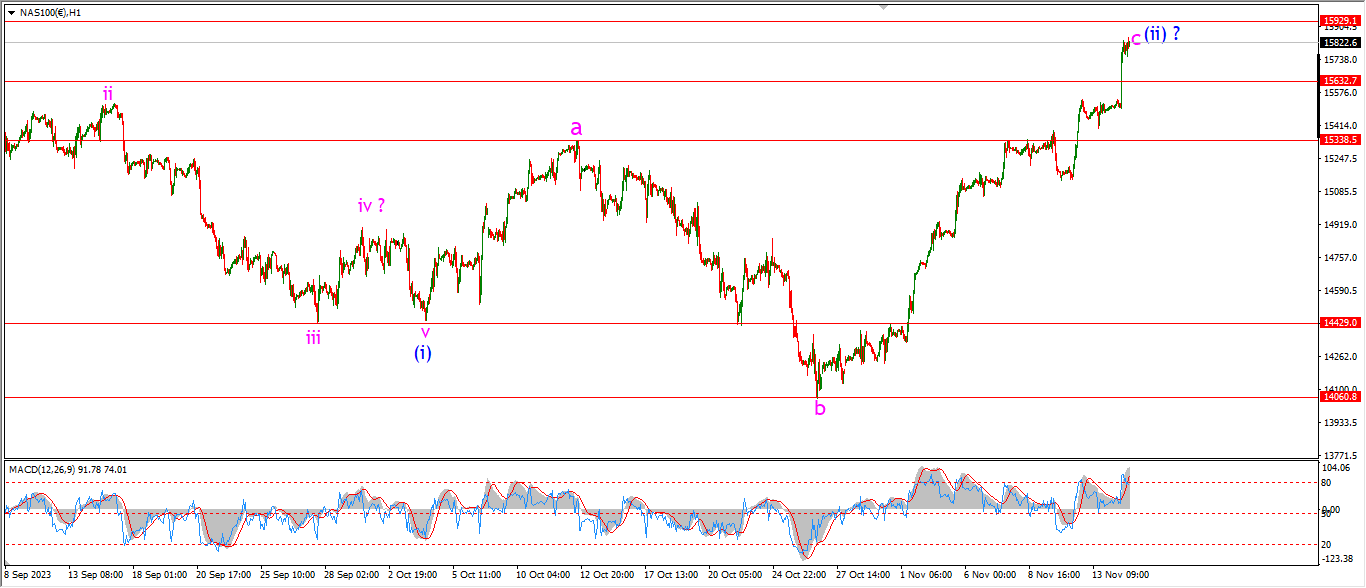
NASDAQ 1hr
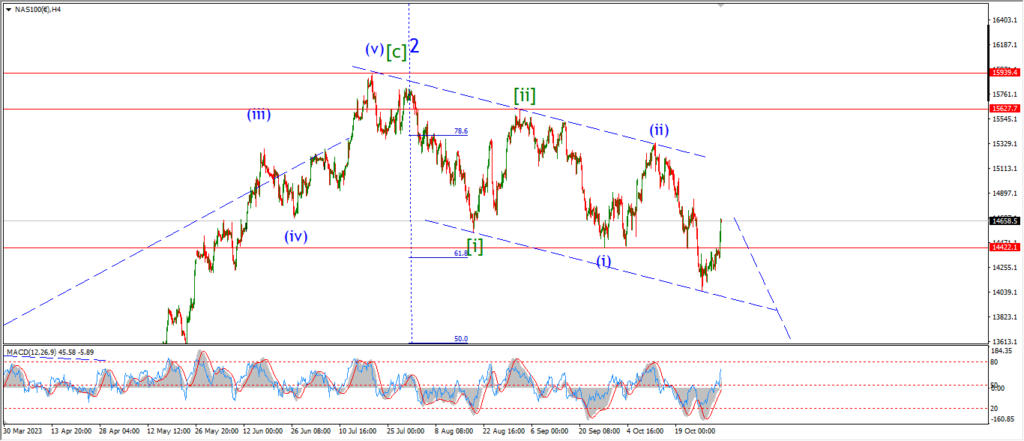
NASDAQ 4hr.
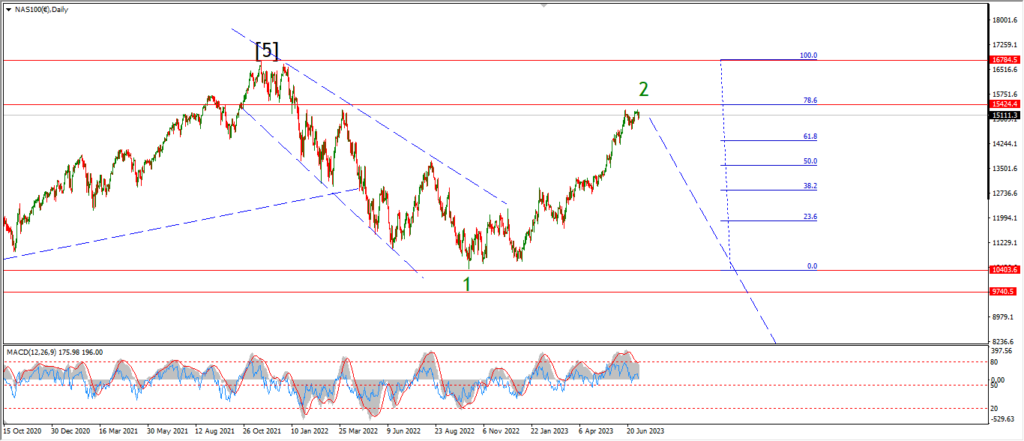
NASDAQ daily.
….