
Good evening folks and the Lord’s blessings to you.
EURUSD.
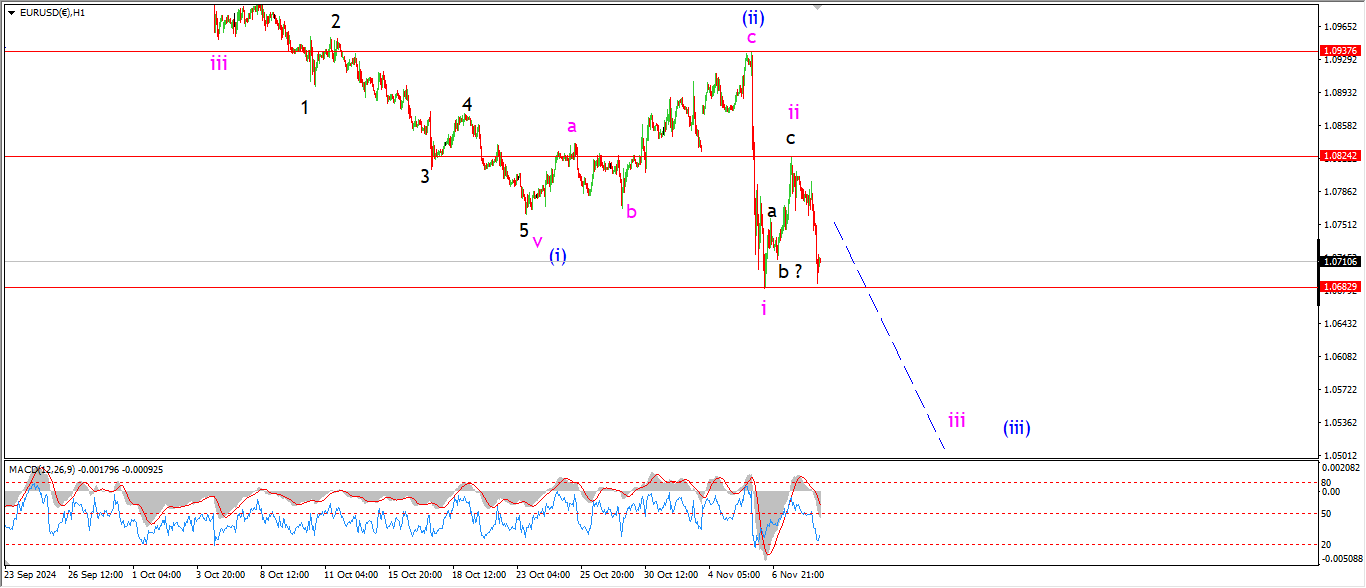
EURUSD 1hr.
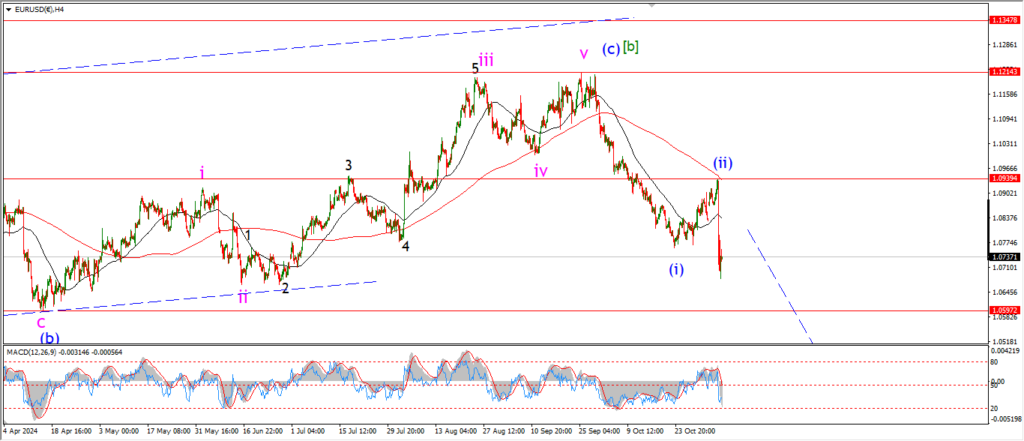
EURUSD 4hr.
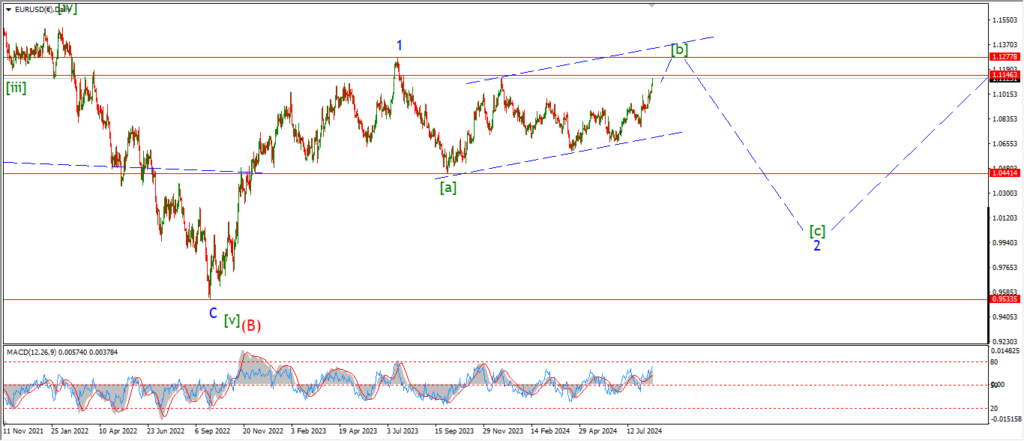
EURUSD daily.
A move lower again today suggests that wave ‘iii’ may well be in play now.
the price has not broken the wave ‘i’ level at 1.0682 yet,
this count can only be confirmed with a break of that level.
Wave ‘iii’ should move quickly through the wave ‘i’ low and continue lower to complete five waves in wave (iii) later next week.
I am looking for a low in wave (iii) near 1.0400 ideally.
so there is still work to do here.
Tomorrow;
Watch for wave ‘ii’ to hold at 1.0824.
Wave ‘iii’ down will complete a five wave pattern itself by Tuesday if all goes well.
GBPUSD
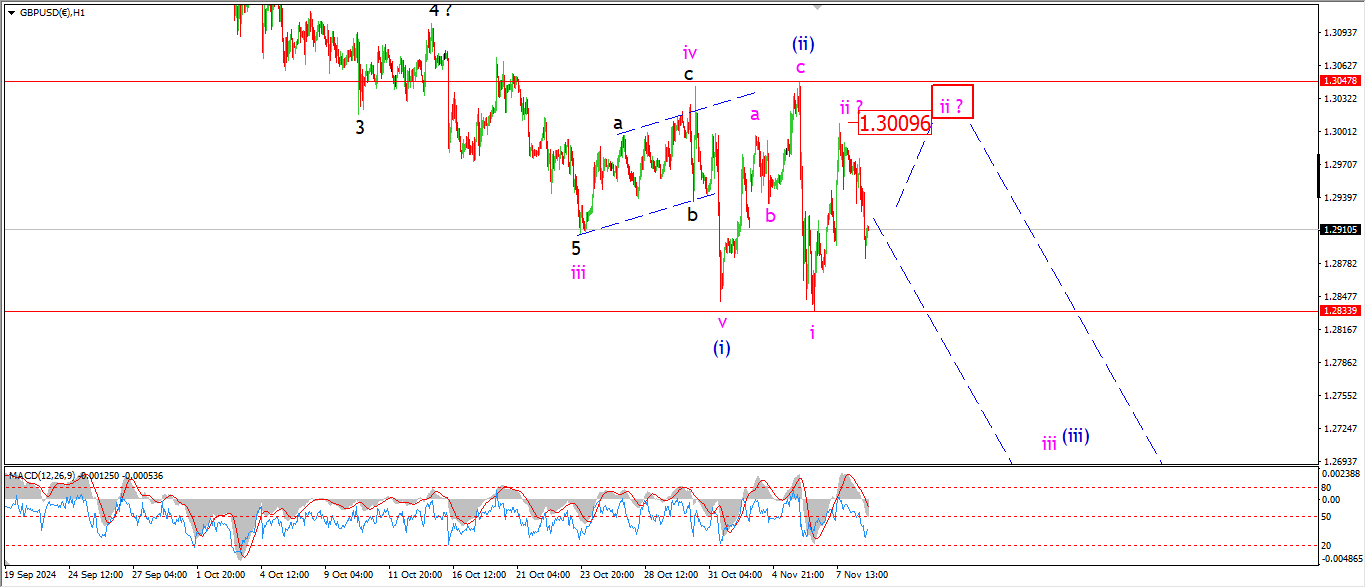
GBPUSD 1hr.
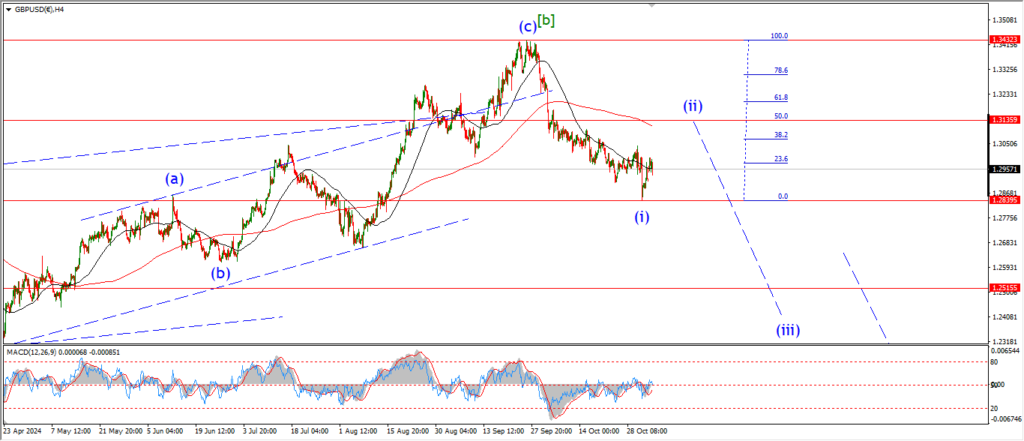
GBPUSD 4hr.
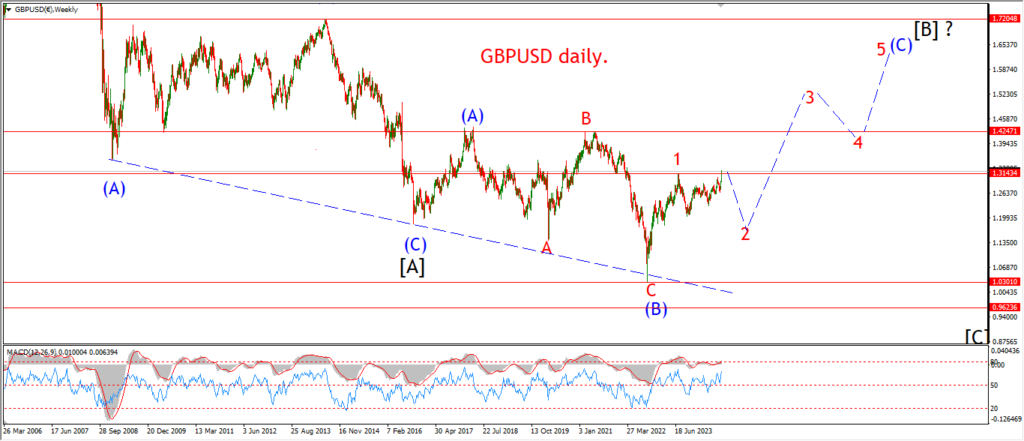
GBPUSD daily.
Cable moved lower also today but the pattern is less than ideal yet.
wave ‘i’ lies at 1.2833,
and only a break of that level will confirm wave ‘iii’ is underway.
So,
as it stands here there is still a chance that wave ‘ii’ is still unfolding.
The lower we go,
then more likely wave ‘iii’ becomes.
Monday;
Watch for wave ‘ii’ to hold at 1.30.
Wave ‘iii’ down should move below 1.2833 and continue lower in five waves if this pattern is correct.
USDJPY.
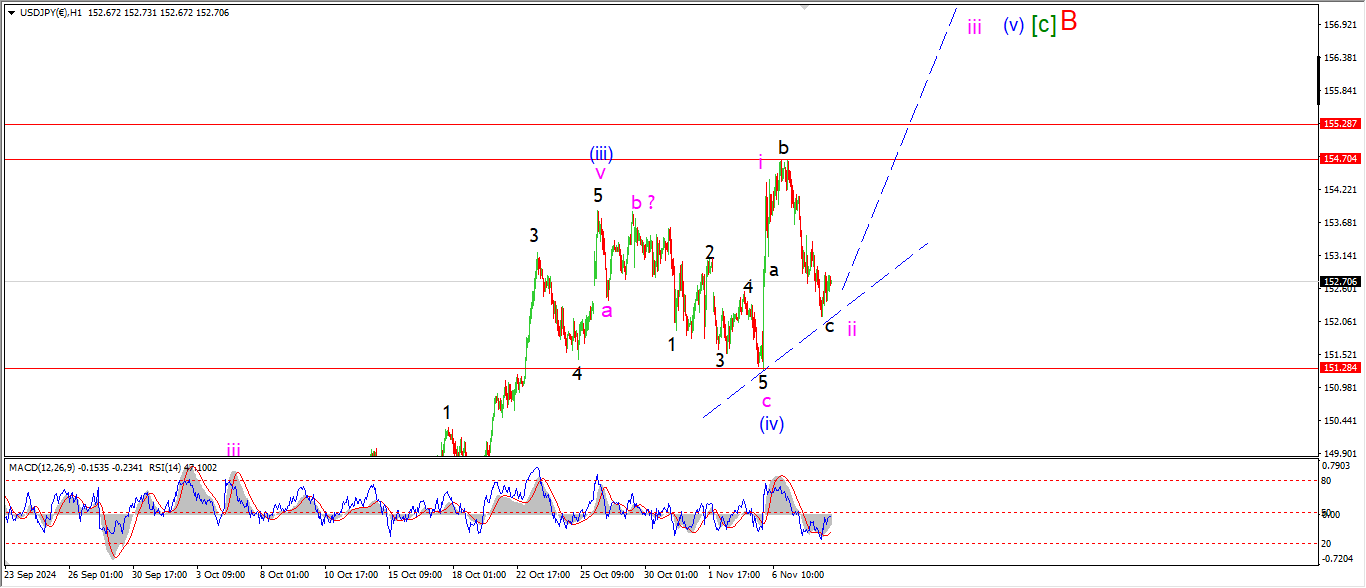
USDJPY 1hr.
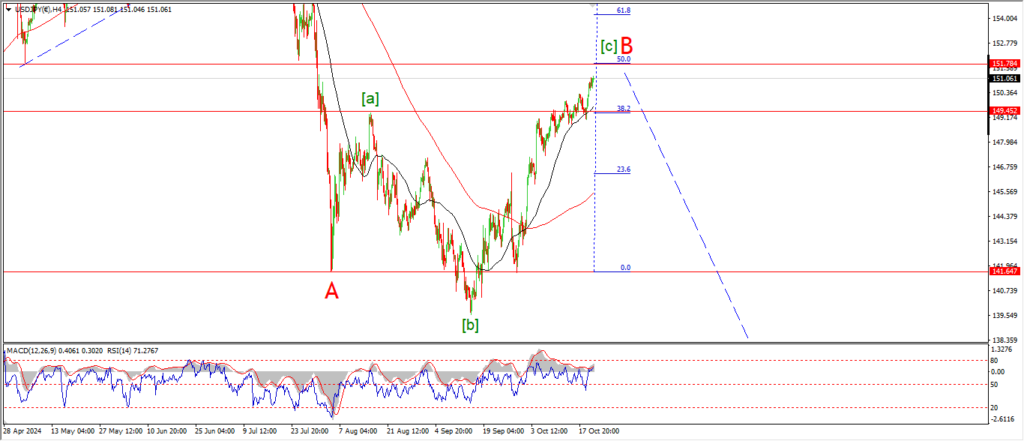
USDJPY 4hr.
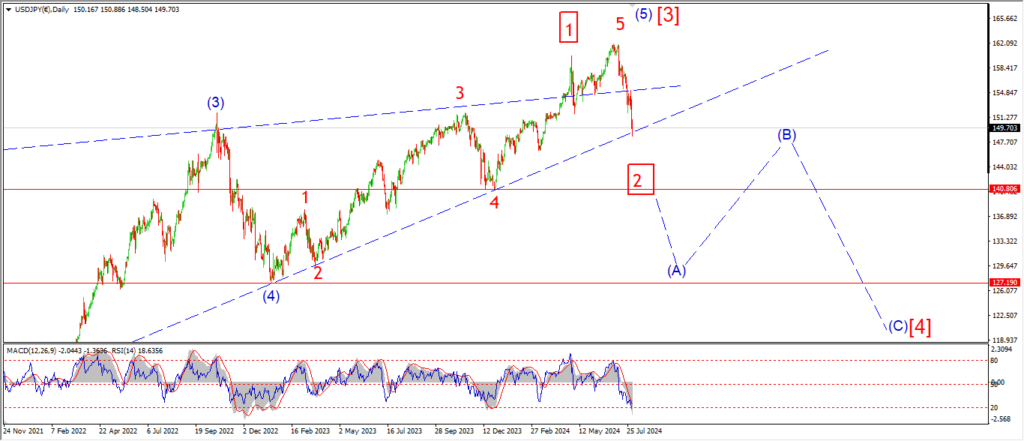
USDJPY daily.
The 4hr chart suggests that we are quite close to a top in wave [c] of ‘B’ right now,
so I don’t expect any major gains to the upside even if wave (v) is still working higher here.
The hourly count calls for a five wave pattern into wave (v) of [c] to come,
and as long as the low at wave (iv) holds at 151.28,
then this count remains the strongest interpretation.
A break below the wave (iv) low will signal that wave ‘B’ is completing and wave ‘C’ is about to get underway.
Monday;
watch for wave ‘iii’ of (v) to trace out five waves up over the next few days to complete the larger wave [c] of ‘B’.
DOW JONES.
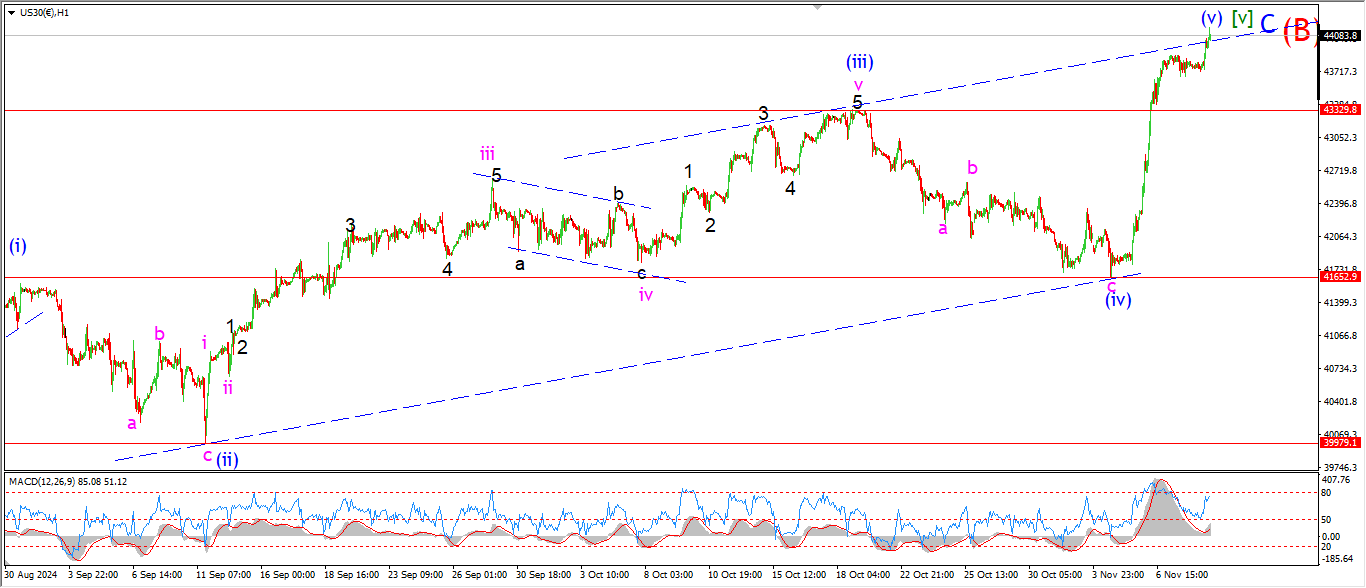
DOW 1hr.
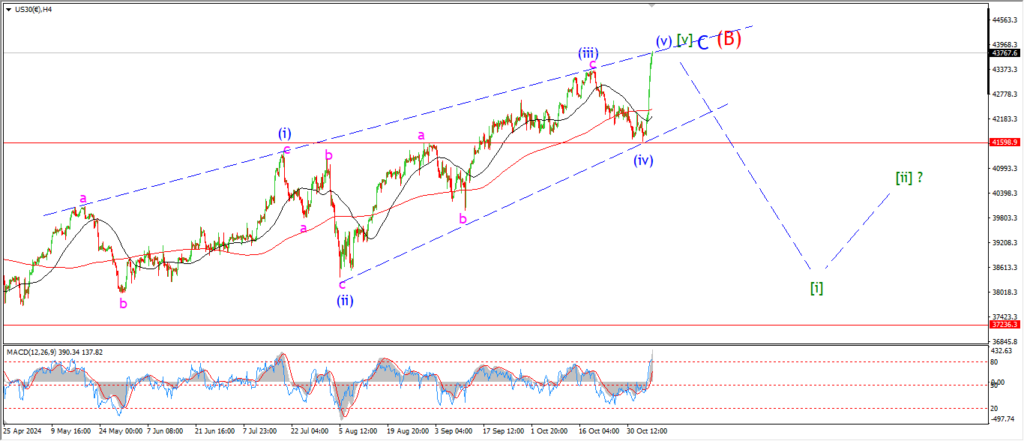
DOW 4hr
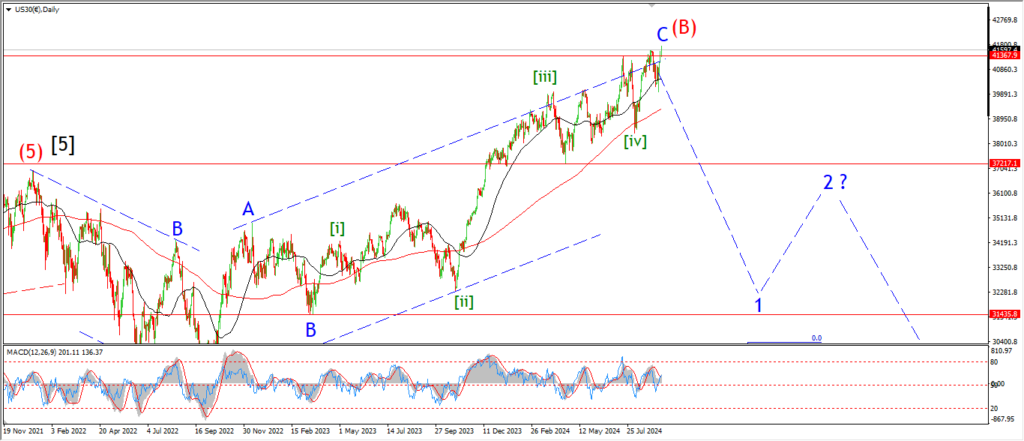
DOW daily.
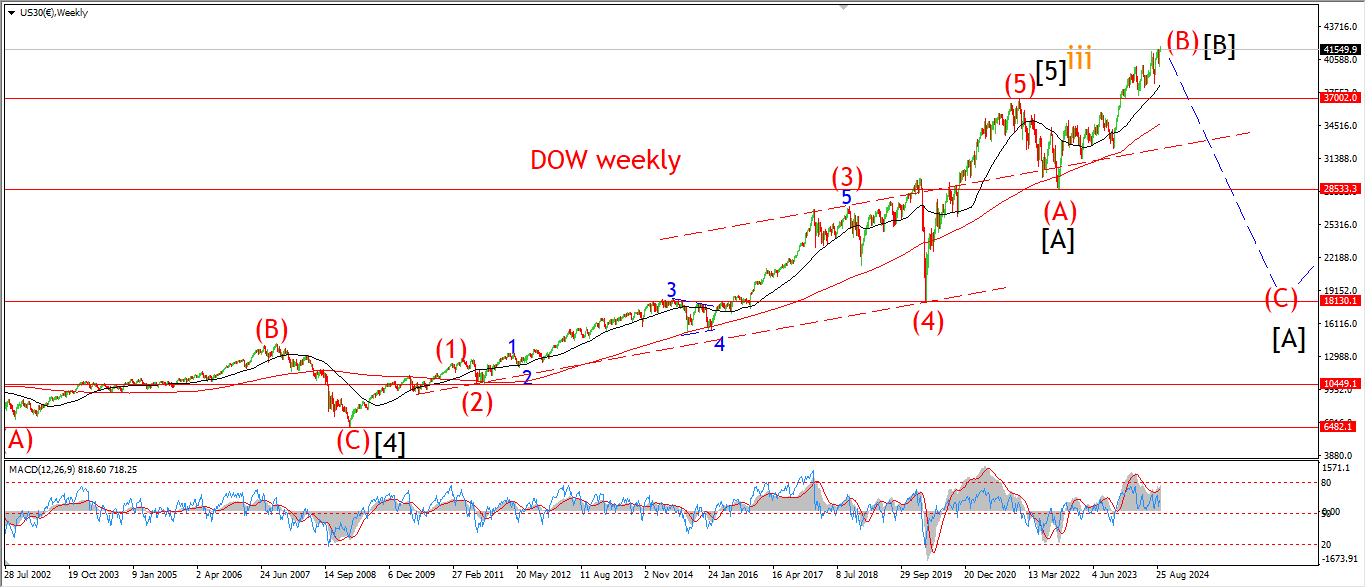
Up up and away in wave (v) of [v] again!
You would be forgiven for thinking that the stock market never actually goes down or that an economy can actually go into a contraction mode.
This is the consensus,
and this is dead wrong.
the market has tripped into another gear this week for sure,
but it is simply fulfilling the larger pattern with a slightly different twist.
Short term sentiment got a boost for some reason this week.
And now the wave [v] pattern gets an extension.
That’s it,
end of story.
I have shown on the weekly video the general pattern setup on the larger degree charts.
Wave [v] has now filled it’s trend channel again.
and the outcome will be a reversal into wave [i] in due course.
Monday;
Watch for a reaction off this upper trend channel line as wave (v) blue completes.
This will indicate the reversal is coming.
GOLD
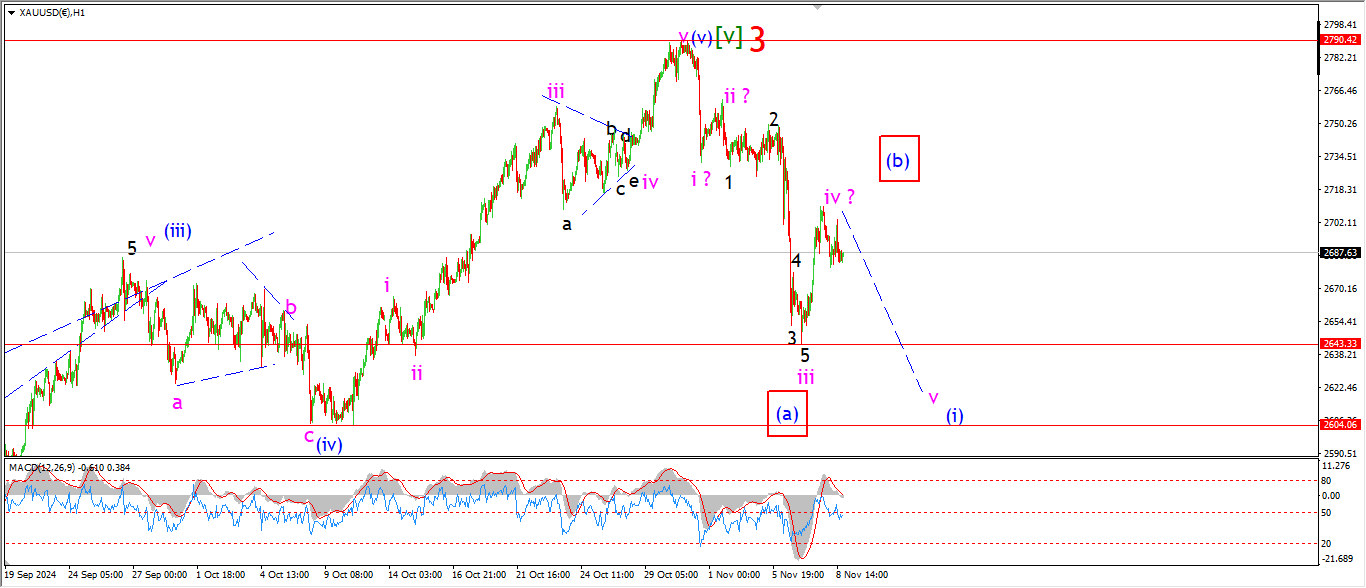
GOLD 1hr.
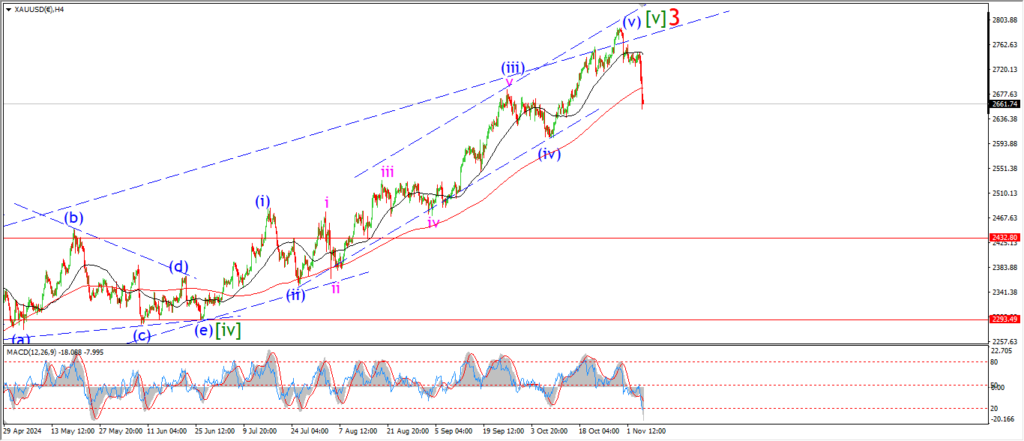
GOLD 4hr.
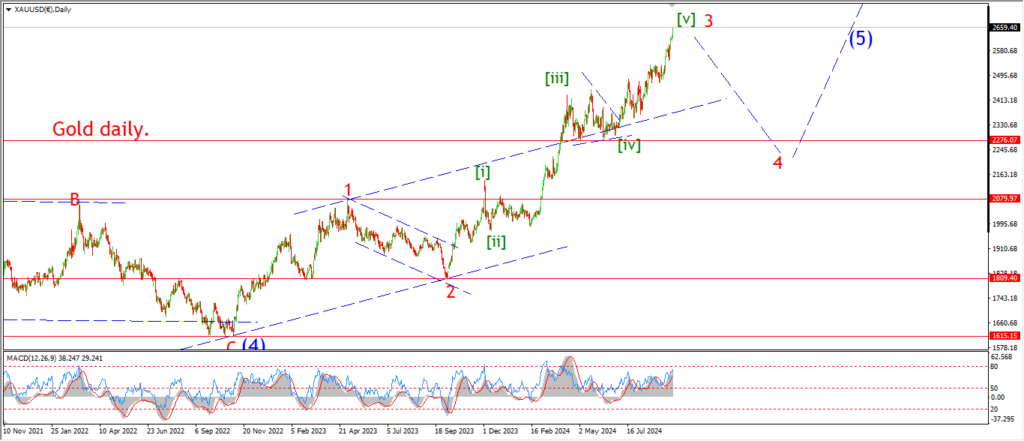
GOLD daily.
I think I coverd the confused pattern in gold in the video also tonight so it may be worth watching for some infill!
In general,
the correction into wave ‘4’ is going to be impossible to nail down until much later in the pattern.
So the initial moves into wave [a] of ‘4’ remains open to interpretation for at least the next week.
It can take many many forms as corrections do.
but fourth waves are notorious for being even more difficult!
At the moment I am watching a possible five wave pattern into wave (i) or (a) of [a].
But the alternate idea in the red boxes is just as applicable here.
the early trade on Monday should clear up at least wave (i) blue.
From there it is a case of each wave as it comes.
Monday;
watch for wave ‘v’ of (i) to fall back below 2643 to confirm five waves down.
and then we can begin to look for wave (ii) by midweek.
CRUDE OIL.
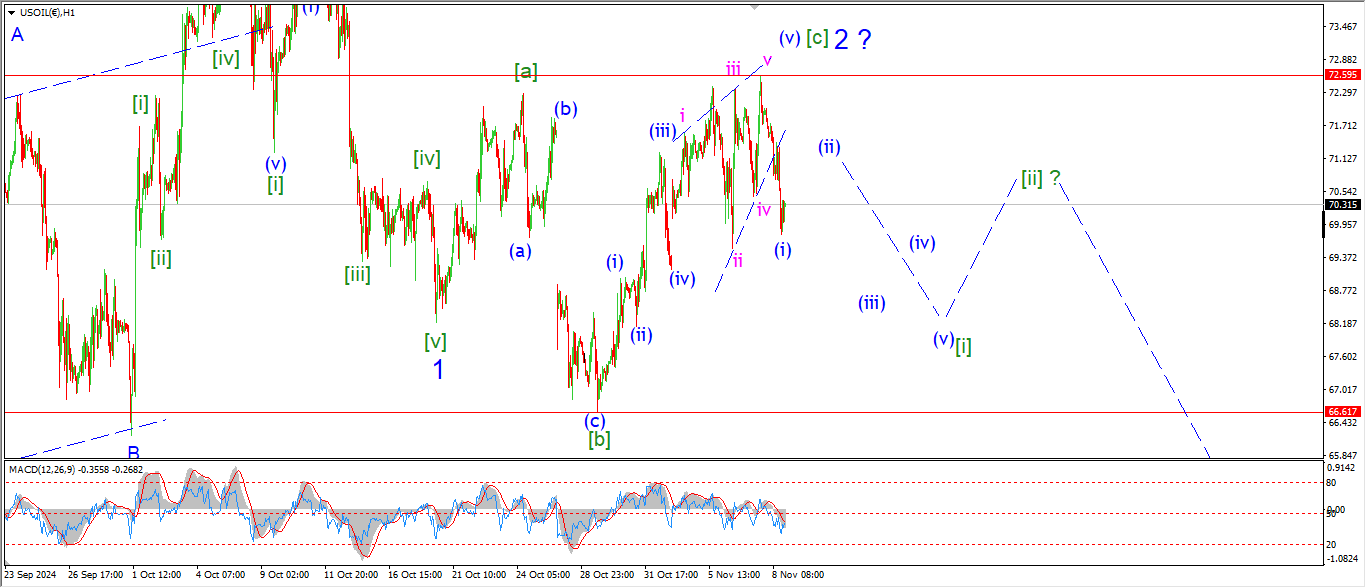
CRUDE OIL 1hr.
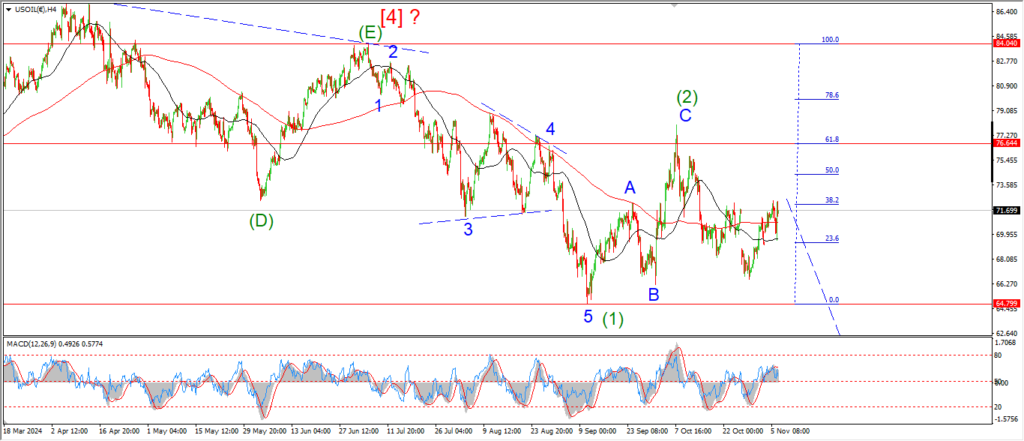
CRUDE OIL 4hr.
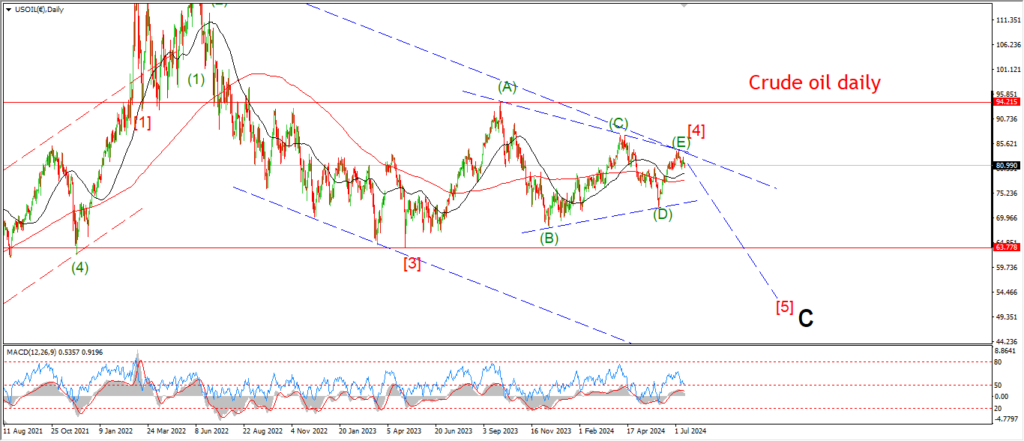
CRUDE OIL daily.
Well crude is now flirting with 70.00 again as we hit the close tonight.
The move is quite sharp again,
so this can easily be wave (i) of [i] here.
We will need some confirmation on that next week.
But a lower high in wave (ii) on Monday is what I am looking for.
and further downside again in five waves to complete wave [i] green over the rest of the week.
tomorrow;
Watch for wave (i) and (ii) to create a lower high as shown.
then we should see another step lower into wave (iii) by midweek.
S&P 500.
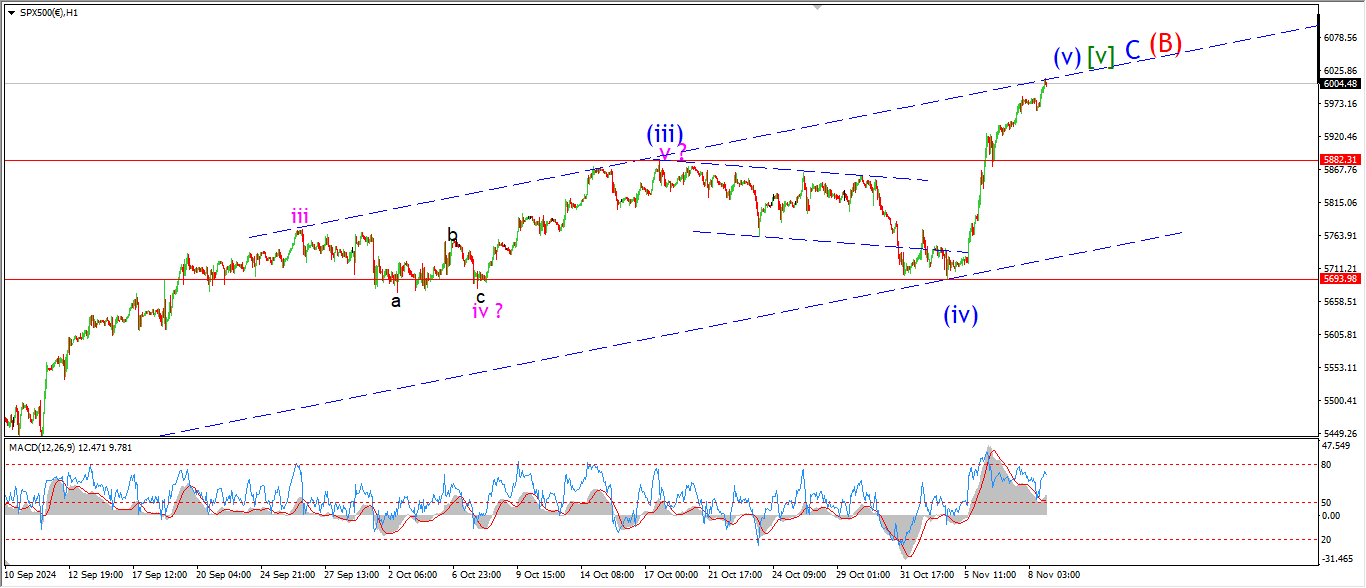
S&P 500 1hr
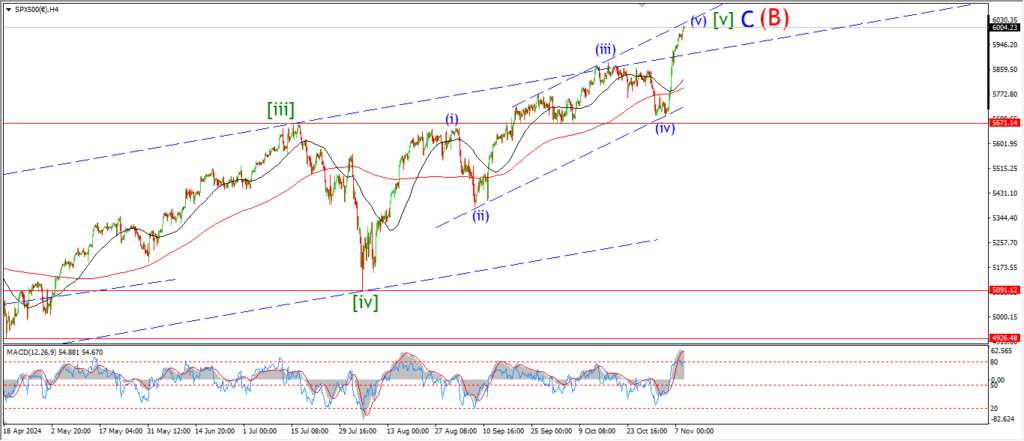
S&P 500 4hr
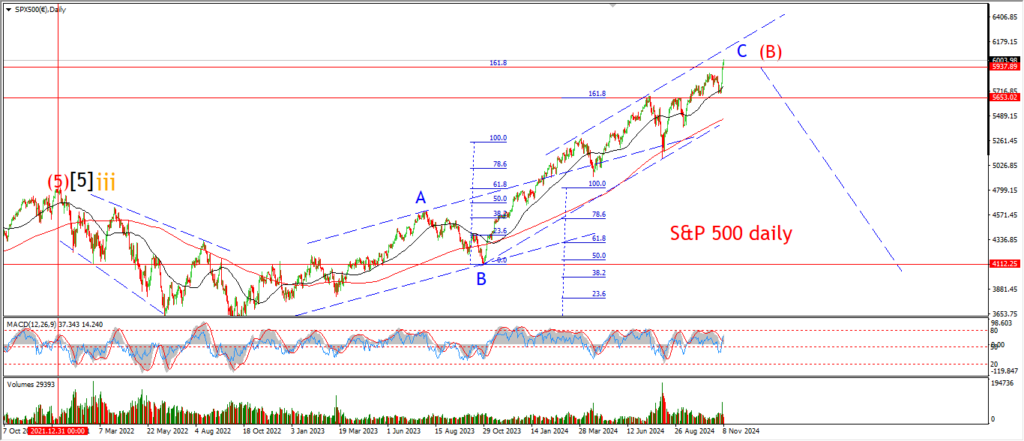
S&P 500 daily.
The S&P has now closed the gap to the upper channel line today after a crazy rally over the last few days.
Turns out economic stagnation is actually more valuable!
who whould have thought.
On the daily chart,
wave ‘C’ of (B) has reached close to the upper trend channel line,
while the price is well extended above the wave (B) channel.
the 4hr chart shows a closing of two channels after this weeks rally.
and the hourly chart is plain to see where we stand.
The trends have all reached a full and complete and over extended extremes again!
So the question remains,
will we see an equal and opposite reaction.
Monday;
Watch for wave (v) to reach its end.
A drop back below the recent low at wave (iv) will call this reversal in play.
SILVER.
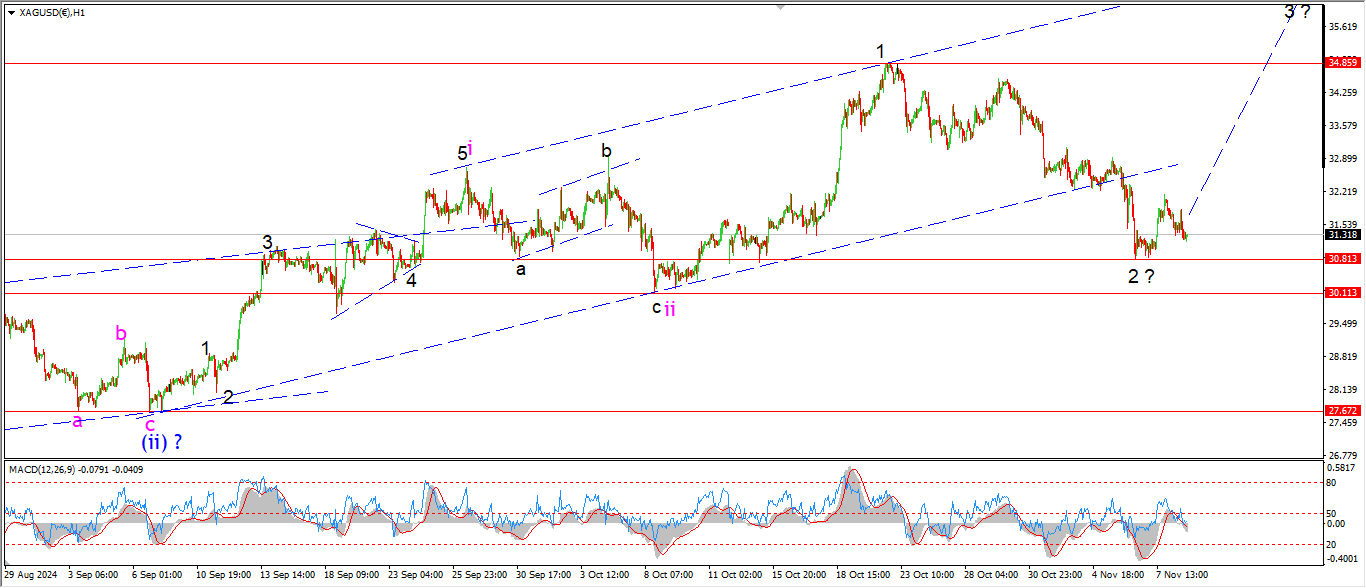
SILVER 1hr
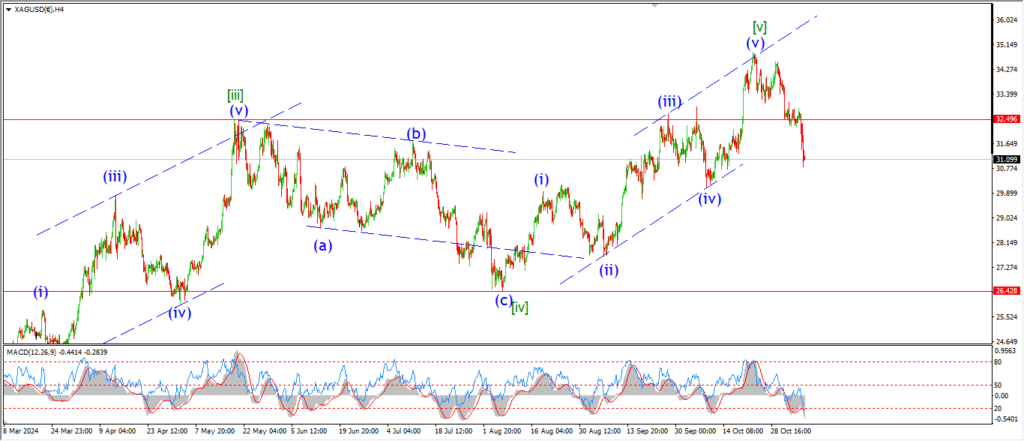
SILVER 4hr.
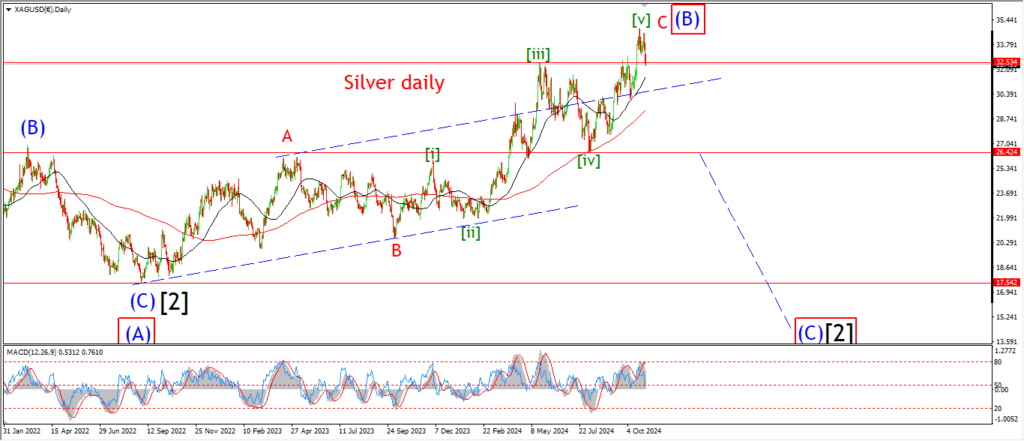
SILVER daily.
The main pattern is holding just about!
I have marked the 30.11 low as a possible end point for the bullish pattern.
So it is imperative that the price hold above that level over the coming week.
The action today is not inspiring thoughts of a third wave rally to be honest,
but I will allow this pattern to continue until we get a break of the wave ‘ii’ low at 30.11.
Monday;
we are too close for comfort here to an invalidation of this pattern.
Wave ‘3’ must turn higher or the alternate count will get a boost.
BITCOIN
BITCOIN 1hr.
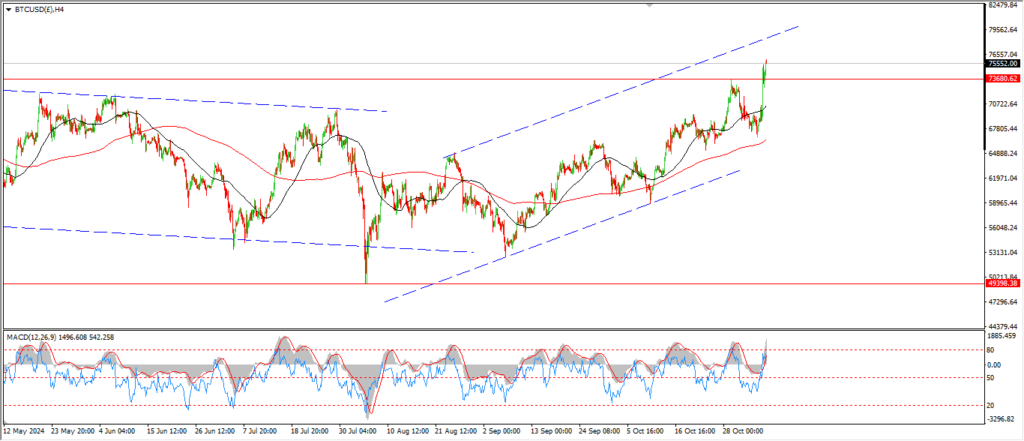
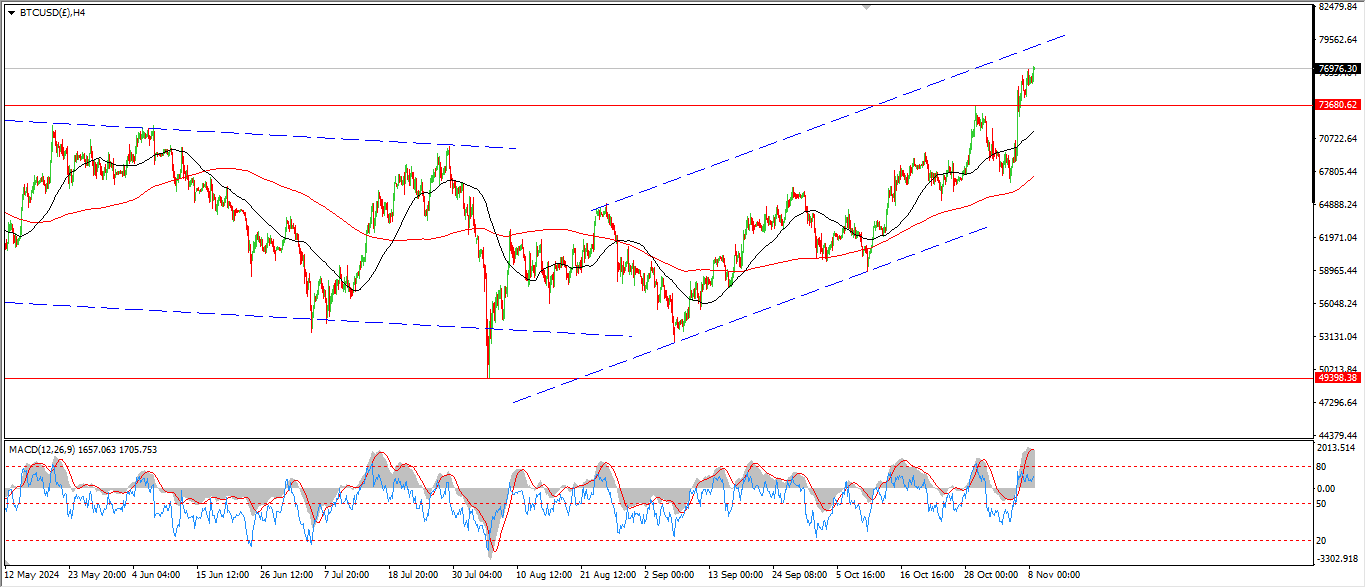
BITCOIN 4hr.
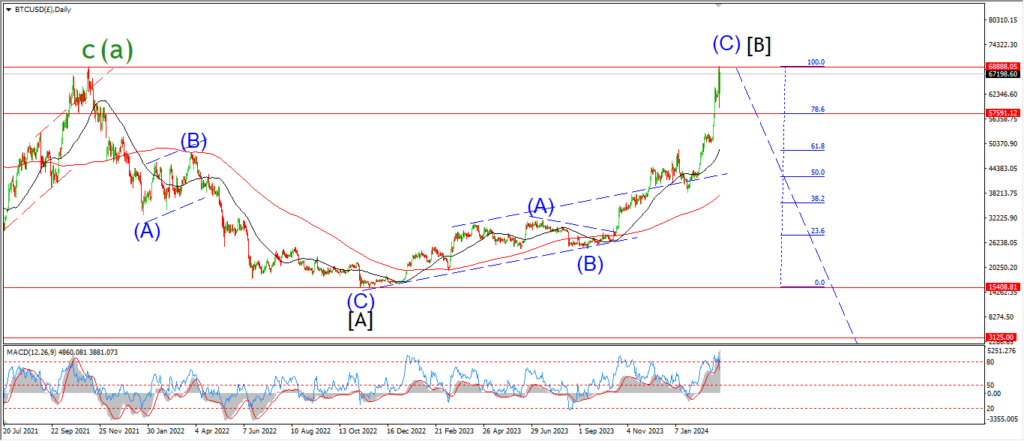
BITCOIN daily.
….
FTSE 100.
FTSE 100 1hr.
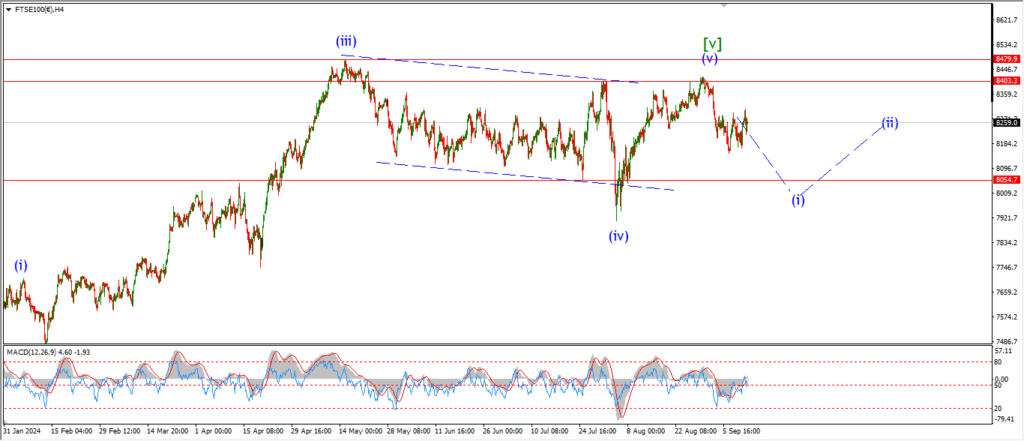
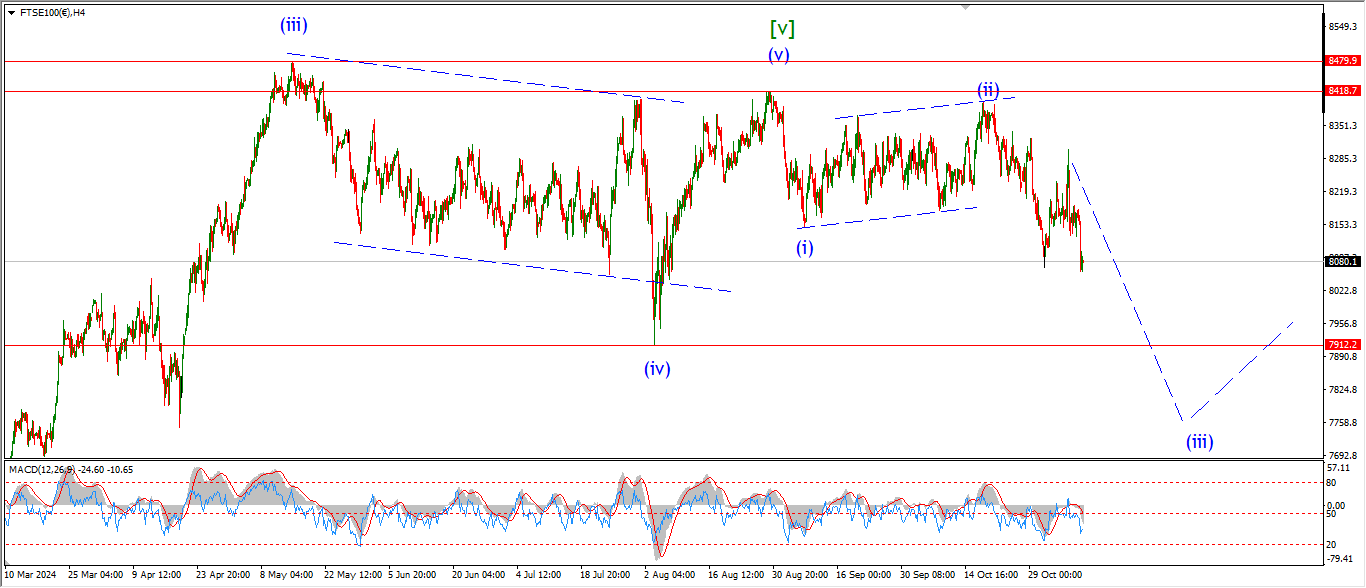
FTSE 100 4hr.

FTSE 100 daily.
….
DAX.
DAX 1hr
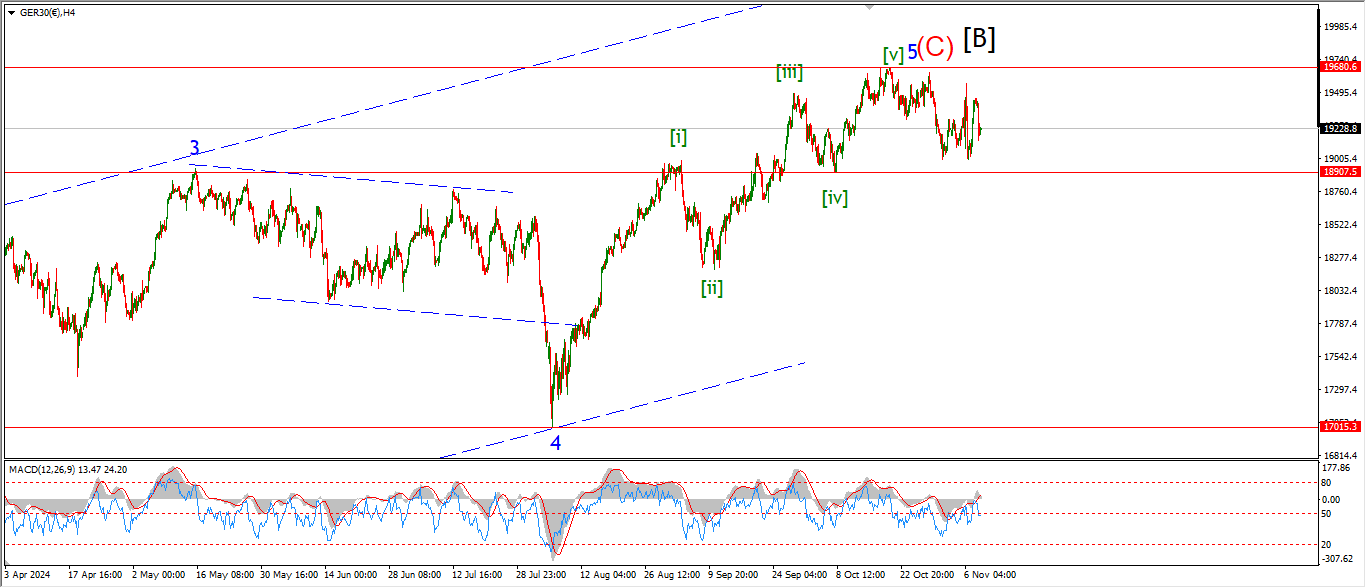
DAX 4hr

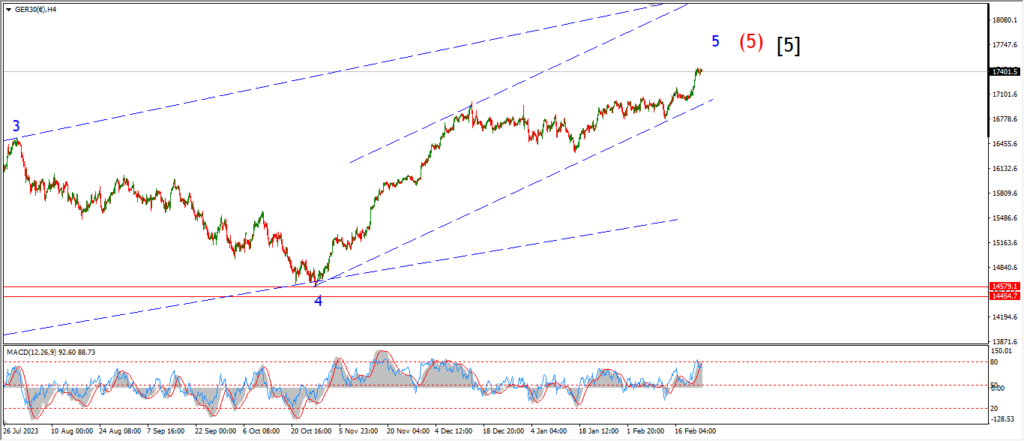
DAX daily.
….
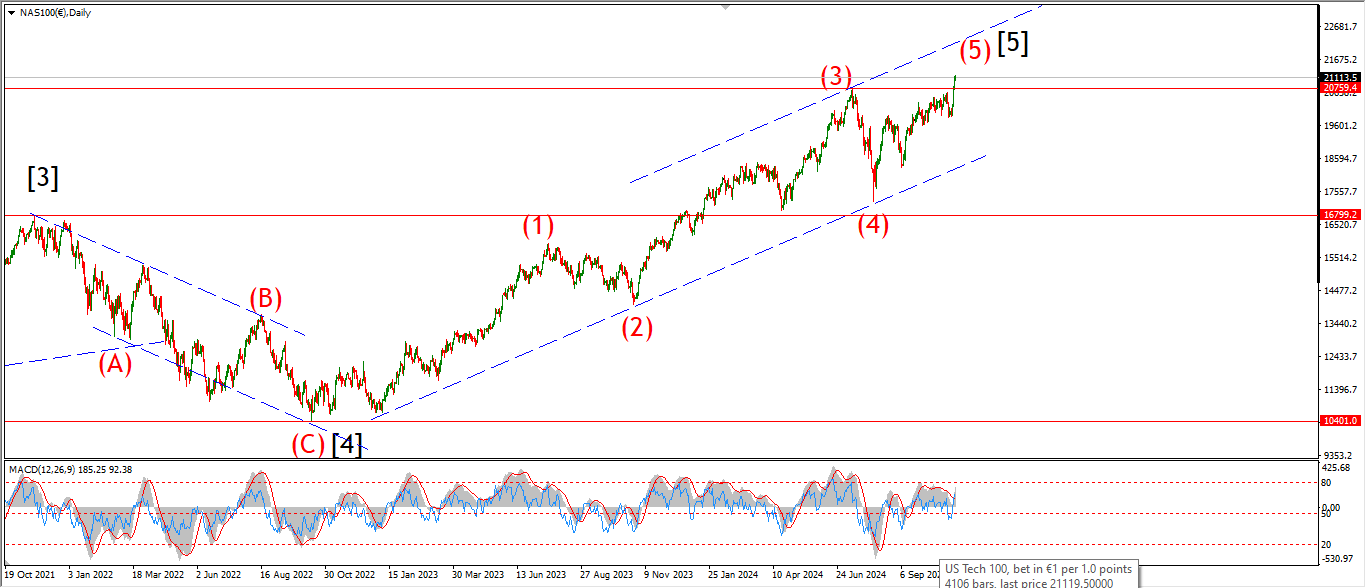
NASDAQ 100.
NASDAQ 1hr
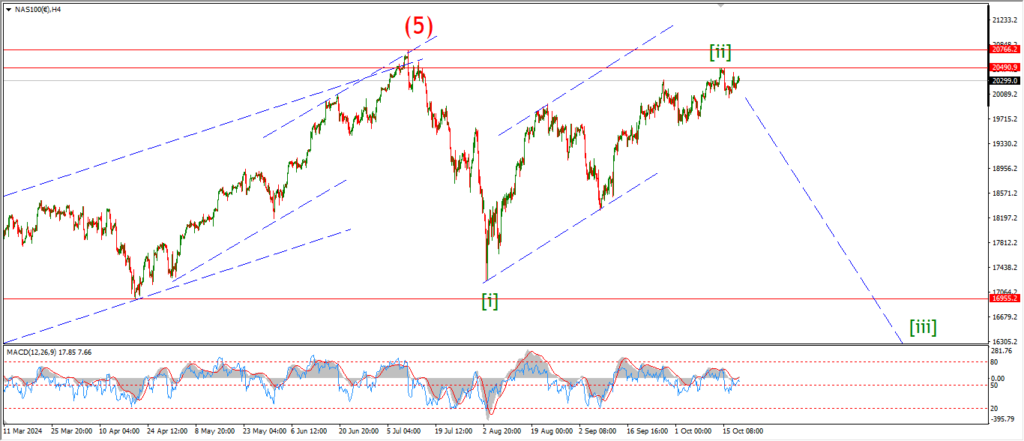
NASDAQ 4hr.
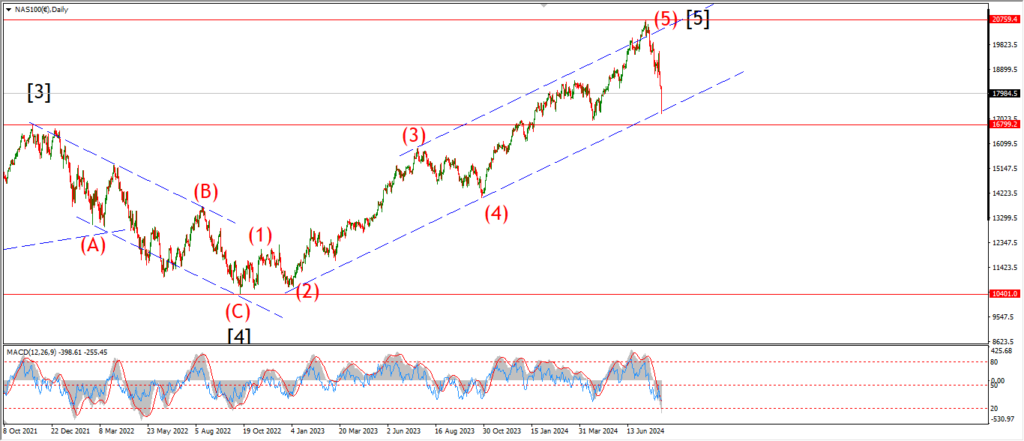
NASDAQ daily.
….