
Good evening folks, the Lord’s Blessings to you all.
Heres some interesting charts and articles from the day.
Bond Bear Market – Is It Dead, Or Just Hibernating?
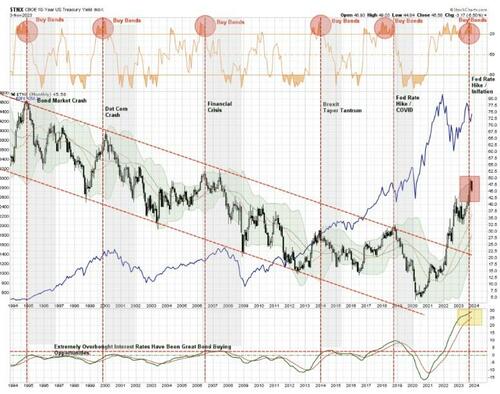
But, if we push our analysis out further, using MONTHLY data, we see the same extreme deviations from the norm. Going back to 1994, whenever rates were highly overbought and deviated from long-term means, such were good buying opportunities for bonds. This time is unlikely to be different, and the failure of Citizens Bank this past weekend is further evidence of the financial strain on the economy.

Today’s ISM showed that a grand total of 11% of industries (2 out of 18) posted any growth in October, the same depressed share as in the spring of 2020 and the fall of 2008. But there’s no recession, right?
https://twitter.com/bullwavesreal
EURUSD.

EURUSD 1hr.
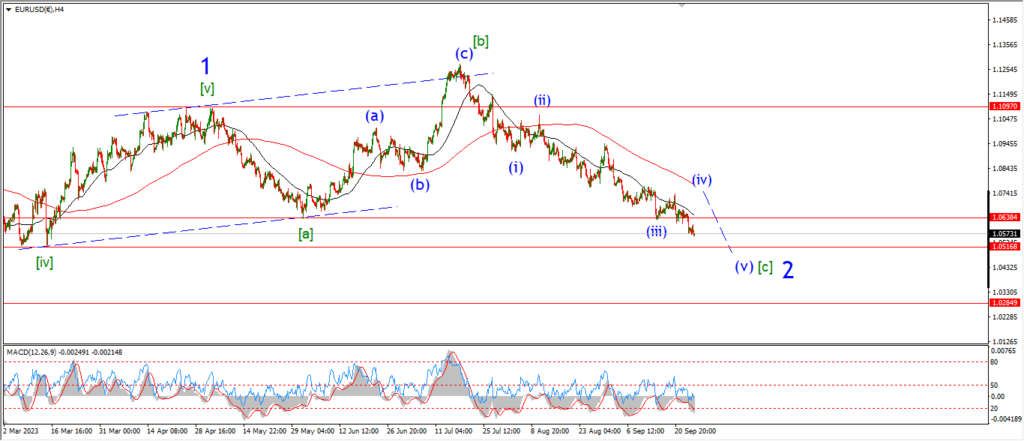
EURUSD 4hr.
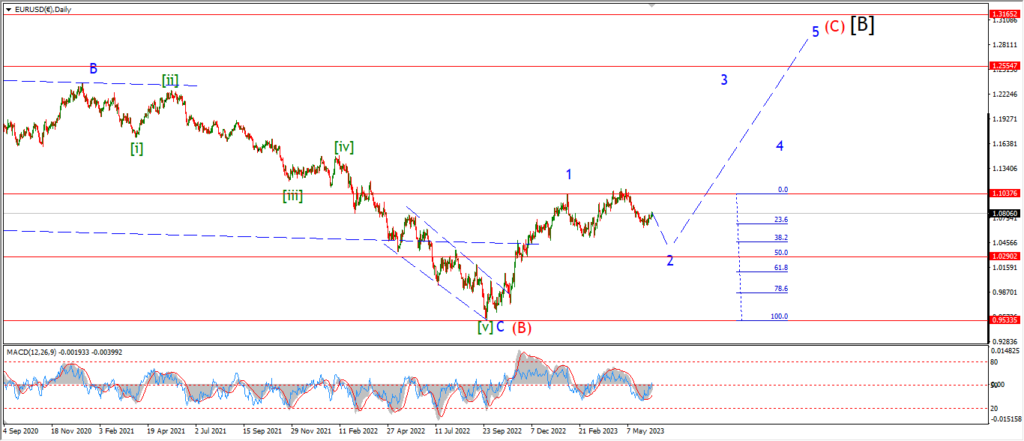
EURUSD daily.
The price fell further off the top of wave (iv) today and the low of the session broke below that wave ‘1’ high from last week.
This action now suggests wave ‘c’ of (iv) is now complete.
and there is a possibility that wave ‘i’ of (v) is now getting started.
Wave ‘1’ and ‘2’ should create that initial lower high as shown.
and then wave ‘3’ of ‘i’ should confirm this move into wave (v) by accelerating lower to hit 1.05167 again.
Tomorrow;
Watch for that wave (iv) high to hold at 1.0755.
Wave ‘2’ should complete below that level.
And wave ‘3’ down is expected to continue the pattern lower towards that target at wave ‘b’ pink.
GBPUSD

GBPUSD 1hr.
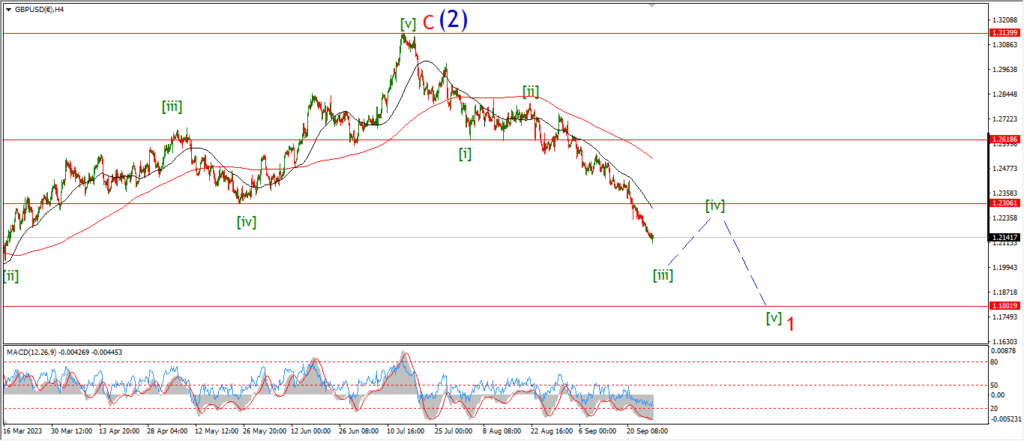
GBPUSD 4hr.
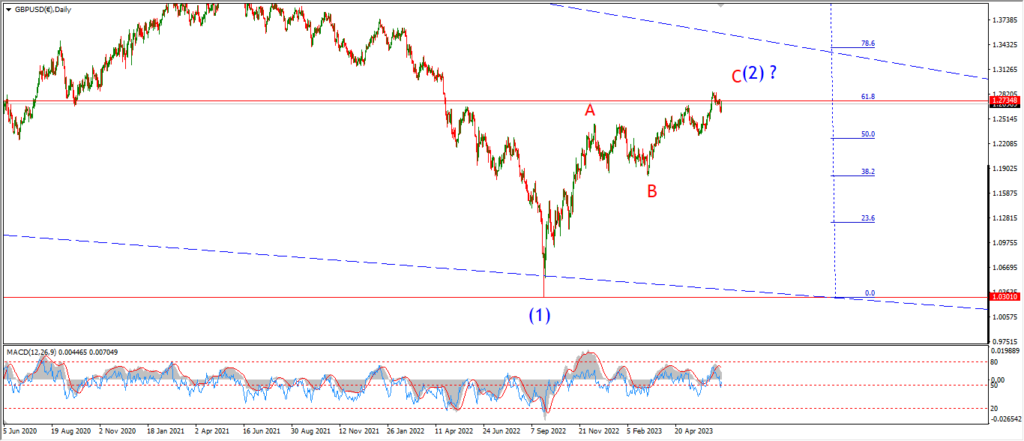
GBPUSD daily.
Cable came down a little harder that EURUSD today but the decline did not break the previkous wave ‘1’ high at 1.2225.
This leaves the option open for a new high to complete wave ‘c’ of (c).
But I have switched to the idea that wave [iv] is compelte now at the recent high,
and wave (i) of [v] is now underway.
Tomorrow;
Much like EURUSD,
the price must now create a bearish lower high at wave ‘ii’ as shown.
and wave ‘iii’ down will prove this wave count by breaking below the wave ‘1’ high at 1.2225 again.
The larger wave [v] green will only be confirmed with a break of the wave [iii] low again.
USDJPY.
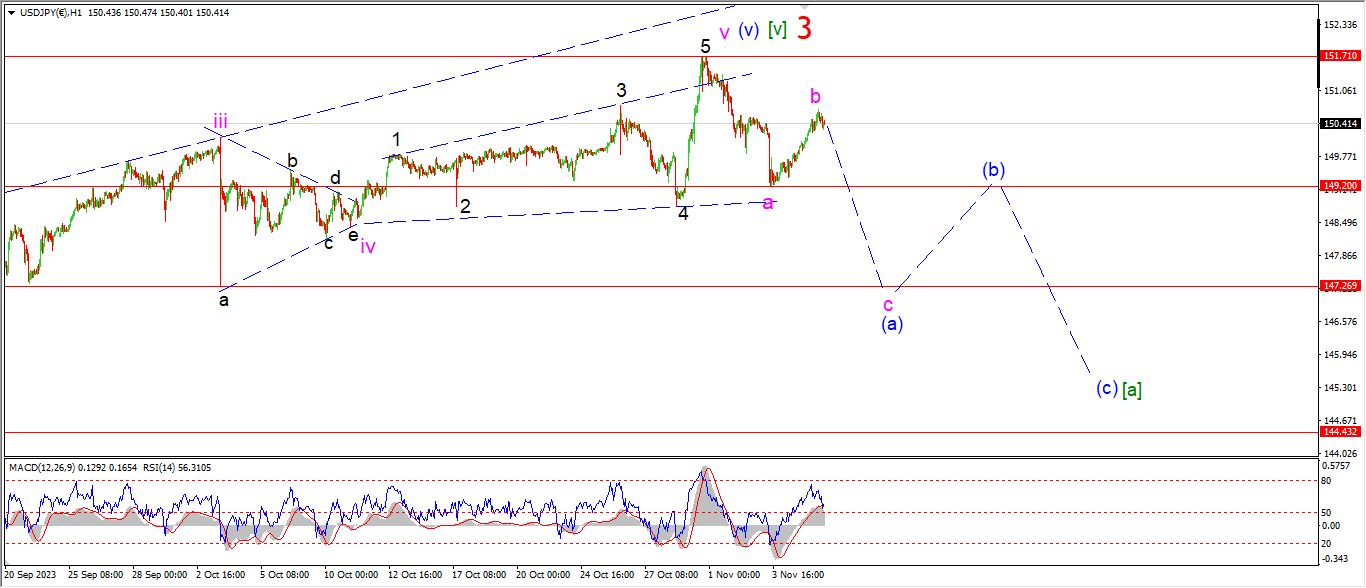
USDJPY 1hr.

USDJPY 4hr.
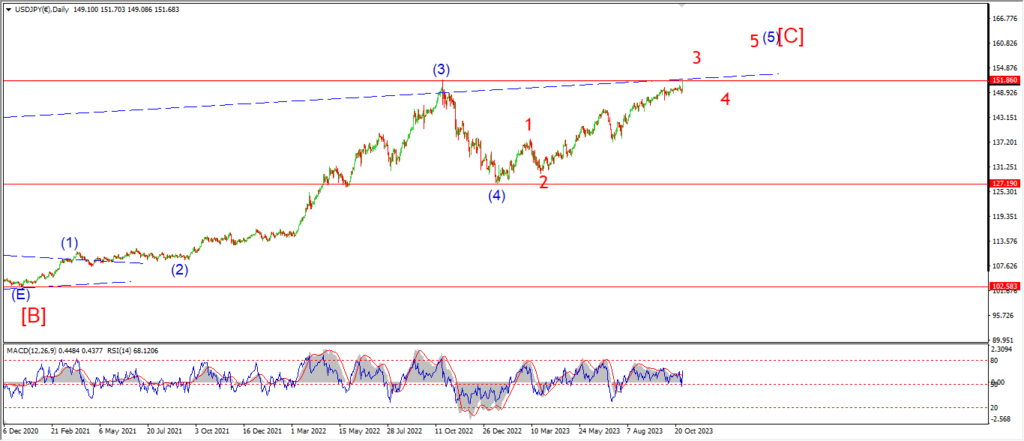
USDJPY daily.
If the other pairs are going to accelerate lower from here,
then this wave count is USDJPY will come under pressure again for sure.
For the moment,
I can continue with the idea that wave ‘3’ has topped out and wave ‘4’ is beginning.
Although it is going to take much more downside action to confirm this count.
The price has created a small lower high this evening at the level I was looking at last night.
The rise today may have completed wave ‘b’ of (a).
and if that is correct,
then wave ‘c’ of (a) should turn lower again next week.
Wave ‘c’ is expected to break the wave ‘a’ low at a minimum.
but I would prefer to see a low in wave ‘c’ near the 148.00 level again.
Tomorrow;
WAtch for wave ‘b’ to hold below that recent high at 151.70.
Wave ‘c’ should begin by tomorrow evening and fall below 149.20 at a minimum.
DOW JONES.
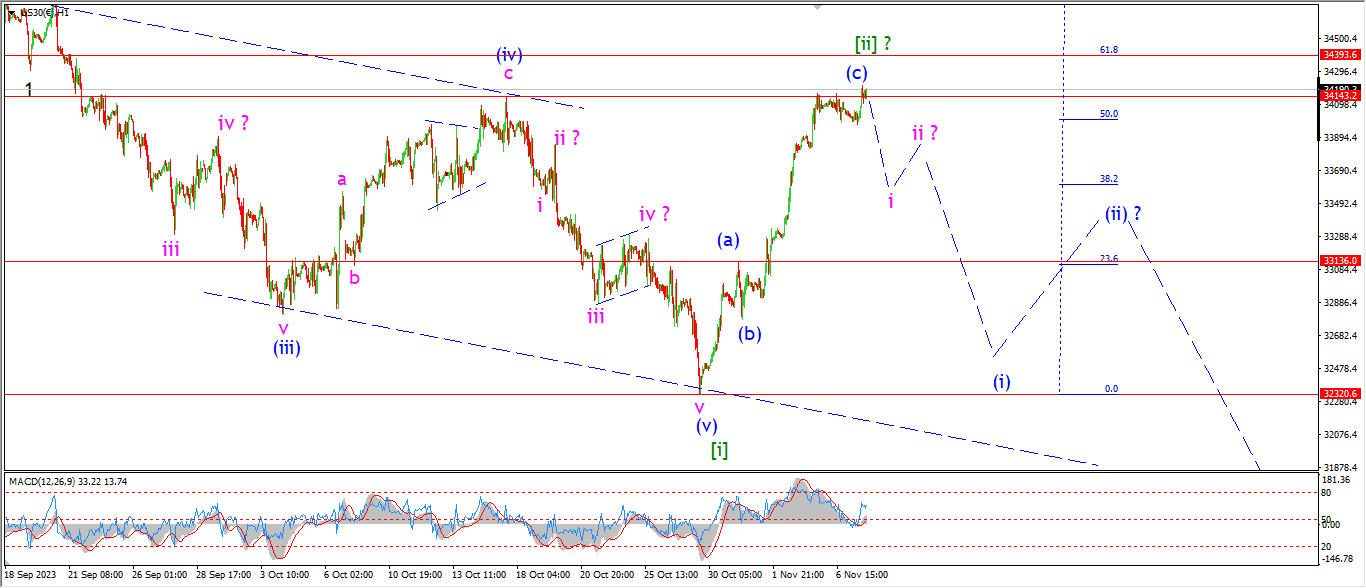
DOW 1hr.

DOW 4hr
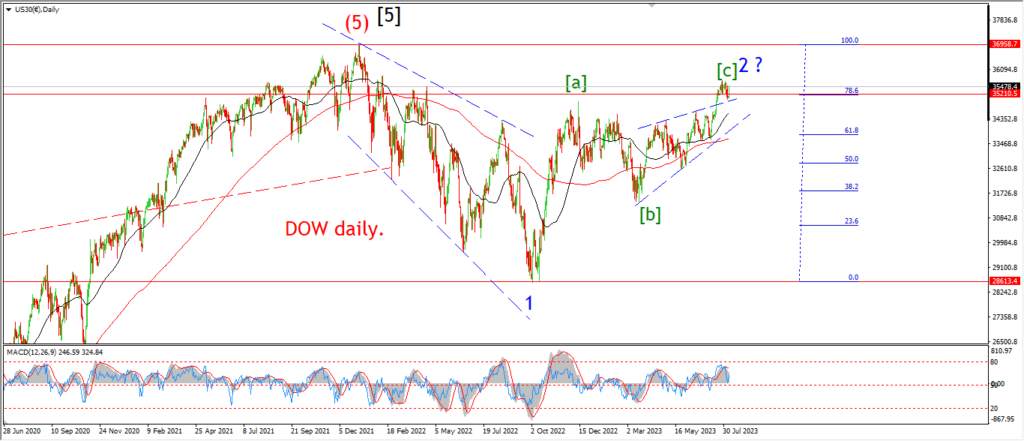
DOW daily.
The DOW is holding at the highs again toay and the market did manage a small pop to a very slight new high for the rally.
The market is holding at the previous wave (iv) level again this evening,
so that level is proving to be a reasonable resistance to any further rally in wave [ii].
The market must begin a turn lower again into wave (i) before the end of this week in order to stick with this main bearish wave count,
but I do think the action is very weak now,
and last weeks rally may be even more than the market can handle now.
It does seem that the Treasury market is set to reverse now and begin a longer term rally as I showed in the charts above.
If that happens,
then I suspect the risk on rally is doomed here.
that should coincide with a return lower in the stock market.
And maybe wave [iii] of ‘3’ will be back on the table again.
For the moment I am just waiting to see if a reversal can begin wave ‘i’ of (i) of [iii] this week.
Tomorrow;
Watch for wave ‘i’ of (i) to begin with a spike lower off the top and then a lower high wave ‘ii’ by the end of the week.
GOLD

GOLD 1hr.

GOLD 4hr.
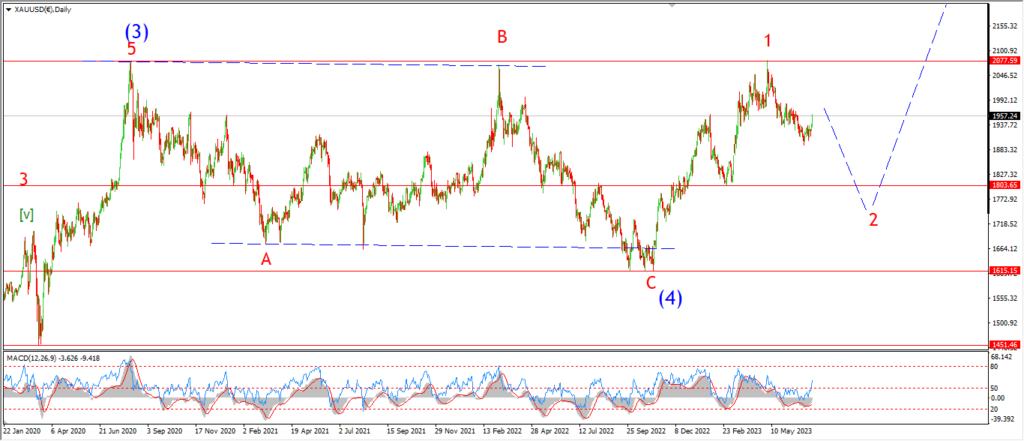
GOLD daily.
Three waves down are now in place off the top of wave [i] top.
That action has compelted the minimum expected wave (a) of [ii] in my view.
But that does not rule out any more downside in wave (a).
We will know early tomorrow if wave ‘c’ will create an extension lower in the pattern.
The lower that wave (a) achieves,
the more room it creates for wave (b) to correct higher again.
Tomorrow;
Watch for wave (b) to begin a three wave rise back towards the 1990 area again over the next few sessions.
A break below 1950 again will signal that wave ‘c’ of (a) is still in play.
CRUDE OIL.

CRUDE OIL 1hr.
CRUDE OIL 4hr.
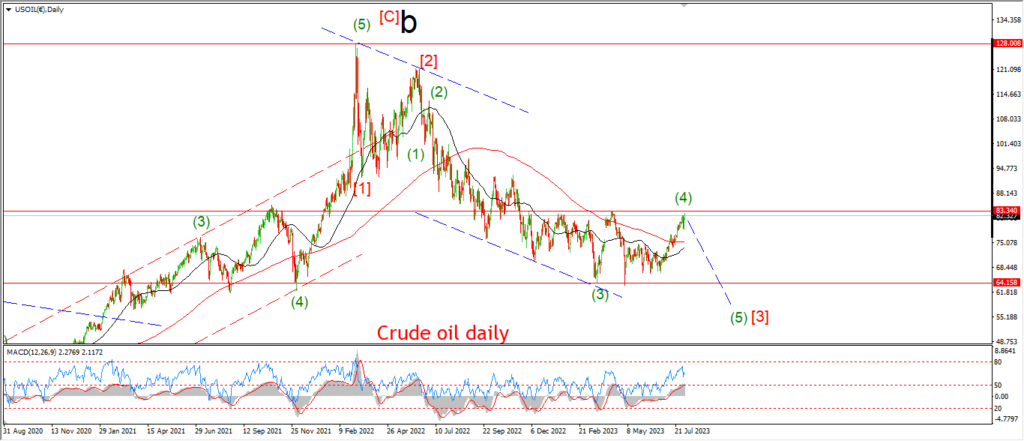
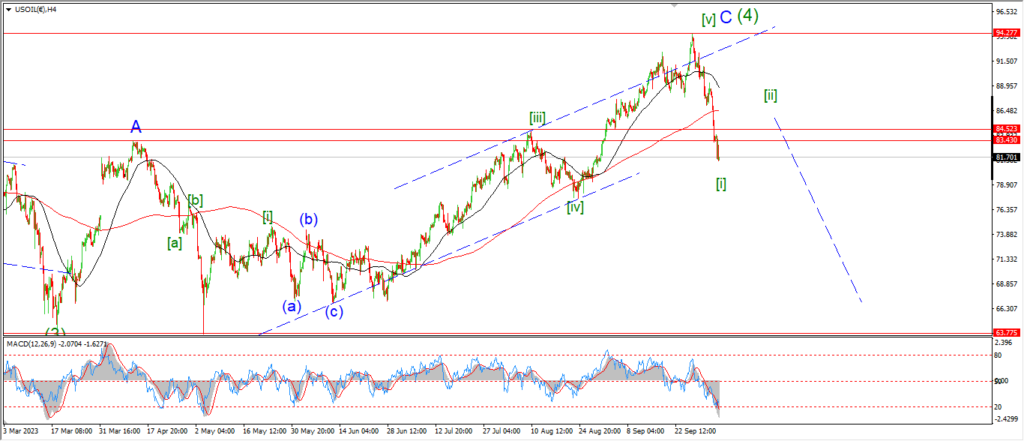
CRUDE OIL daily.
What happened to that great crude oil rally eh!
The price continued lower today and the action has accelerated as the wave count suggested.
This pattern does now look like wave ‘iii’ of (iii).
And the low of the session this evening has broken below the minimum target for wave (iii) blue.
That minimum target lay at 77.88 where wave (i) and (iii) reached equality.
Wave (iii) is not yet complete here,
but we can concentrate on the internal pattern for wave (iii) to give us a better idea of the actual next target low for wave (iii).
Wave ‘iii’ pink should trace out an internal pattern of five waves down as shown.
That will leave another correction and decline to complete wave (iii) of [iii] over the next week or so.
Tomorrow;
Watch for wave ‘iii’ down to complete as shown with a fourth and fifth wave.
The price must hold below 79.95 for this pattern to remain valid here.
so there is a tight margin for error here also.
S&P 500.
S&P 500 1hr
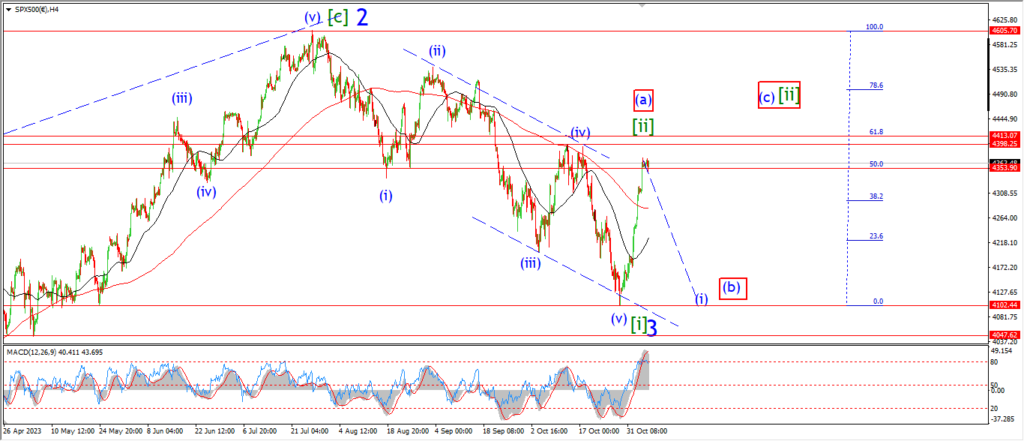
S&P 500 4hr
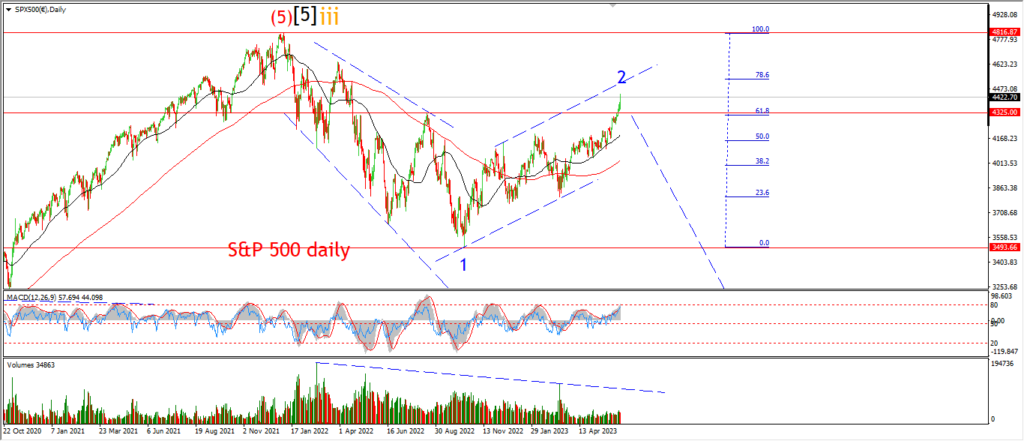
S&P 500 daily.
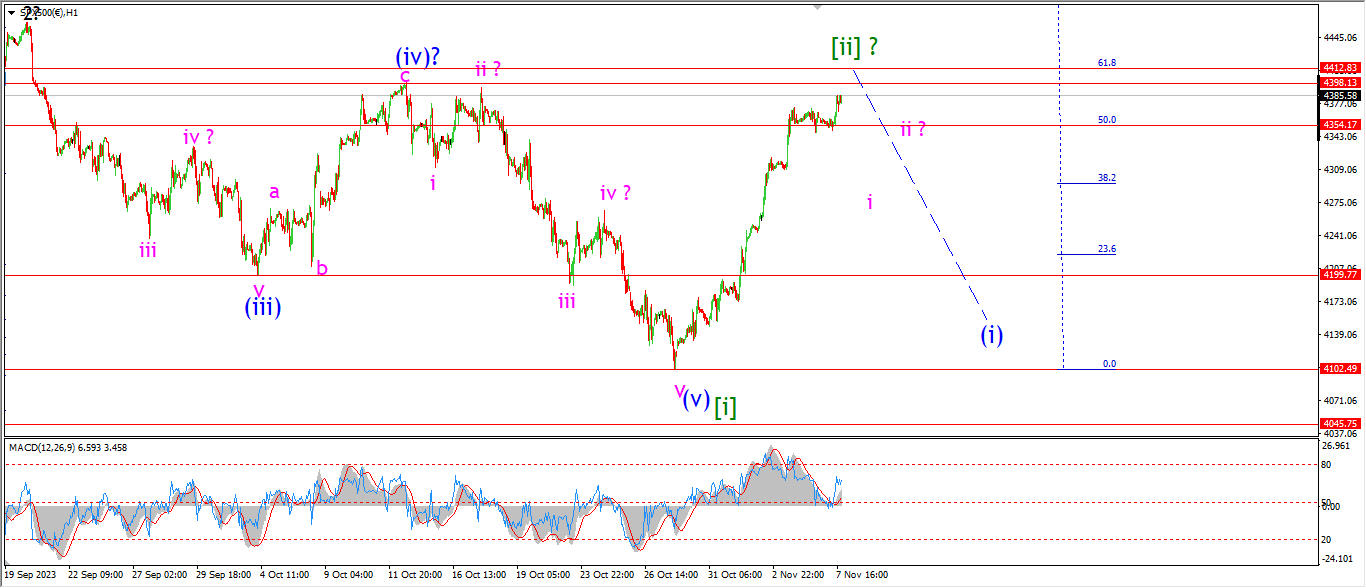
There is very little to write about in the stock markets tonight.
The main comment that I have is the fact that the rally has halted completely this week.
It does suggest a very temporary nature to that rally.
At the very least it suggests that no-one actually even believes in the gains made last week.
Even so,
the market is sitting at the highs this evening after a very small gain today.
The price is actually stiuck in the range between the 50% and 62% retracement levels now.
The previous wave (iv) high is the next common target level for this second wave to hit.
And we are right there also.
AS I said last night,
all the common retracements for a second wave have already been met.
so I will continue to look for a possible high in wave [ii] over the next few sessions.
And after that we should see an impulsive decline come in wave (i) of [iii].
Tomorrow;
Watch for a signal that the price action is reversing into wave ‘i’ of (i) of [iii].
SILVER.

SILVER 1hr
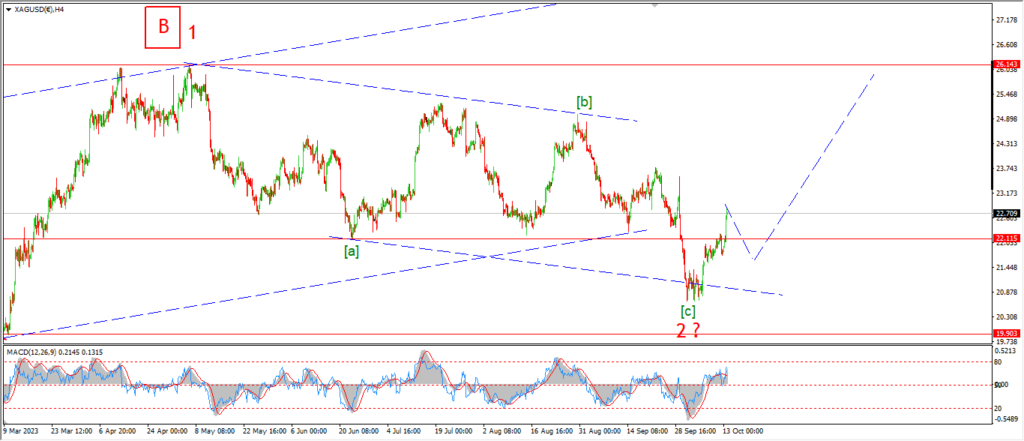
SILVER 4hr.
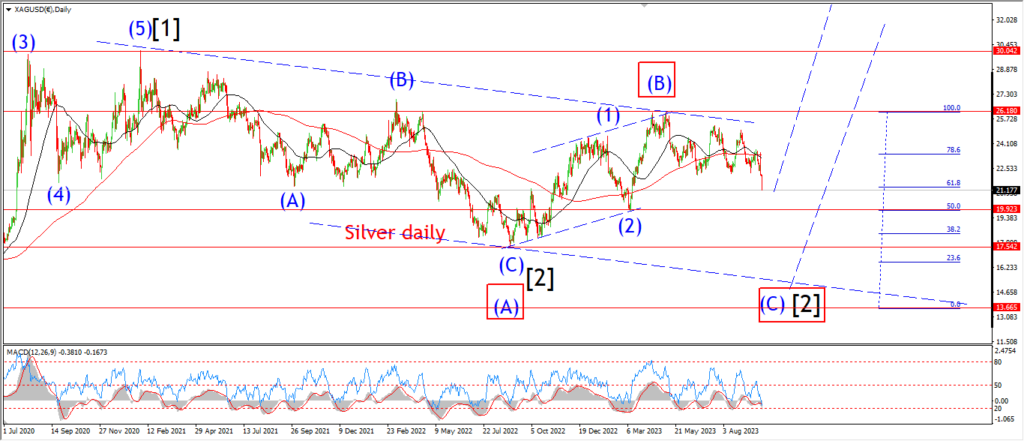
SILVER daily.
Silver turned lower in a pretty convincing manner today and that decline has invalidated the wave ‘b’ triangle that I was suggesting.
I have returned to the idea that wave ‘b’ is complete at the recent lower high.
and wave ‘c’ is now underway as a five wave pattern lower again.
If this pattern is correct,
then wave ‘3’ of ‘c’ should now be underway after todays declines.
In an ideal pattern,
wave ‘3’ should fall into the lower trend channel line at about 22.12.
Wave ‘c’ should trace out a full five wave pattern and complete near the 21.80 level at the 62% retracement level.
If all goes well,
then we will see a completed wave (ii) correction by the end of this week.
Tomorrow;
Watch for wave ‘3’ of ‘c’ to fall into the lower trend channel line at 22.12.
The wave ‘1’ low at 22.53 should act as resistance to any rally in wave ‘4’ of ‘c’.
BITCOIN
BITCOIN 1hr.
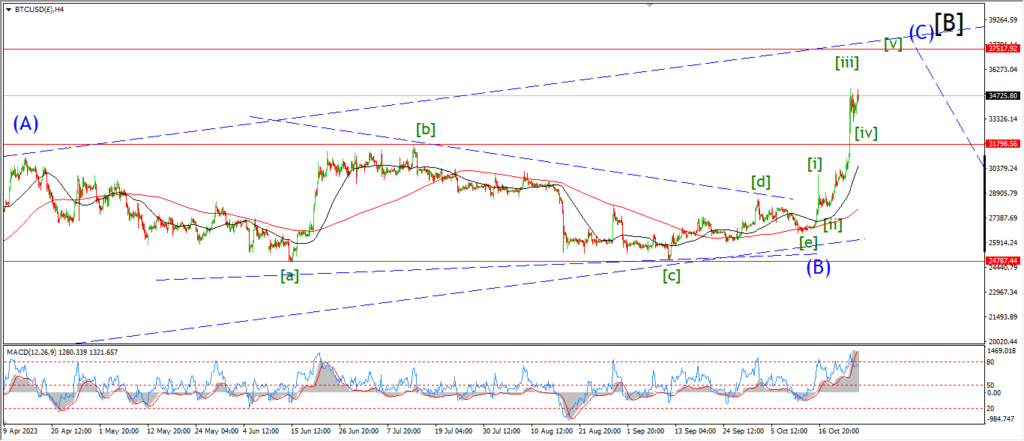
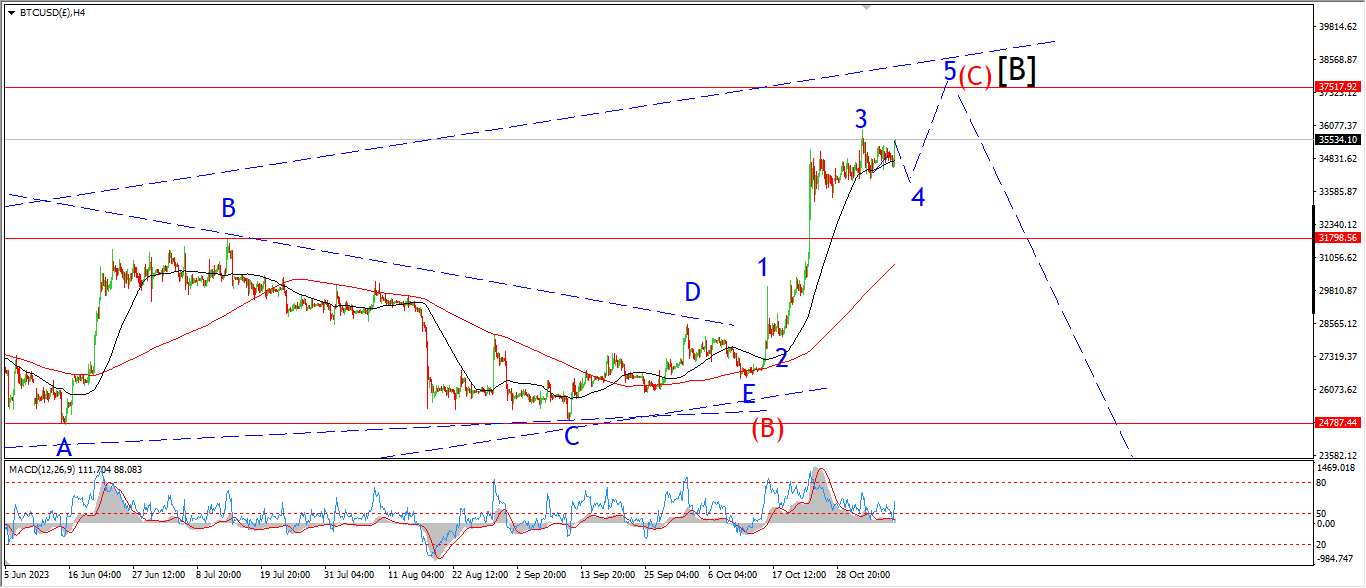
BITCOIN 4hr.
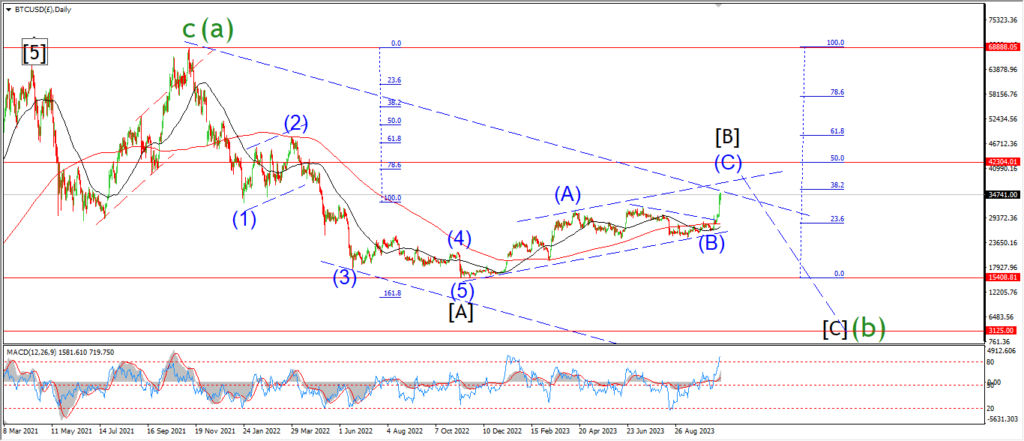
BITCOIN daily.
….
FTSE 100.
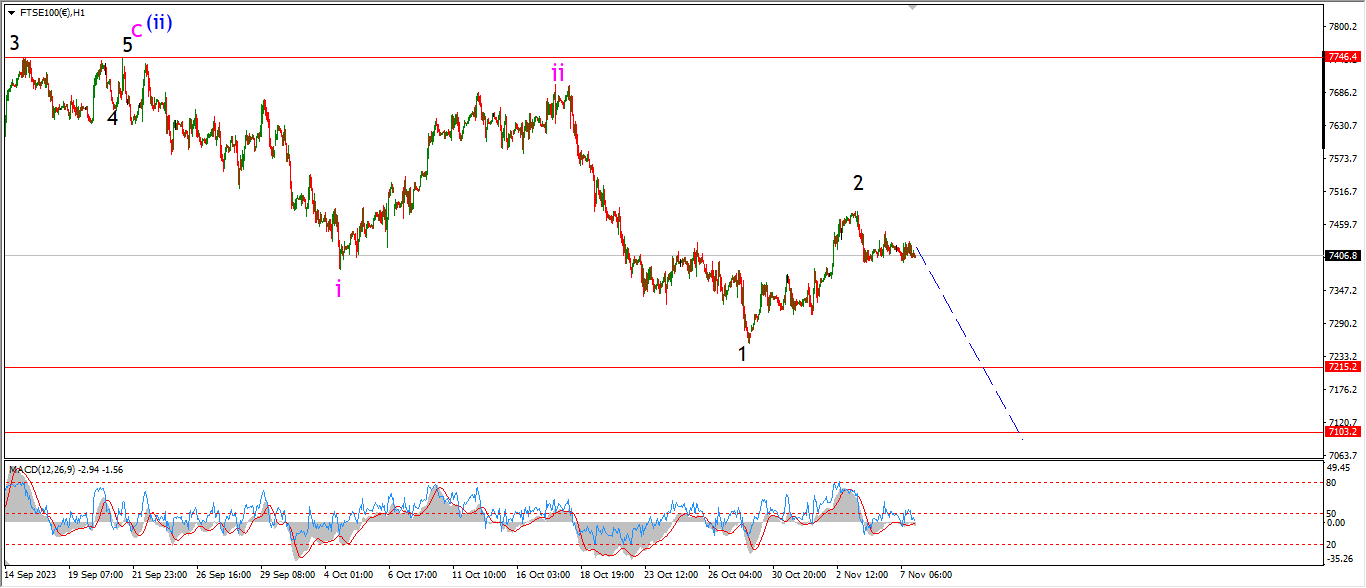
FTSE 100 1hr.
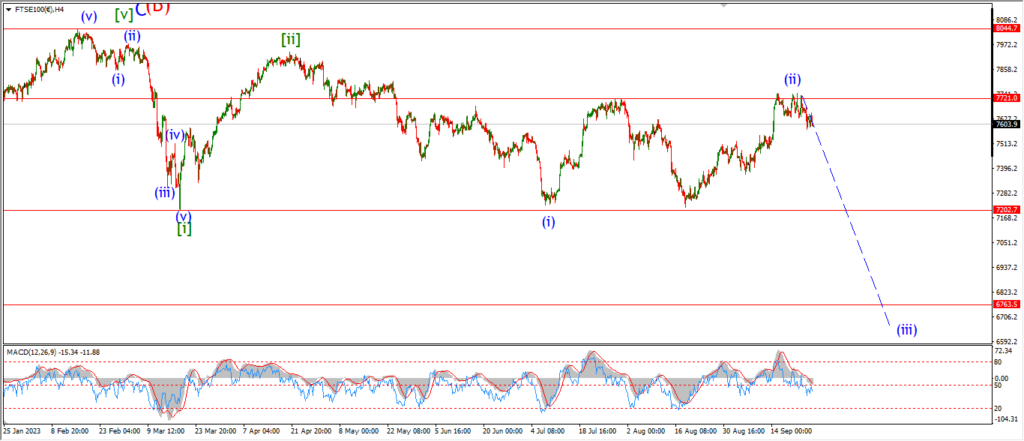
FTSE 100 4hr.

FTSE 100 daily.
….
DAX.
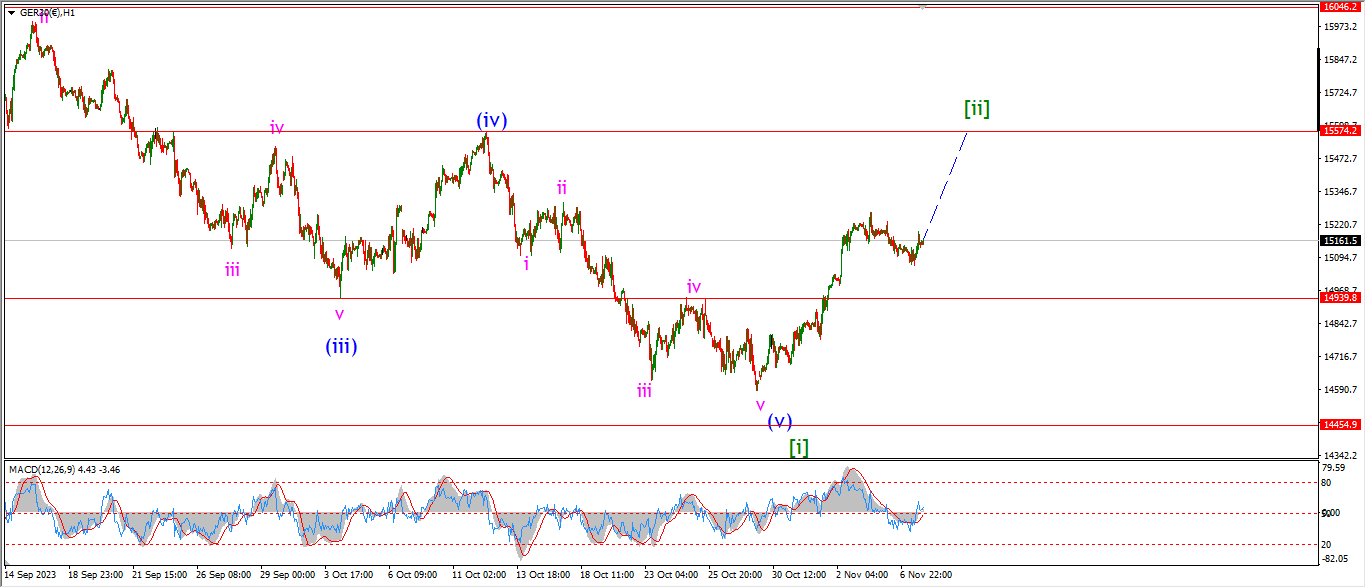
DAX 1hr
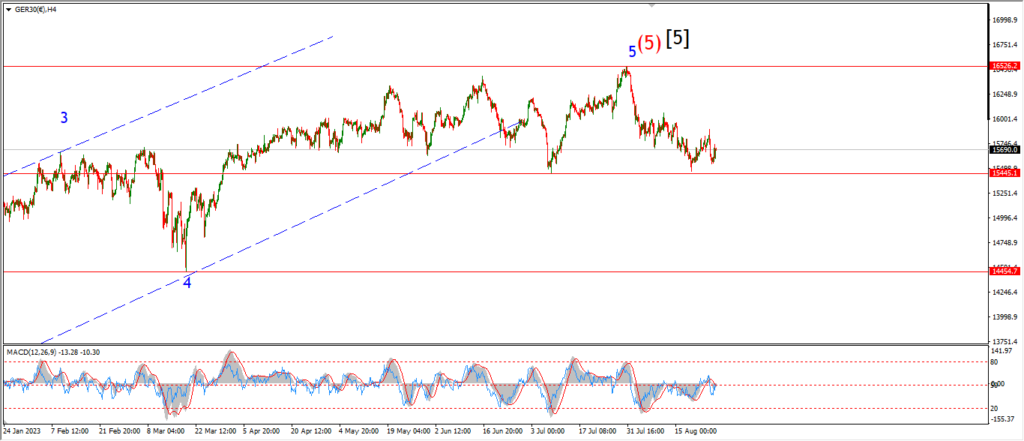
DAX 4hr

DAX daily.
….
NASDAQ 100.
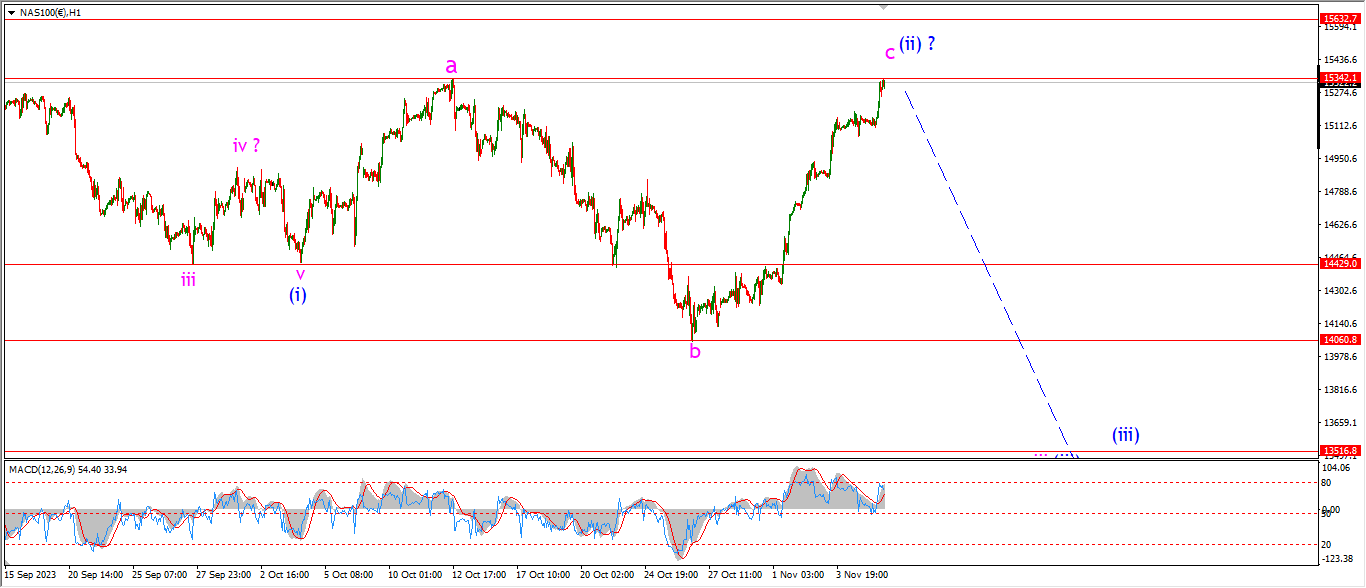
NASDAQ 1hr
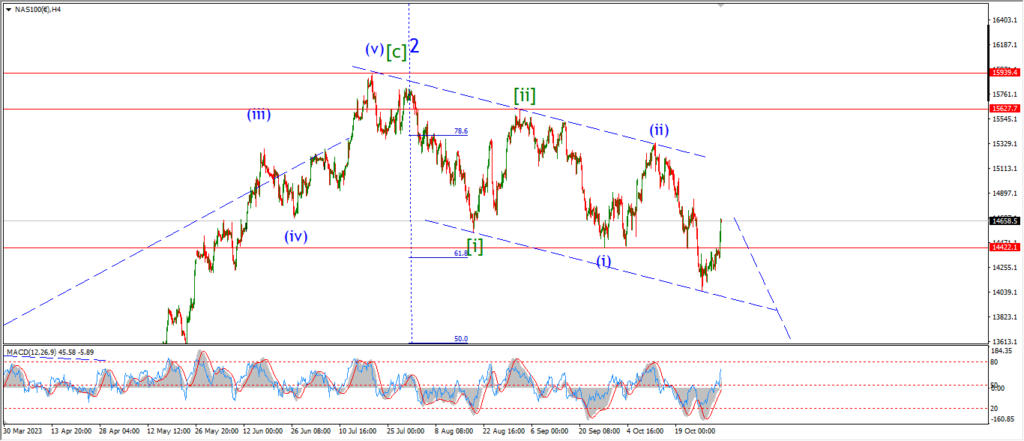
NASDAQ 4hr.
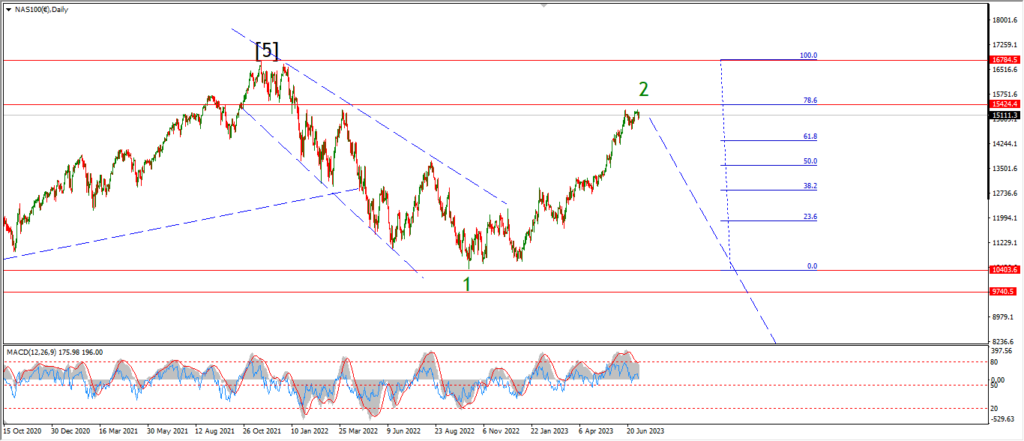
NASDAQ daily.
….