
Good evening folks, the Lord’s Blessings to you all.
https://twitter.com/bullwavesreal
EURUSD.
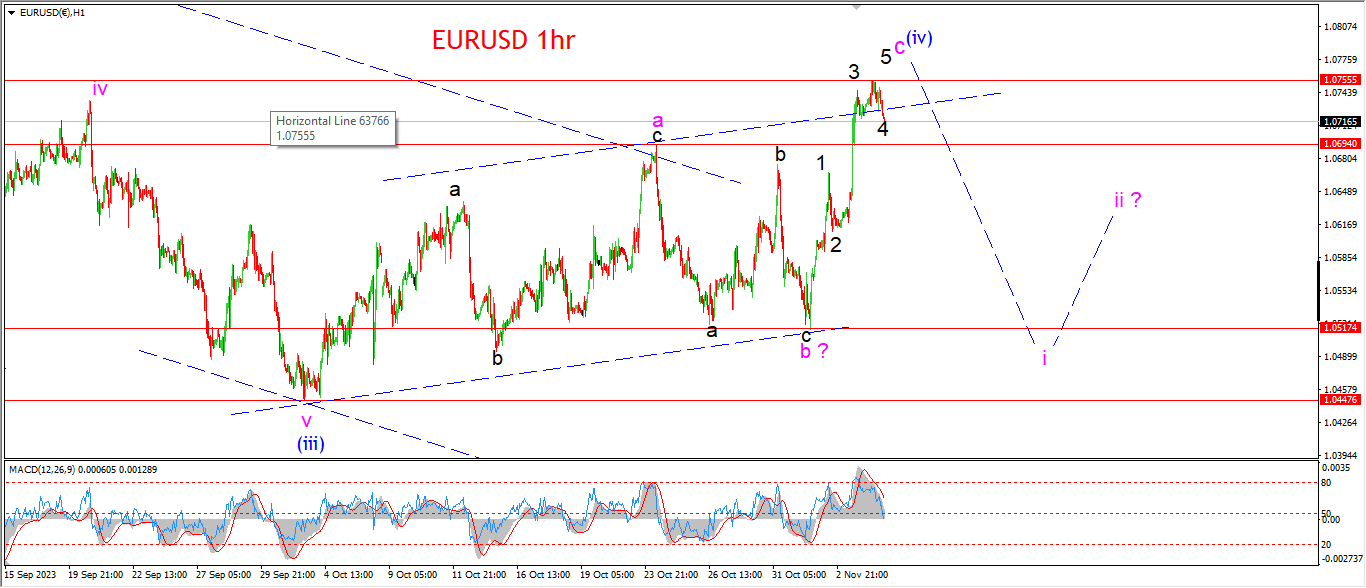
EURUSD 1hr.
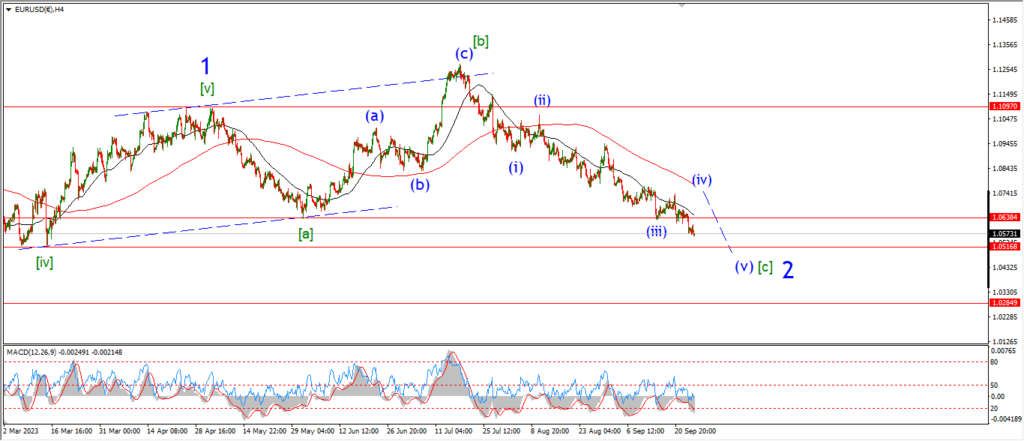
EURUSD 4hr.
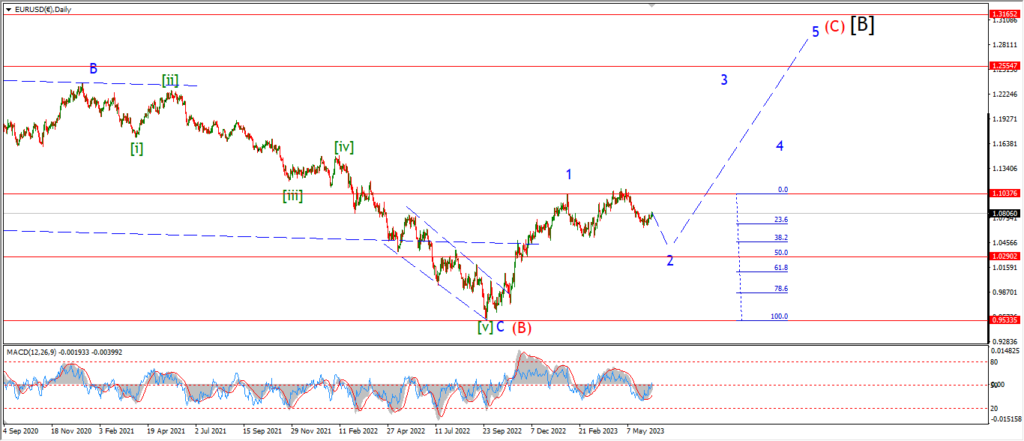
EURUSD daily.
EURUSD has been quiet today and the price continues to hold near the top of the pattern from last week.
The action today is shown as a small correction in wave ‘4’ of the larger wave ‘c’.
Wave ‘c’ should complete with a final pop in a fifth wave and then reverse in an impulsive manner into wave ‘i’ of (v) later int he week.
The price has already broken above the upper trend channel line in wave ‘c’,
that means the throw over is in place for wave ‘c’ of (iv).
The previous wave ‘iv’ high has been hit also.
so I don’t expect much more upside to complete wave ‘c’.
Tomorrow;
watch for wave ‘5’ of ‘c’ of (iv) to complete with a break of 1.0755.
Wave ‘i’ of (v) should then turn lower again.
GBPUSD

GBPUSD 1hr.
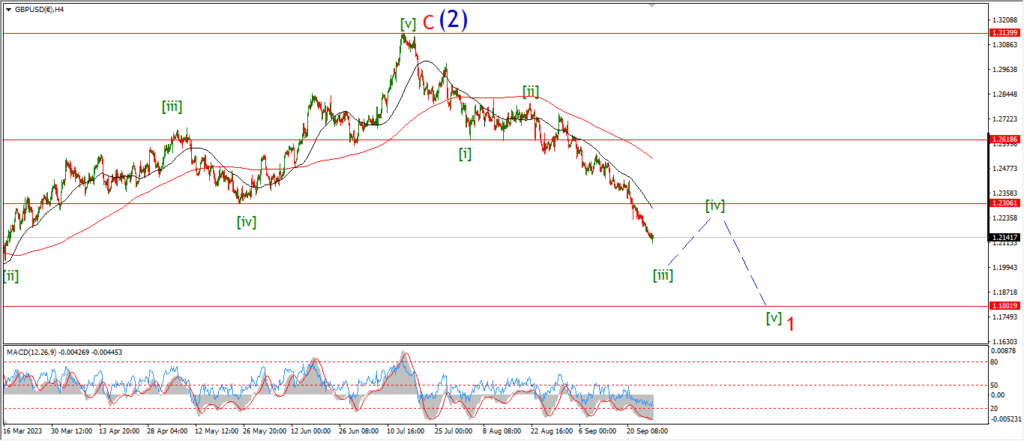
GBPUSD 4hr.
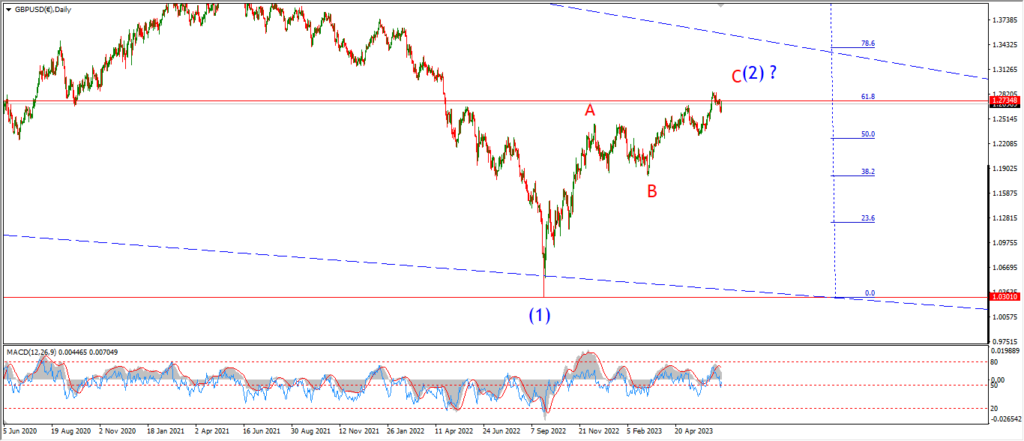
GBPUSD daily.
There is a similar outlook for cable tonight also,
although I must admit that the decline off the high is looking a little more impulsive than corrective at the moment.
If the main count is correct,
then wave ‘c’ of (c) of [iv] will complete with another pop above 1.2427 again.
that will complete five waves up in wave ‘c’,
and then Wave (i) of [v] should turn lower off that level again.
Tomorrow;
If the price falls below that 1.2200 handle again at wave ‘a’ of (c),
that will suggest the correction in wave [iv] is over and wave (i) of [v] is underway again.
Watch for a final fifth wave to complete wave ‘c’ of [iv] and then wave (i) should begin from there.
USDJPY.
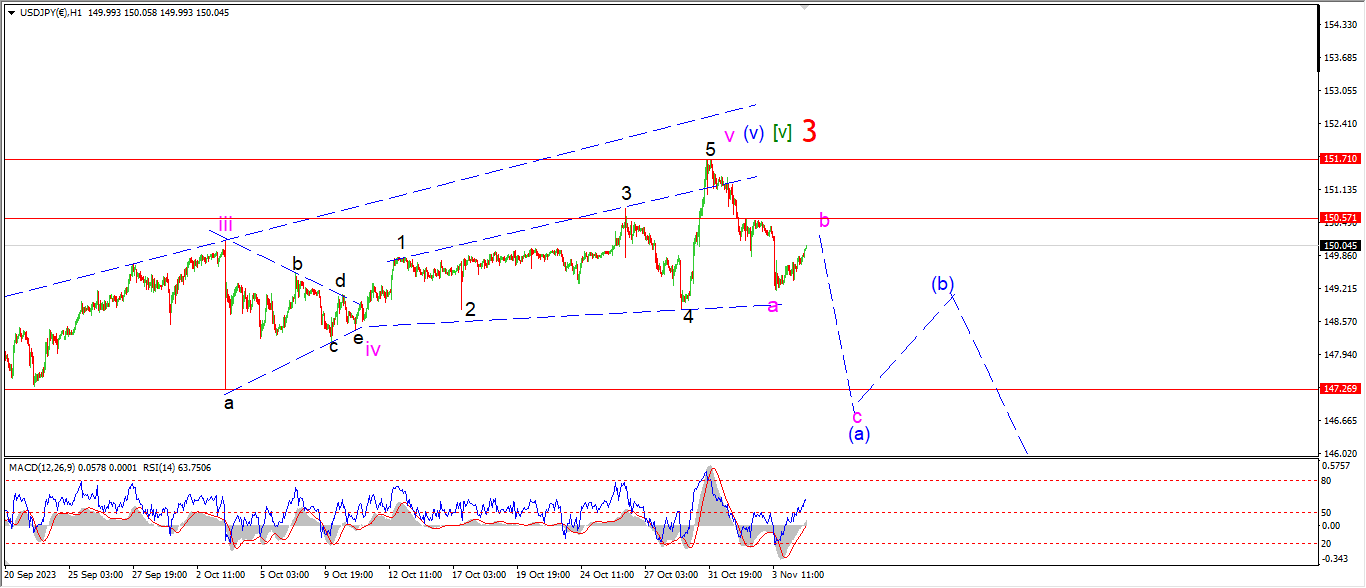
USDJPY 1hr.

USDJPY 4hr.
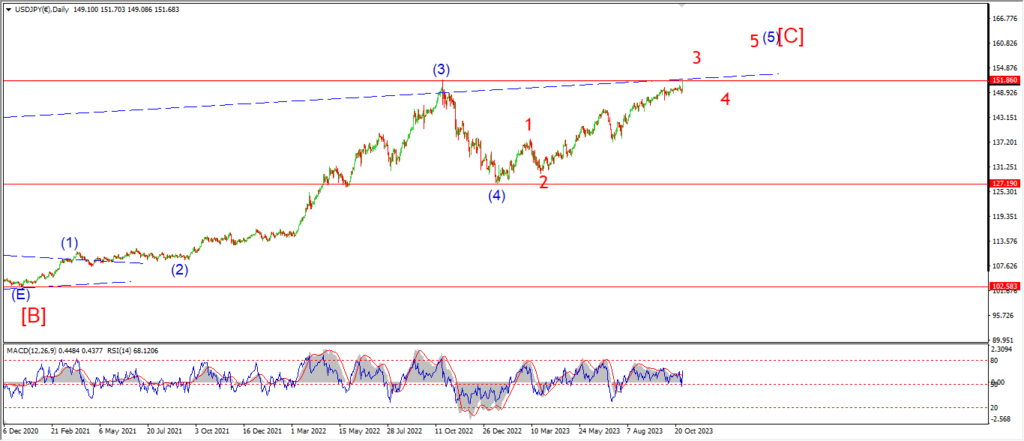
USDJPY daily.
A small bounce today is labelled as wave ‘b’ of (a) at the moment.
Wave ‘b’ is a little too small yet to be complete,
I am suggesting a rise into 150.57 again to complete wave ‘b’.
then wave ‘c’ will turn lower again to complete three waves down in wave (a) later in the week.
The previous spike low from last month lies at 147.27,
and I would like to see a break of that level to complete wave (a).
Tomorrow;
Watch for wave (a) to complete three waves down by late Wednesday,
Wave ‘b’ should top aout and reverse by tomorrow evening as suggested.
DOW JONES.
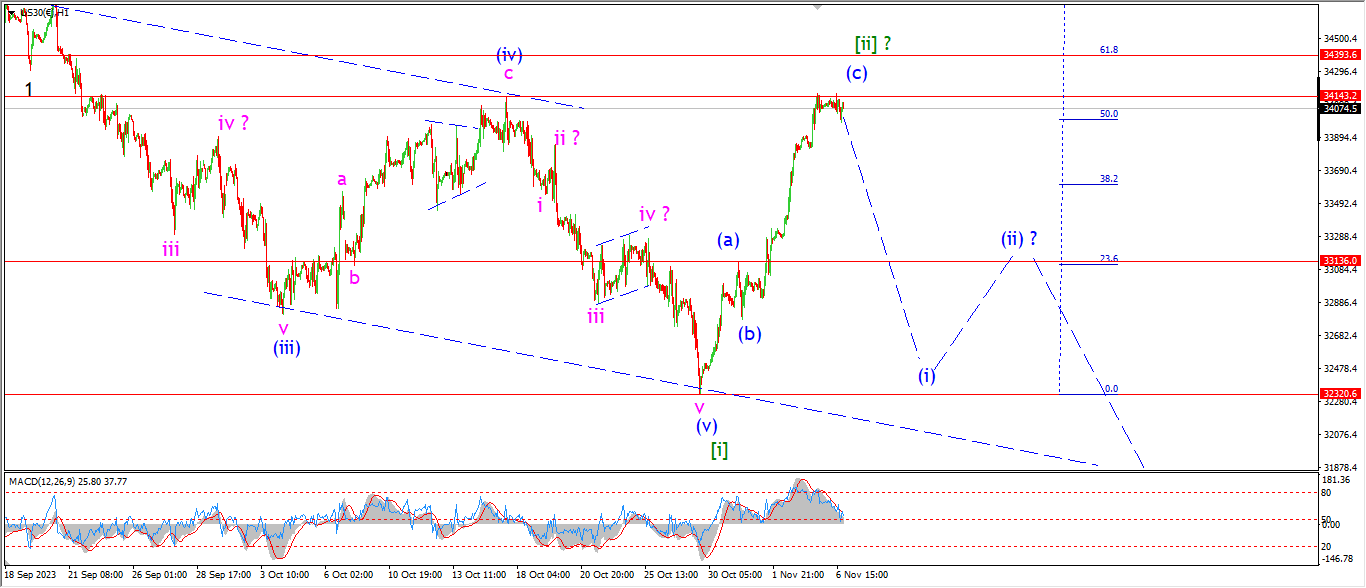
DOW 1hr.

DOW 4hr
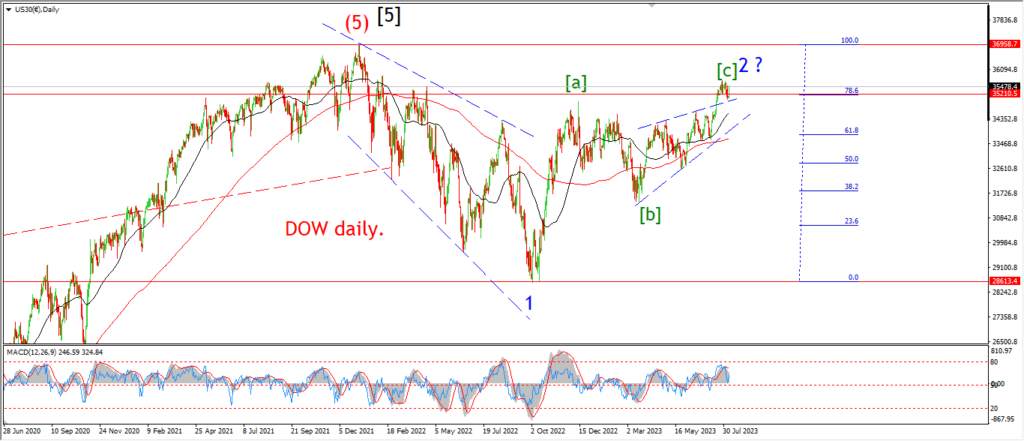
DOW daily.
The market has basically done nothing today almost as if there was a public holiday today,
but as far as I know the market is open,
and yet the range of todays trade was less than 0.5%.
It looks like the rapid rise from later last week has lost its steam.
If this is wave (c) of [ii] that would explain the momentum decline alright.
Also,
the market has now hit the previous fourth wave high at wave (iv) of [i].
And we have broken above the 50% retracement level of the previous decline.
All these points together suggest that this retracement is close to done now.
So I will be looking lower this week for wave (i) of [iii] to begin.
Tomorrow;
Watch for wave (c) to top out very son.
There may be one final pop tomorrow to hit the 62% retracement level at 34390 again,
we will see.
A break below 33130 again at wave (a) will signal the turn into wave (i) is underway.
GOLD

GOLD 1hr.

GOLD 4hr.
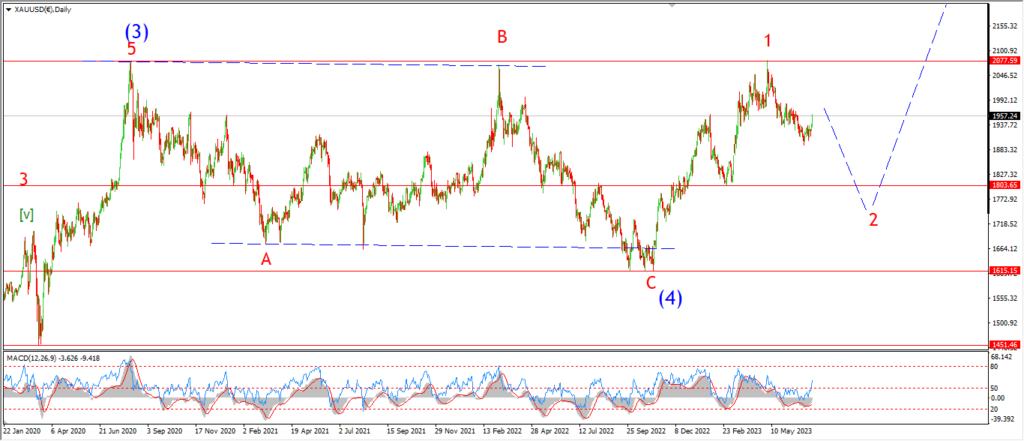
GOLD daily.
After tracing out three waves up into the wave ‘b’ high last week,
the price has now turned lower again today into wave ‘c’ of (a).
Wave ‘c’ must break below the wave ‘a’ low at 1969.54 at a minimum.
And I would like wave (a) to hit the lower bound of the previous wave (iv) at 1952 again to complete the initial three waves down.
Tomorrow;
Watch for wave ‘c’ to break 1969 at a minimum.
wave ‘b’ should hold at 2004 again.
CRUDE OIL.

CRUDE OIL 1hr.
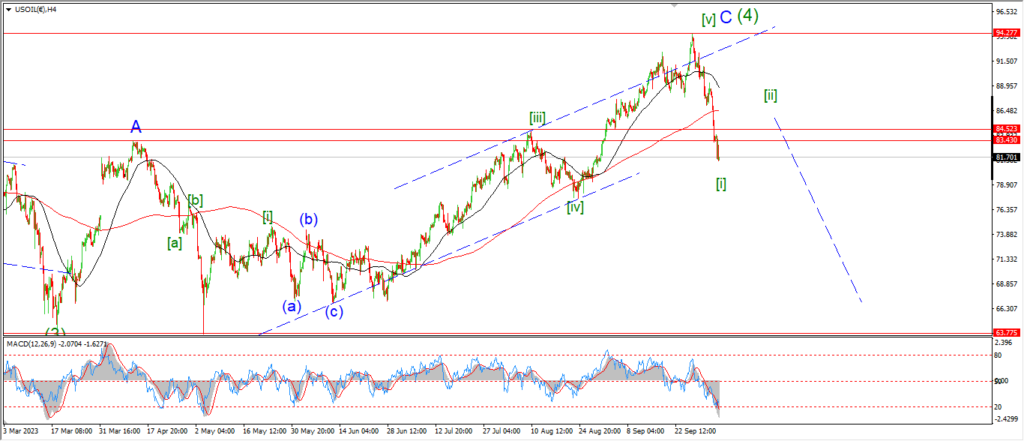
CRUDE OIL 4hr.
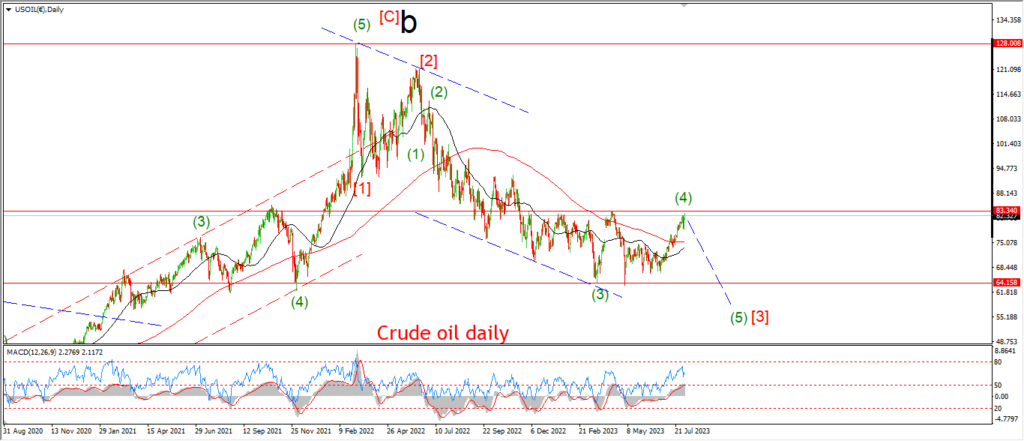
CRUDE OIL daily.
Crude oil has basically spent a month going absolutely nowhere as the price is now sitting at the wave [i] low formed early in October.
Thats a whole lot of action to achieve nothing.
I am aware in the back of my mind that the price is still acting quite correctively at the moment.
And the price has not moved impulsively into wave ‘iii’ of (iii) yet.
A solid break back below 78.00 again will be a strong signal that wave ‘ii’ is underway.
And I am looking for a low in wave ‘iii’ near that 77.00 handle again.
The larger wave (iii) blue should hit the 75.00 handle again to complete.
So there is a whole lot of work to do here to confirm this pattern in the week ahead.
Tomorrow;
the high at wave ‘ii’ must hold at 83.39.
WAve ‘iii’ of (iii) should fall in five waves towards the 77.00 level again.
S&P 500.
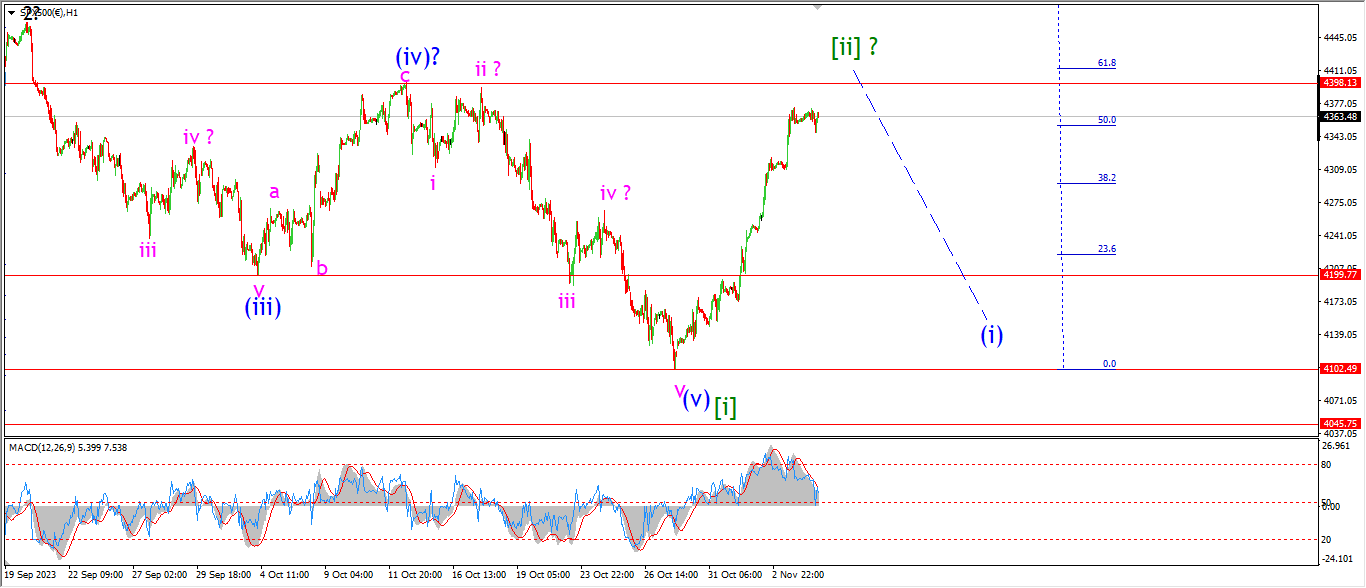
S&P 500 1hr
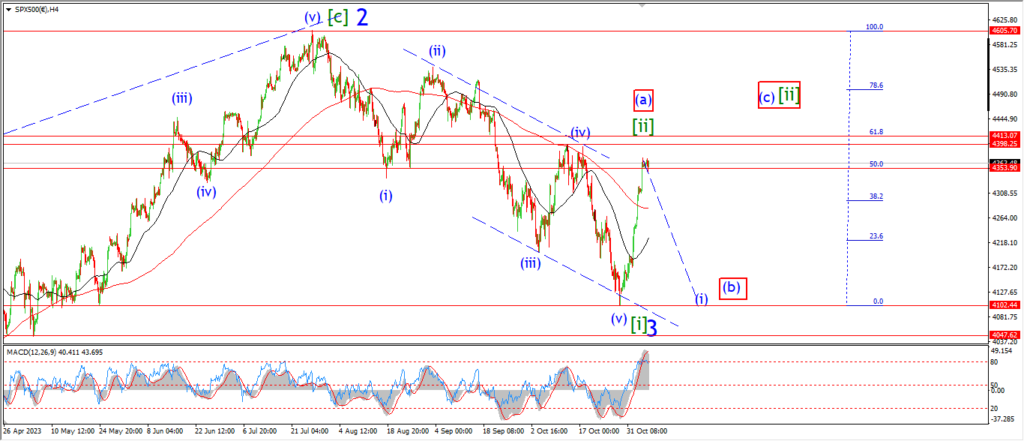
S&P 500 4hr
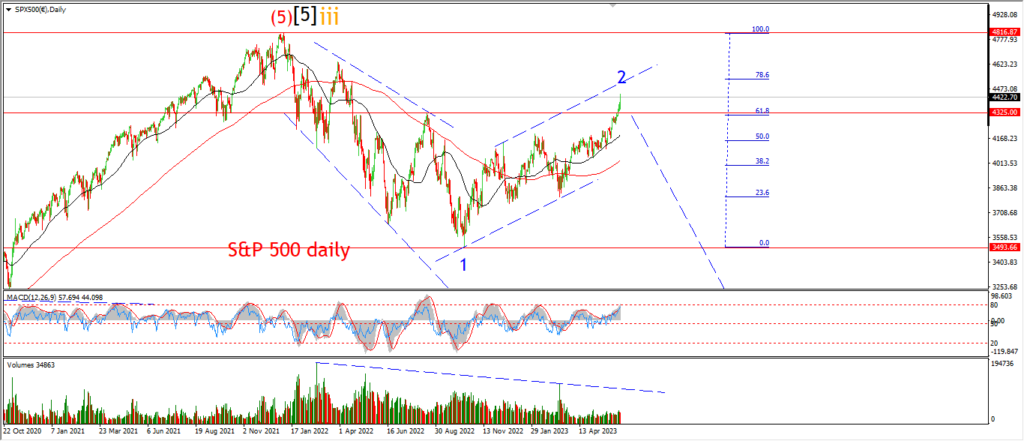
S&P 500 daily.
If we take a look at the bigger picture tonight to start.
The 4hr chart in the S&P shows us how far the rally in wave [ii] came last week.
Now the price is holding just below the wave (iv) high at 4398 after a day of very little if any progress.
I did mention last week that the rally into this high may only be wave (a) of [ii].
an this is shown as the alternate count.
The main reason for suggesting this alternate idea is the vertical nature of that rally.
It is quite impulsive in nature.
So I am sitting on the fence here regarding the probability of that alternate count now.
Its a clean 50/50 at the moment on paper.
I do prefer the main count only for one main reason.
That is;
the rally has retraced back into the area that wave [ii] should hit already.
So the required retracement has been achieved in that one move.
It is still up for debate here which count is a better fit.
and we will see a clearer view on that as this weeks action plays out.
A sharp decline off this high will favor the main count.
And a more corrective decline will favor the alternate count.
Tomorrow;
Watch for this wave [ii] rally to show signs of exhaustion and reversal over the next few sessions.
If we see an impulsive decline to form a lower high below wave [ii] again by midweek,
that will signal wave (i) of [iii] may be underway.
SILVER.

SILVER 1hr
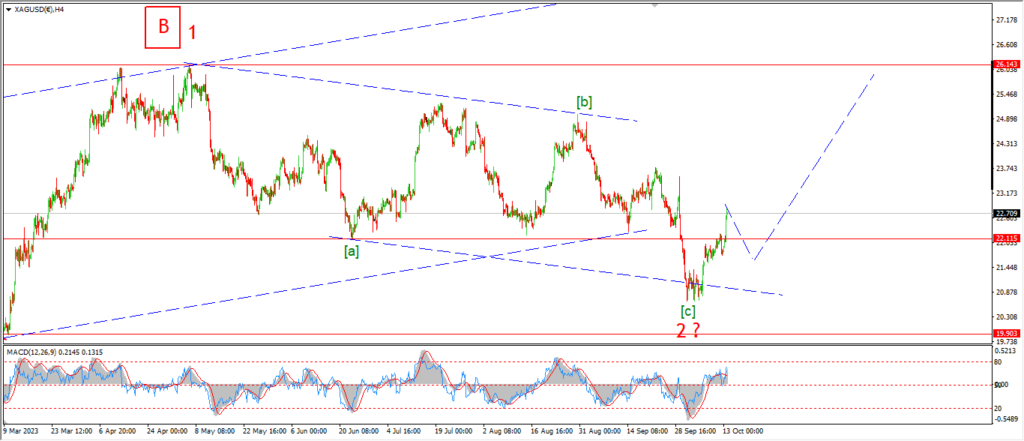
SILVER 4hr.
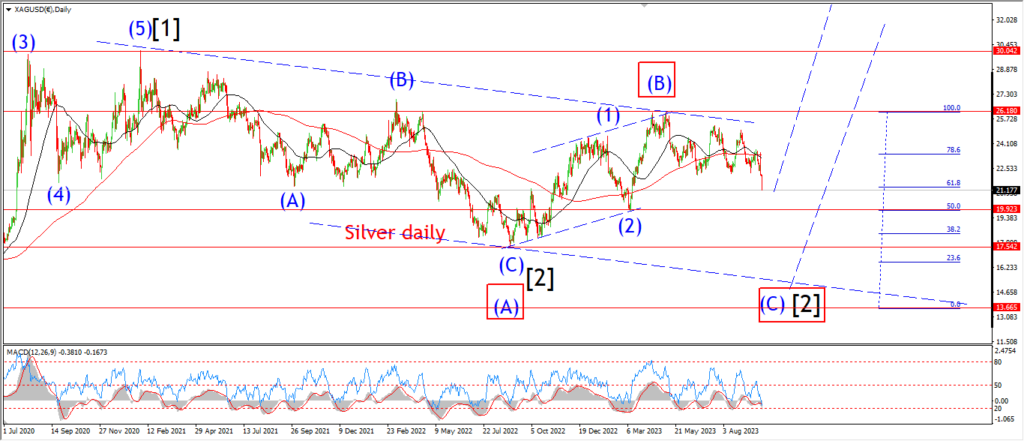
SILVER daily.
The triangle pattern in wave ‘b’ is still in play here tonight.
the price has fallen back into the range again today with a very corrective looking decline in place.
Wave ‘d’ of ‘b’ can fall into the lower trend line at 22.75 again later tomorrow is this pattern holds.
And then a final lower high in wave ‘e’ near 23.00 again will complete the triangle,
and then setup the market for a decline into wave ‘c’ of (ii) later this week.
Tomorrow;
If this pattern holds in wave ‘b’,
then the price range will continue to contract for another few sessions maybe completing by late Wednesday.
Watch for wave ‘d’ of ‘b’ to fall into 22.75 to complete.
WAve ‘c’ must hold at 23.29.
BITCOIN
BITCOIN 1hr.
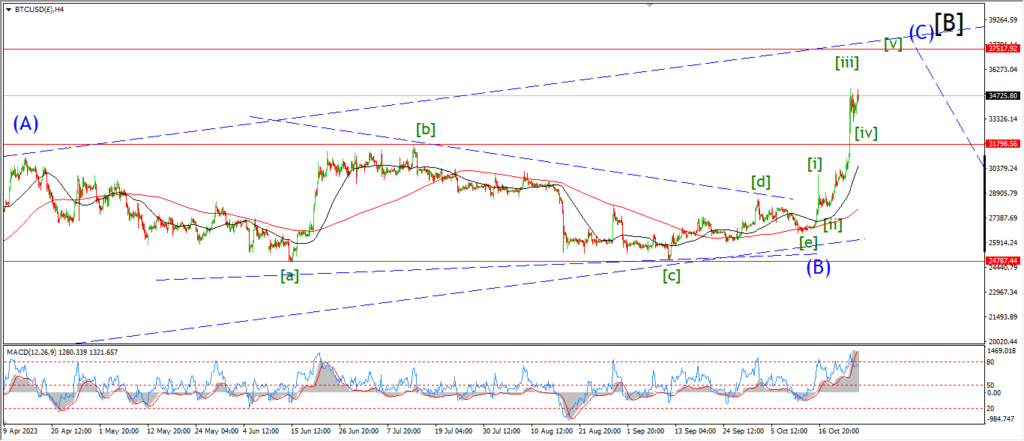
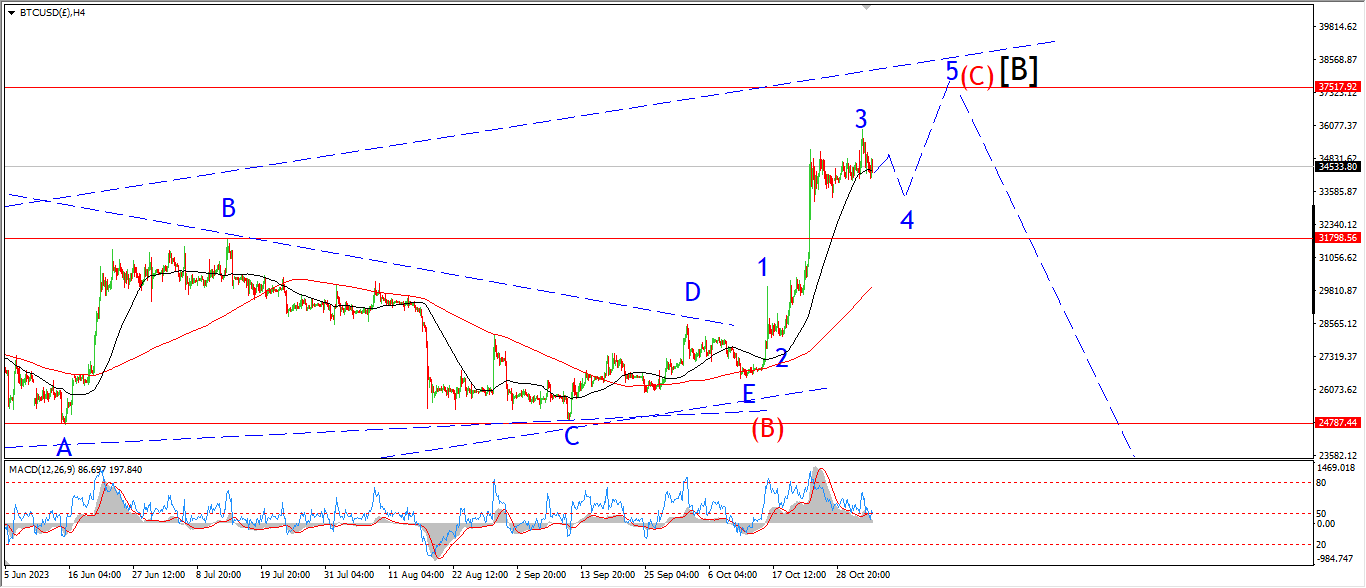
BITCOIN 4hr.
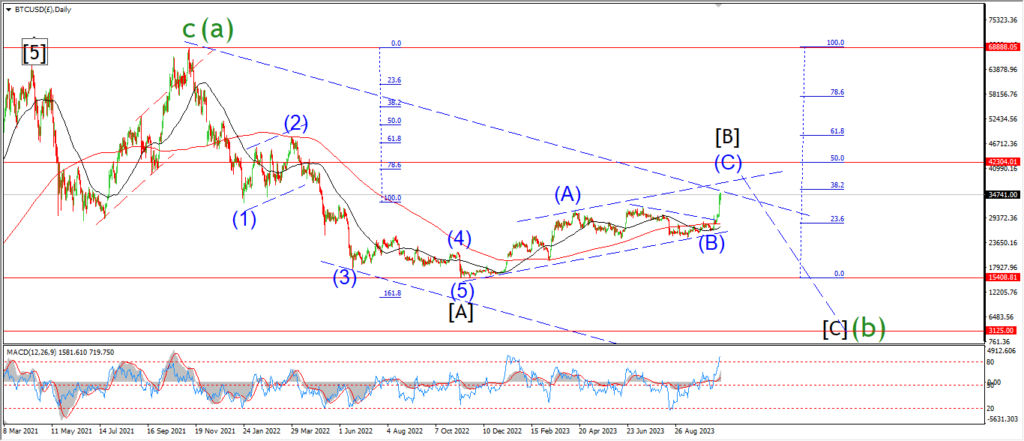
BITCOIN daily.
….
FTSE 100.
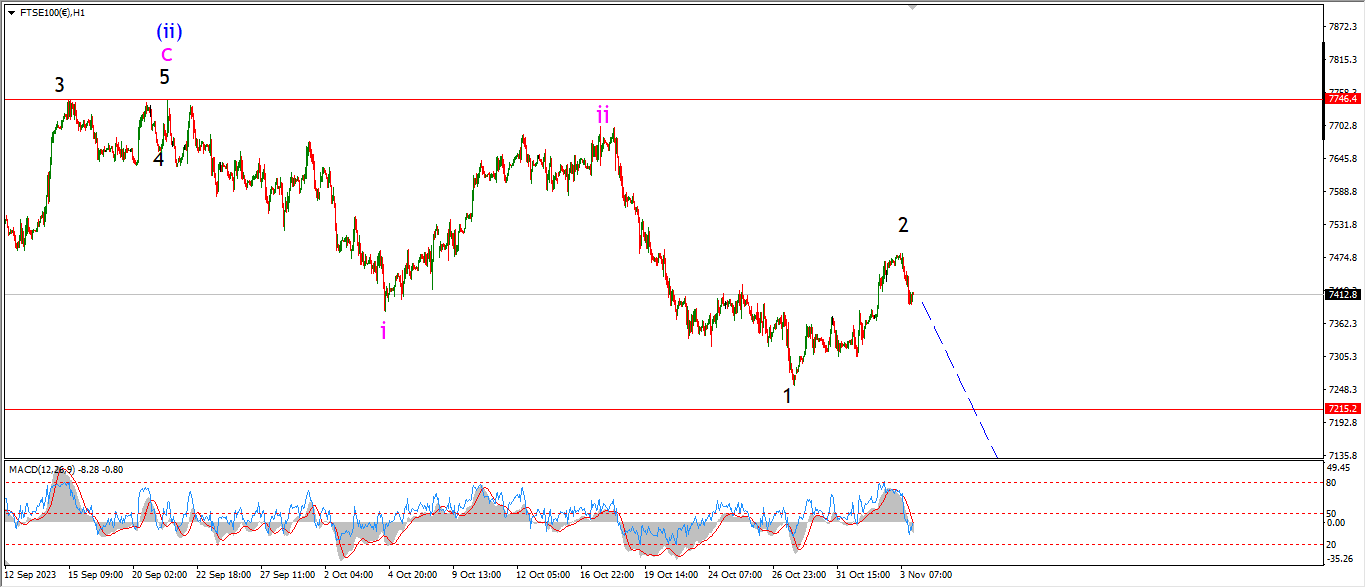
FTSE 100 1hr.
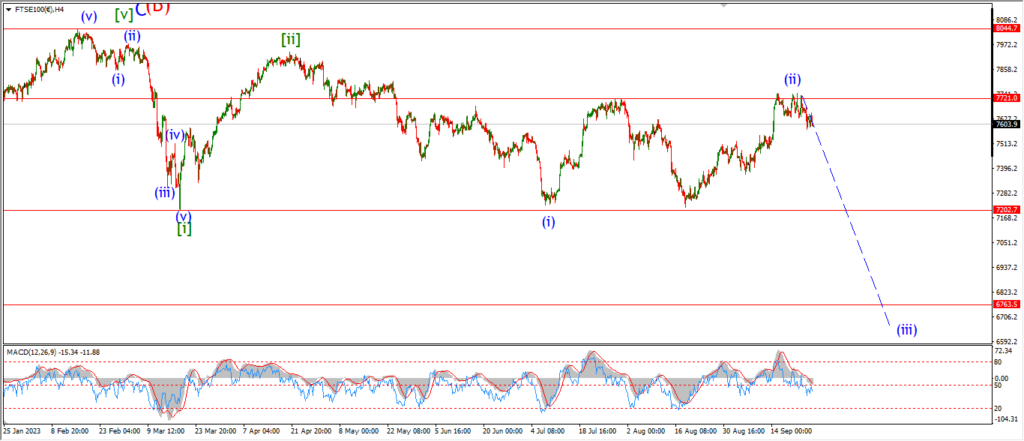
FTSE 100 4hr.

FTSE 100 daily.
….
DAX.
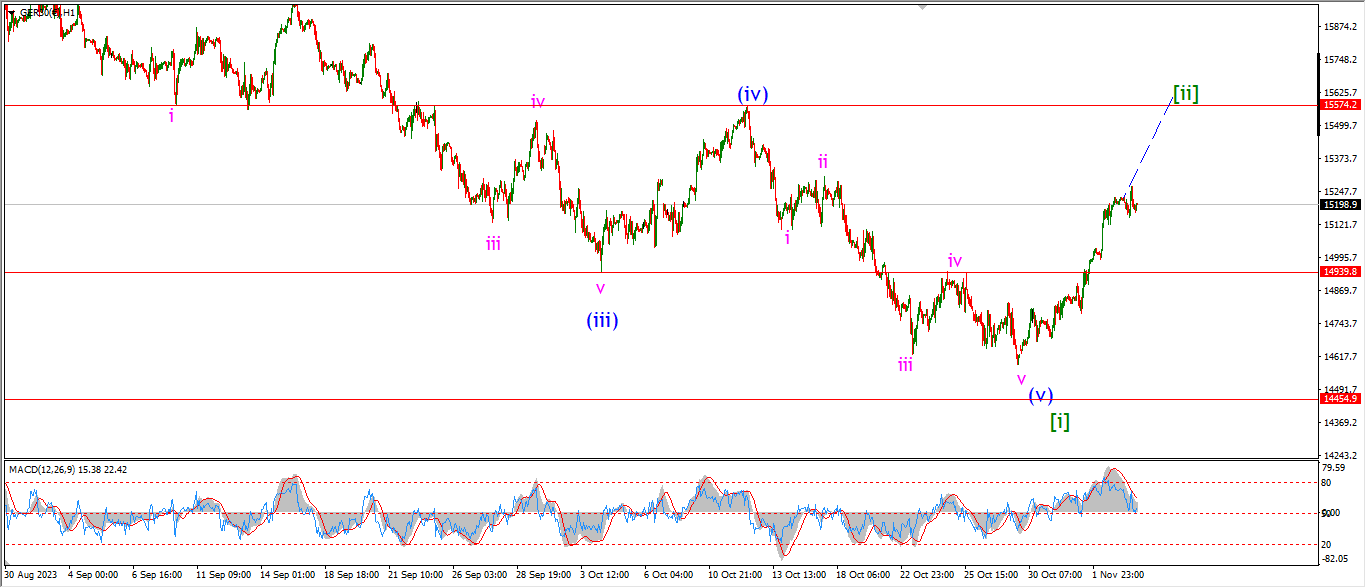
DAX 1hr
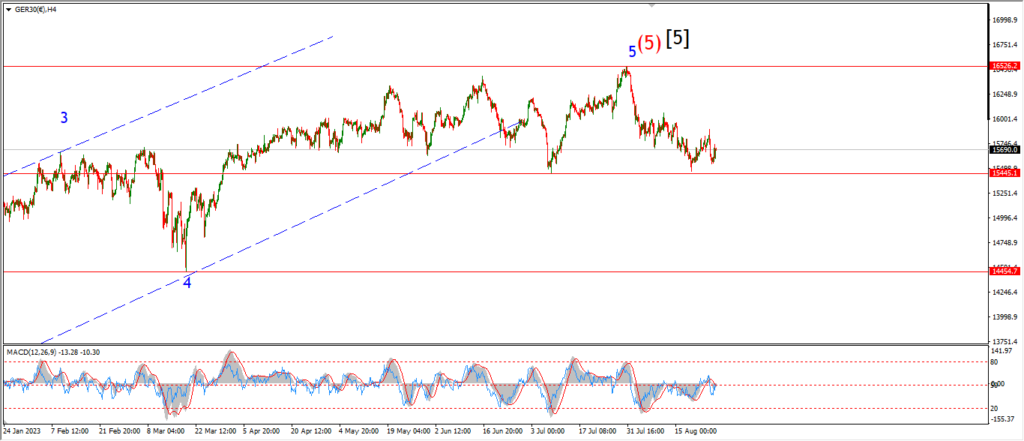
DAX 4hr

DAX daily.
….
NASDAQ 100.
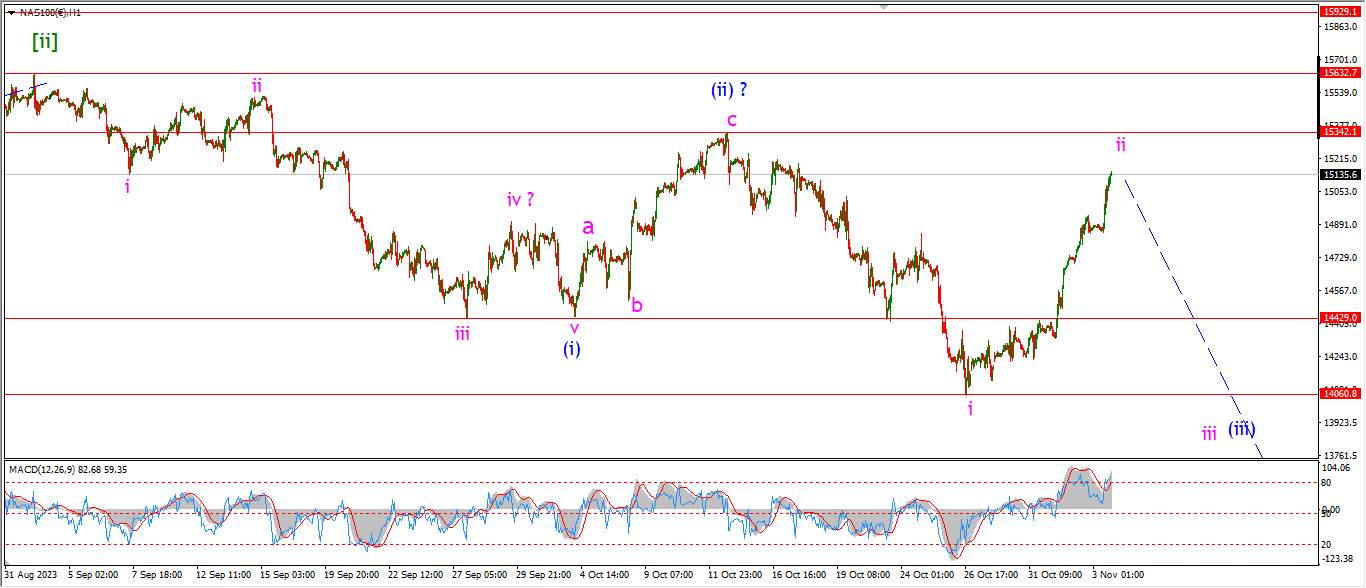
NASDAQ 1hr
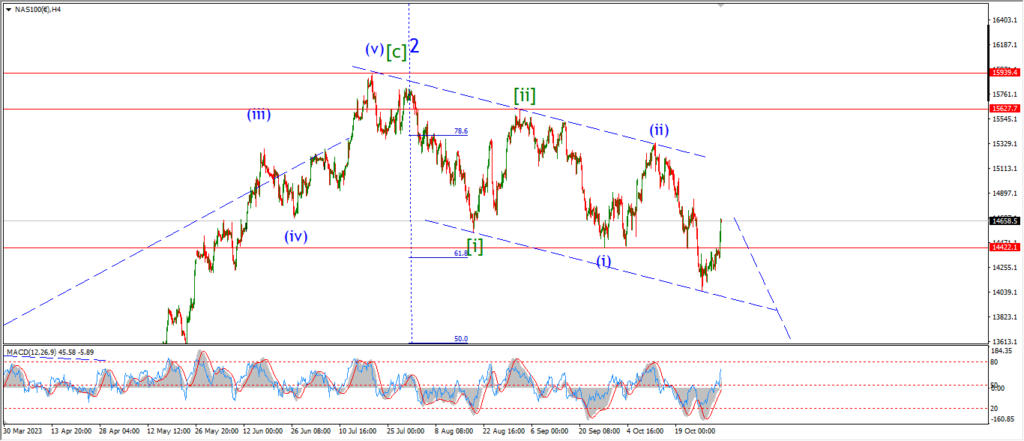
NASDAQ 4hr.
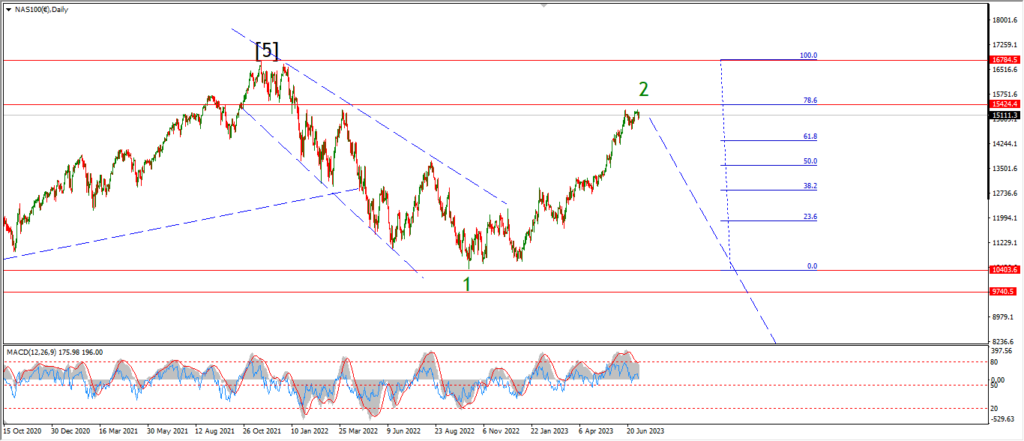
NASDAQ daily.
….