
Good evening to one and all,
God’s Blessings to you all tonight.
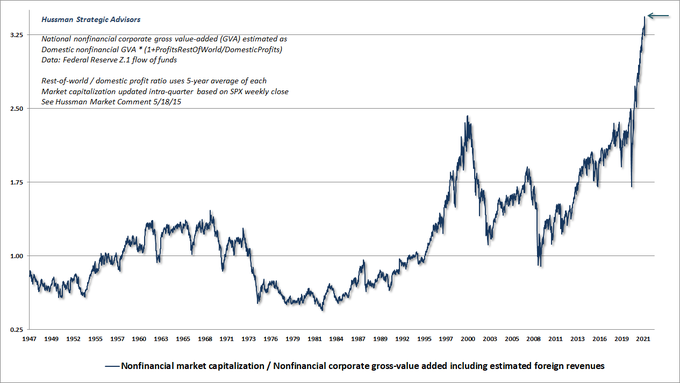
More charts for John Hussman tonight, these charts really shine a light on the reality of the condition of the stock market.
The stock market is now in the most dangerous position in history and there is absolutely no reason to believe that we will get out of this one without serious damage over the coming few years.


EURUSD.
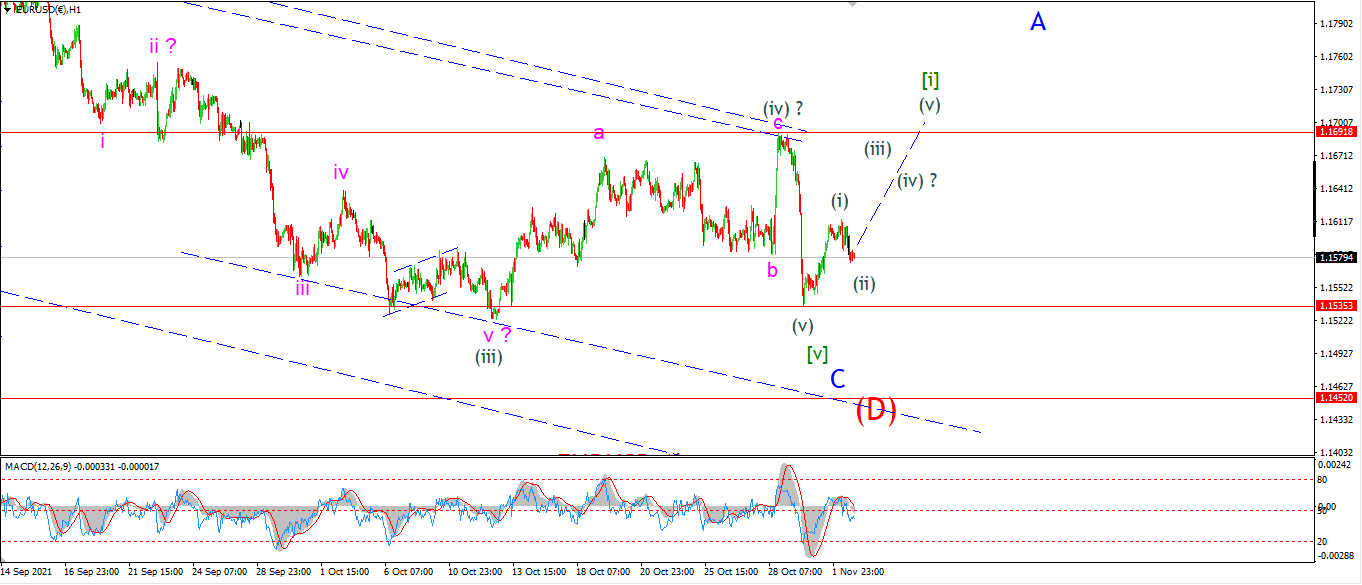
EURUSD 1hr.
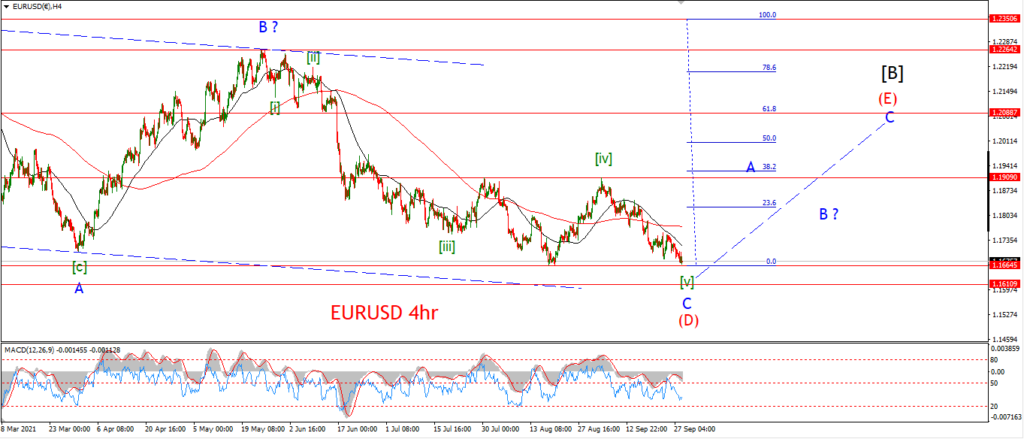
EURUSD 4hr.
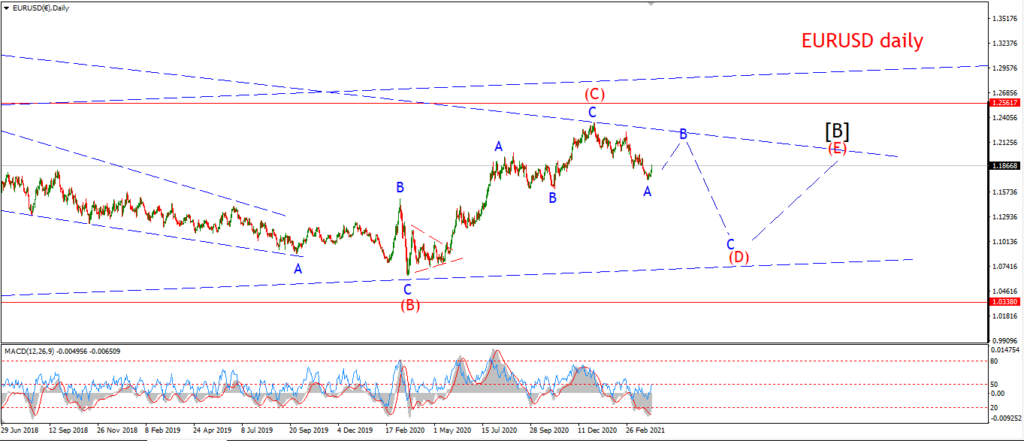
EURUSD daily.
I have an eye towards wave (E) finally beginning this week.
And if that is the case here,
then we need a five wave rally out of the lows to confirm this change of trend.
At the moment we have a possible (i) (ii) pattern in place off 1.1535.
A further rally back above 1.1691 in five waves will be a strong hint that this market is on the verge of turning higher for at least the next month anyway.
Tomorrow;
Watch for wave (ii) to hold above 1.1535.
Wave (iii) of [i] should begin by tomorrow evening.
GBPUSD
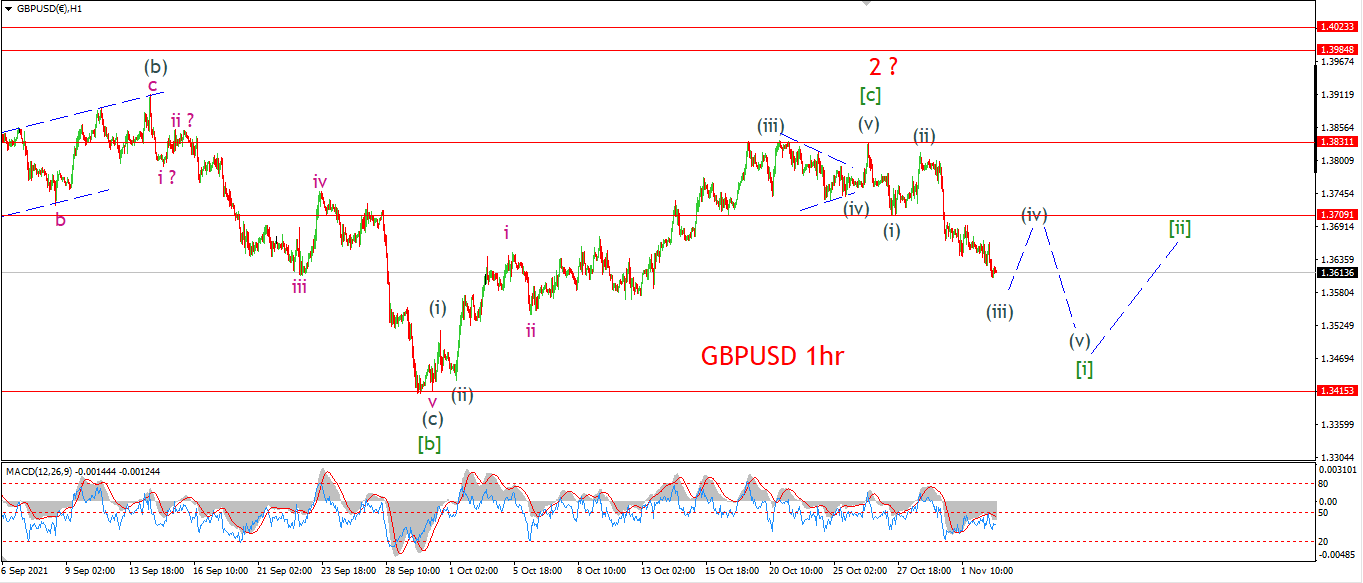
GBPUSD 1hr.
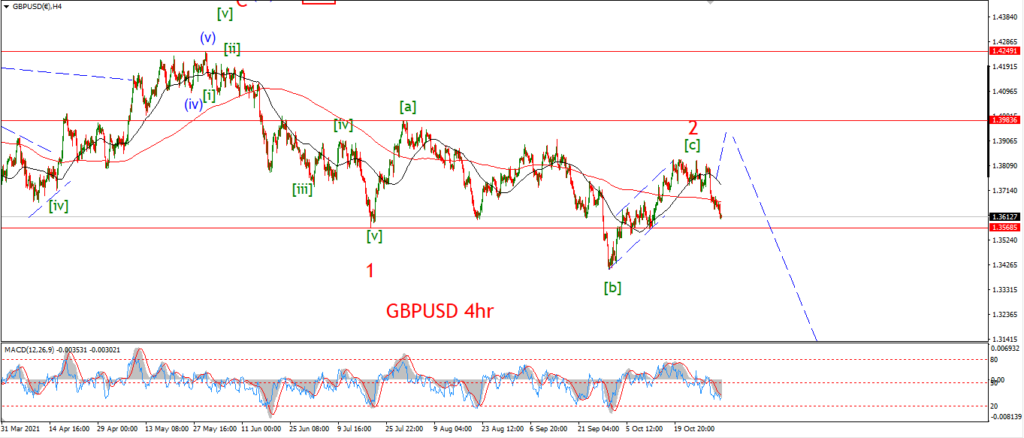
GBPUSD 4hr.
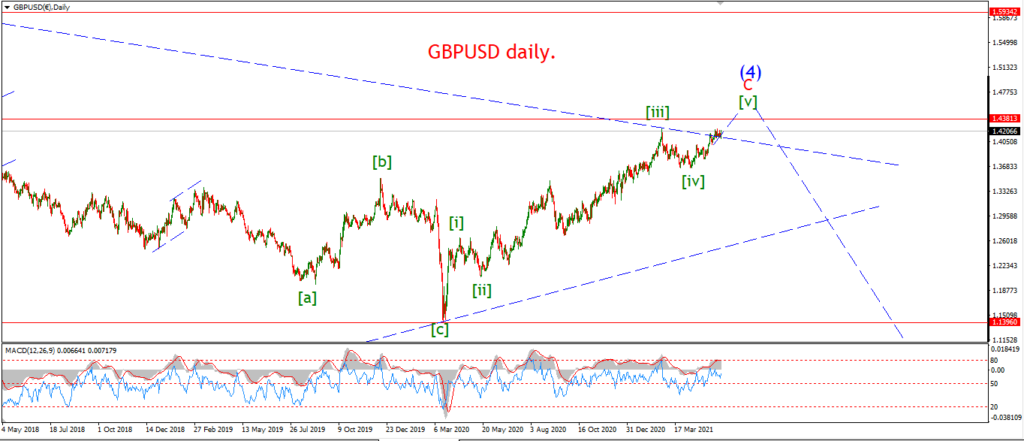
GBPUSD daily.
I am looking at a possible top for wave ‘2’ again tonight.
The price has fallen enough now to rule out the previous count for a five wave rally into wave [c].
and now the action is developing lower and we are on the verge of five waves down.
If this count is correct,
then we will see a rather strange divergence between cable and eurusd,
this is not completely unheard of,
and it should not last long!
Tomorrow;
Watch for wave (iii) to complete a five wave pattern,
and then wave (iv) should correct higher and hold below the wave (i) low at 1.3709.
USDJPY.
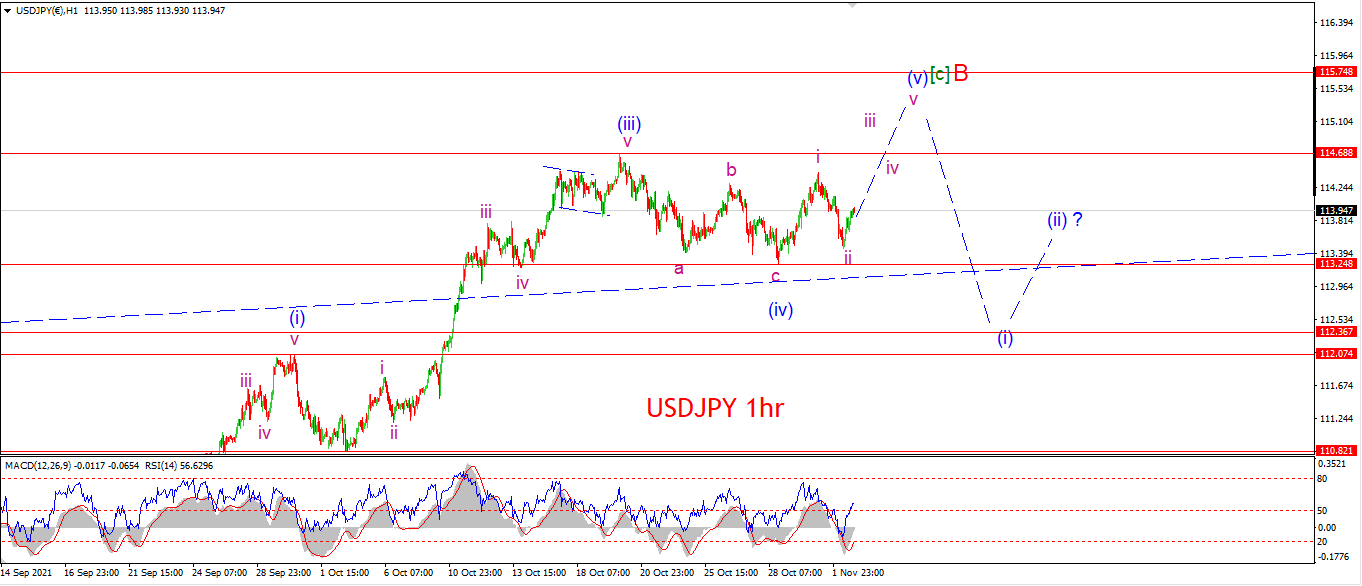
USDJPY 1hr.
USDJPY 4hr.
USDJPY daily.
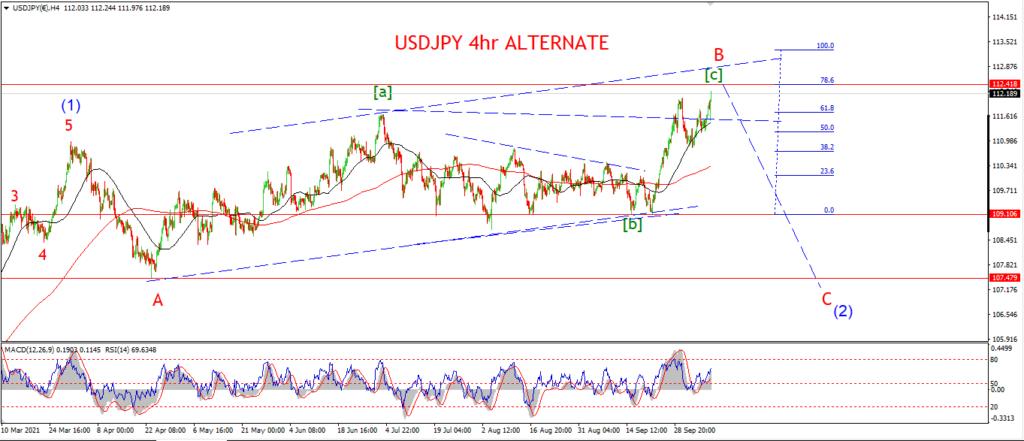
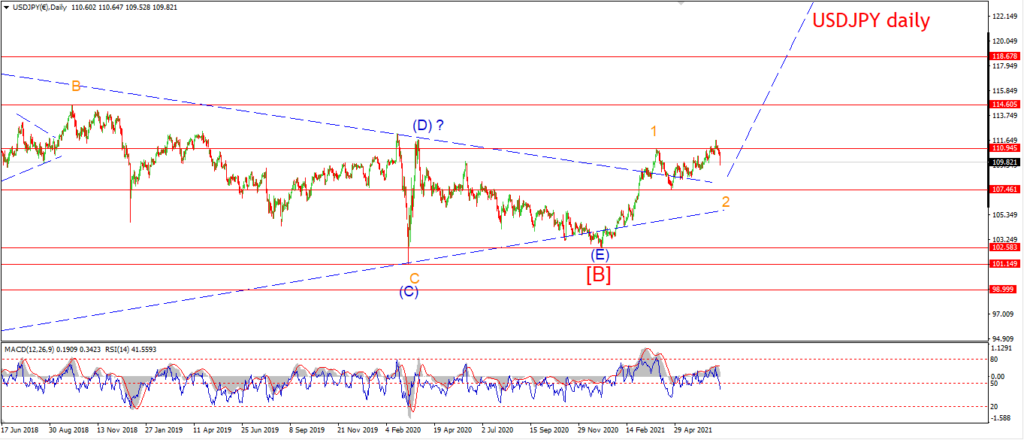
I have switched to that alternate in USDJPY also tonight.
The recent decline has only traced out a three wave decline into 113.24
and now we have a rally and a higher low in place this evening to suggest an impulsive pattern is developing.
This rally should complete wave (v) of [c] of ‘B’ in the region of 115.50 again,
and then I will look for wave ‘C’ down to begin.
Tomorrow;
watch for wave ‘ii’ to hold above 113.24,
and wave ‘iii’ of (v) to break above 114.68 again.
DOW JONES.
DOW 1hr.
DOW 4hr
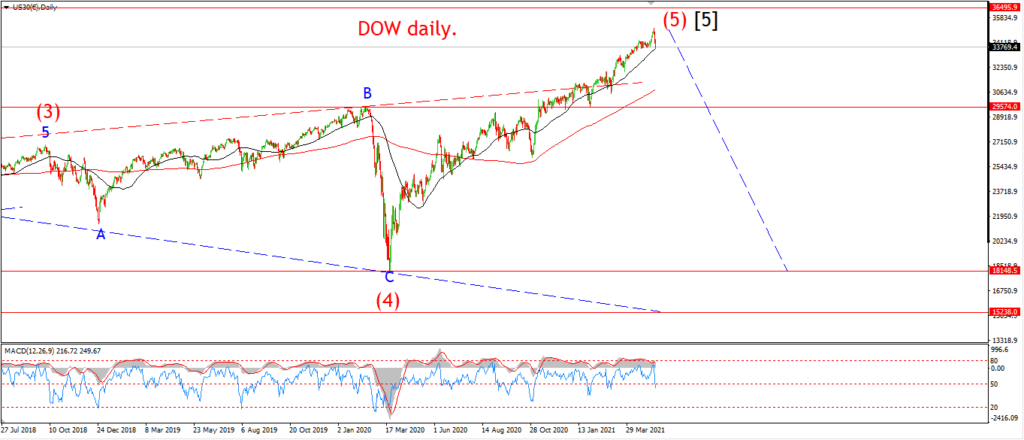
DOW daily.
Well it is a possibility……..
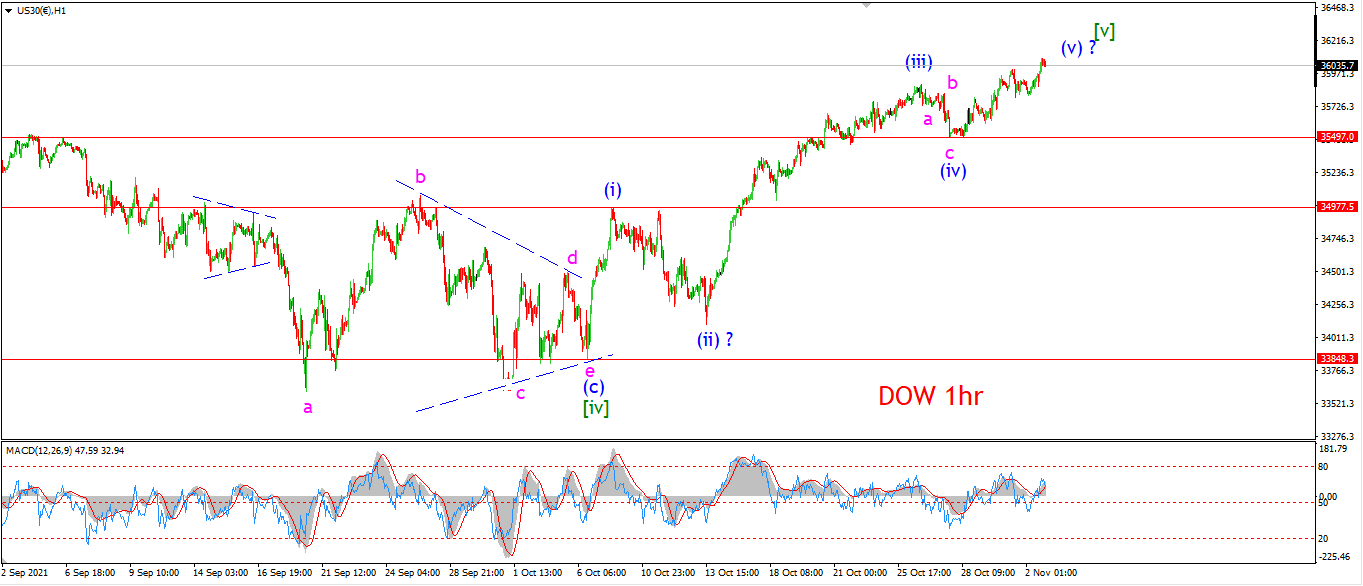
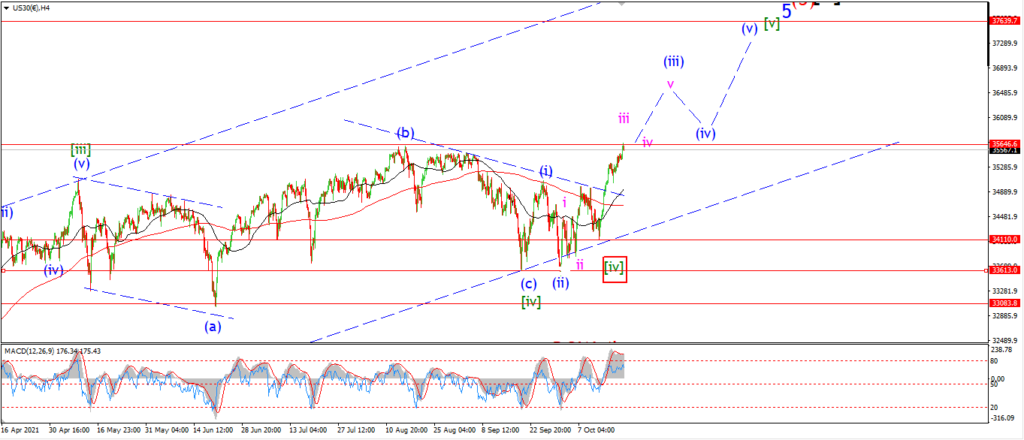
Firstly I have switched to the alternate count for wave [iv] tonight.
I think it is worth considering that count because of what has transpired this week.
I am showing the most bearish interpretation of of the waves on the hourly chart.
The price action this week has traced out five waves up in wave (v) into todays high.
And this action now completes a five wave pattern off the wave [iv] low.
The price created a solid extension in wave (iii) of [v],
and because of that,
I do not expect an extension to occur in wave (v) of [v],
that does not rule out the possibility entirely,
but it does make an extension less likely in wave [v].
Tomorrow;
If we see a decline back below the wave (i)V low at 35497 that will open up the possibility of a reversal pattern developing again.
GOLD
GOLD 1hr.
GOLD 4hr.
GOLD daily.
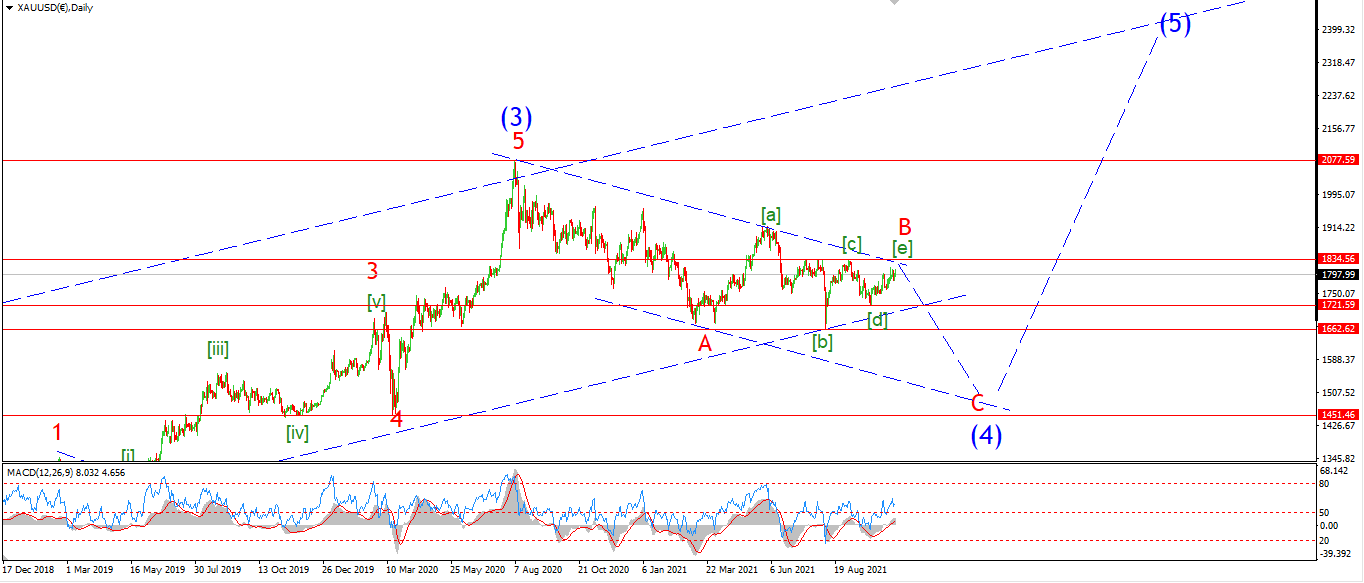
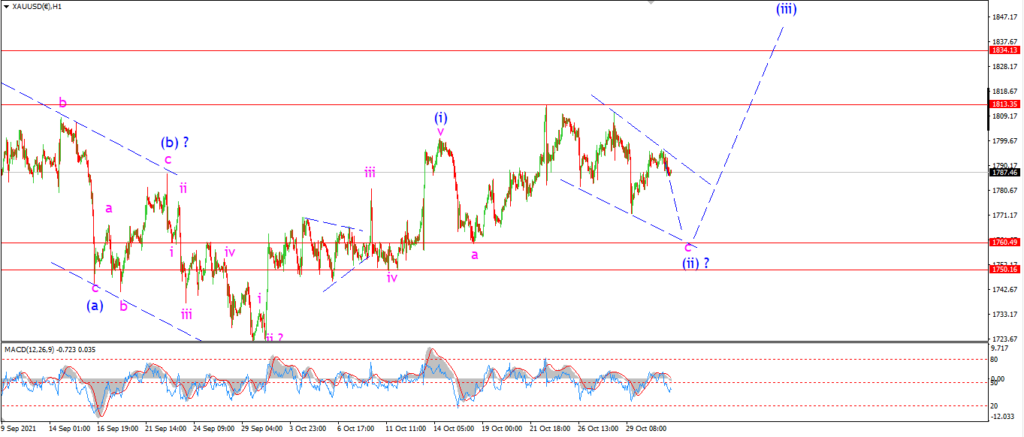
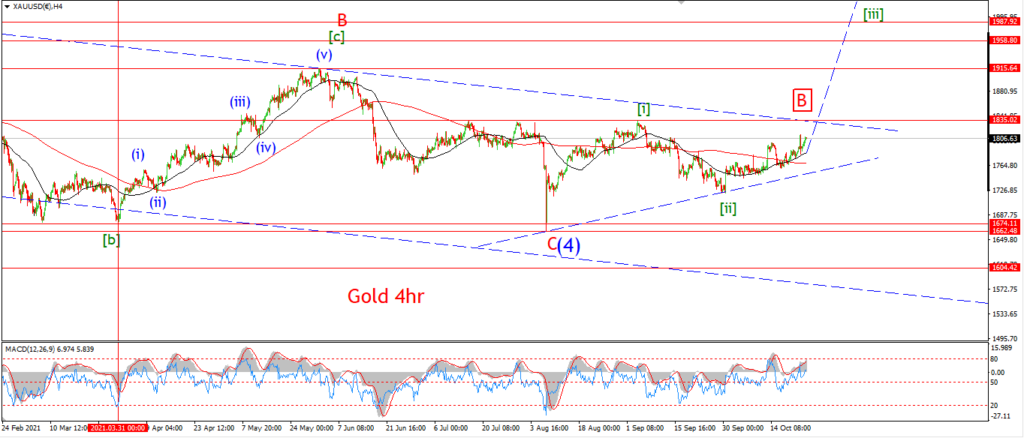
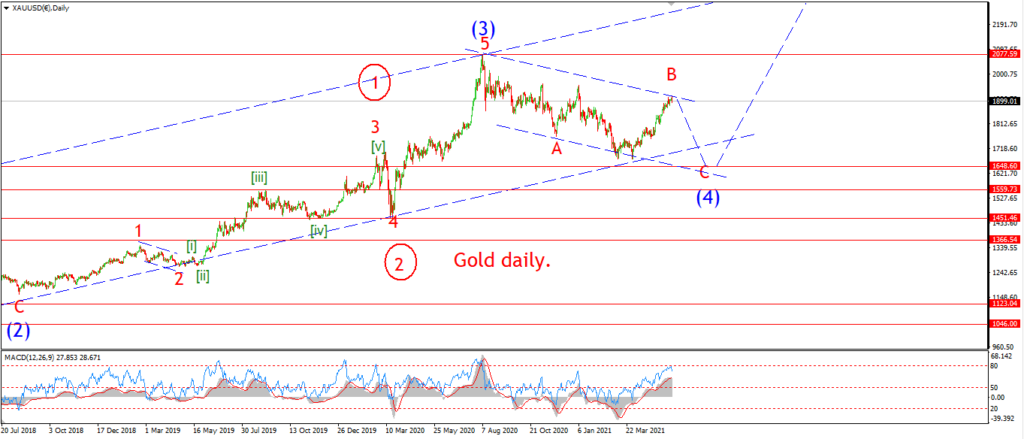
Gold is pretty flat today off another small lower high created yesterday.
I am looking at a possible ending diagonal wedge declining in wave ‘c’ of (ii).
The pattern is not clear here at all,
and I’m afraid this is the best option in terms of a bullish setup.
A decline into 1760 again will complete a correction in wave (ii) and then I will look for a rally to begin wave (iii) up again.
The alternate count has not gone away yet.
Only a break of that recent high at 1813 again will help rule out the bearish alternate.
Tomorrow;
Watch for wave ‘c’ of (ii) to complete a wedge decline into 1760 again.
CRUDE OIL.
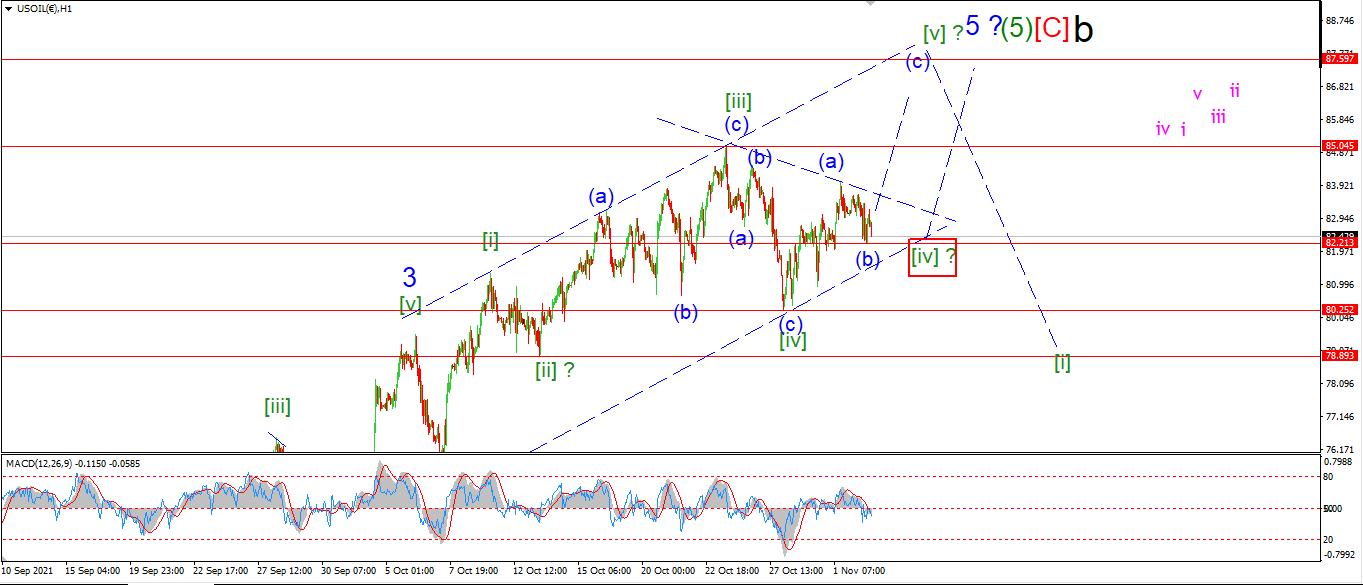
CRUDE OIL 1hr.
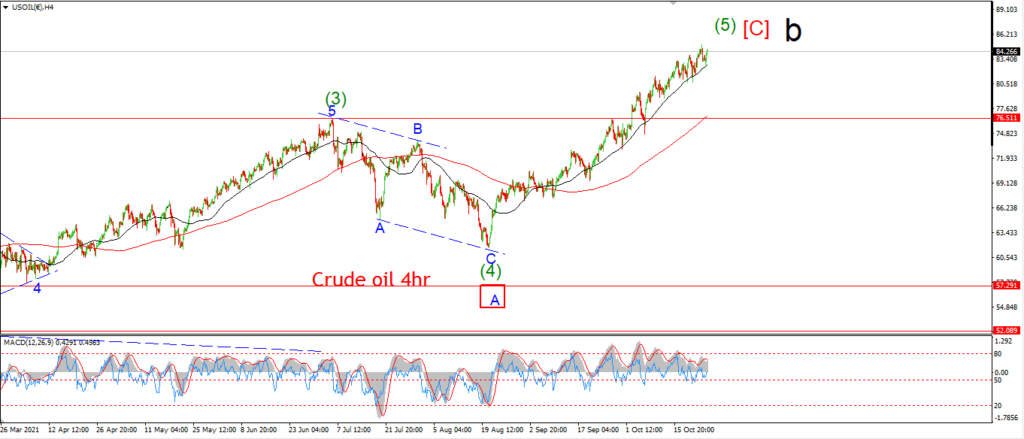
CRUDE OIL 4hr.
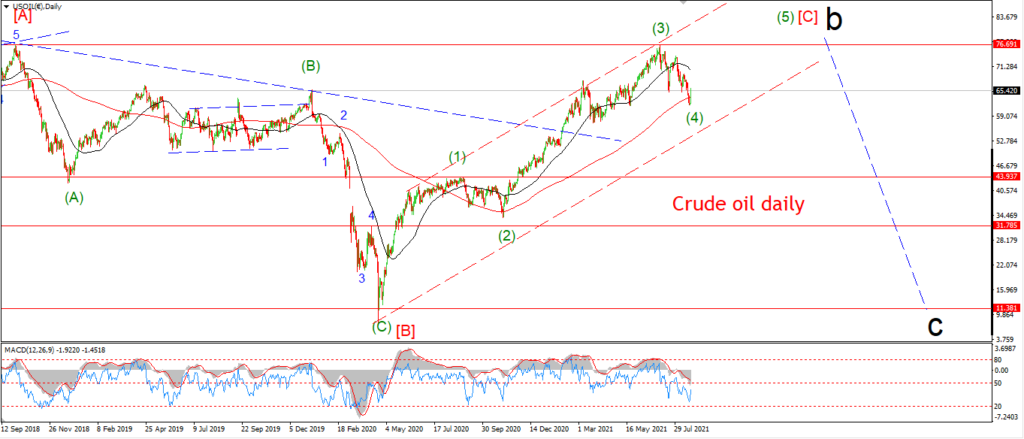
CRUDE OIL daily.
The action in crude is getting a little choppy here even for an ending diagonal.
there is a chance that wave [iv] is actually tracing out a triangle as shown in red.
If this is correct,
then the price action will continue to get tighter over the coming days and complete the triangle above 80.25.
Tomorrow;
For the moment I will continue to track a three wave rally in wave [v] of ‘5’.
The low of todays session is labelled wave (b) of [v].
With a five wave rally in wave (c) of [v] left to come.
S&P 500.
S&P 500 1hr
S&P 500 4hr
S&P 500 daily.
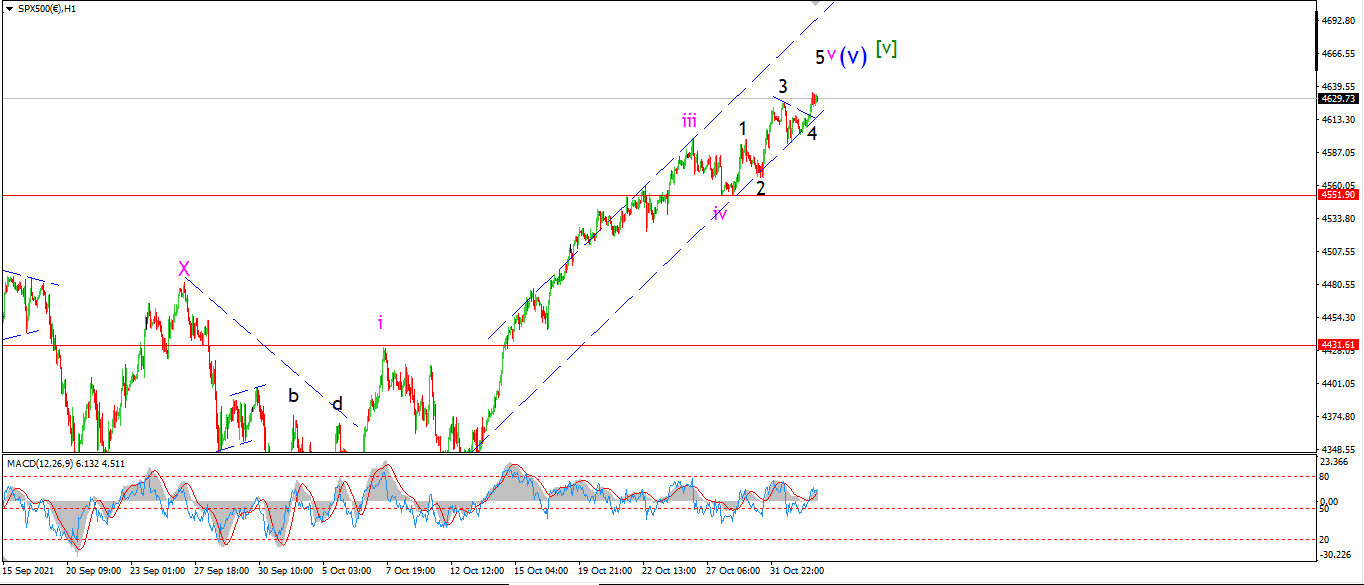
We have a new high tonight but only just!
The early session was dominated by a triangle correction.
I have labelled this wave ‘4’ of ‘v’,
and out of that correction we see another small rise to a new high this evening.
The pattern in wave ‘v’ is a legitimate five wave pattern.
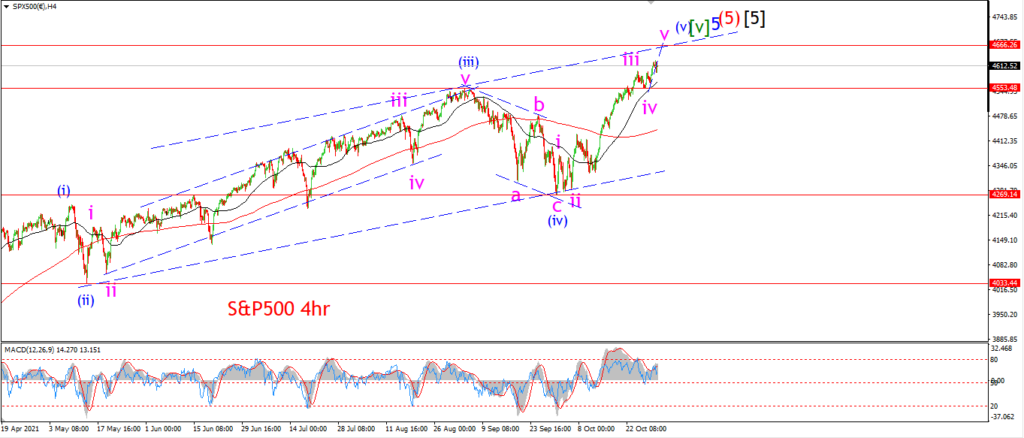
And now we have a possible completed count on our hands.
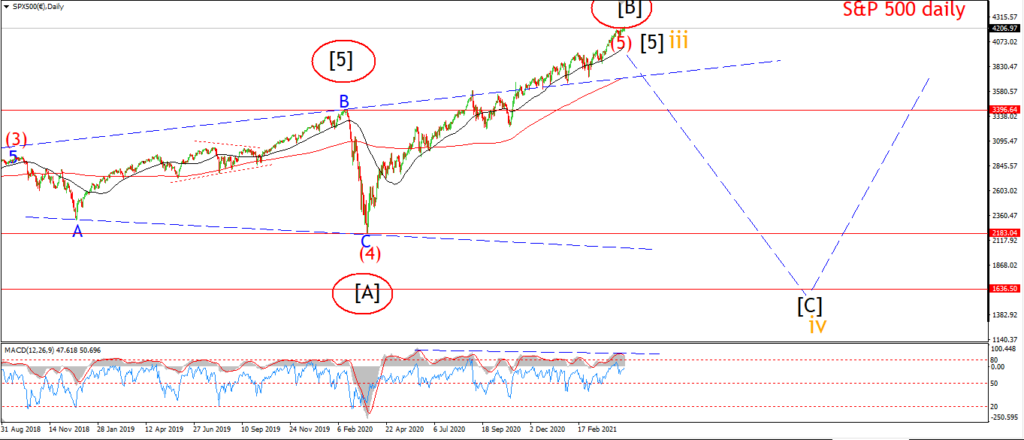
It sure resonates with the charts I have linked at the top of tonight’s update.
And boy does it spell a disaster if this is actually it!
I am not betting on this count just yet as we need some confirming price action off a top to signal a possible turn.
So right now it is just a wait and see moment.
Tomorrow;
Watch for a sign that wave ‘v’ is complete here.
4550 marks wave ‘iv’ so lets see if we get a drop below that level before the end of the week.
SILVER.
SILVER 1hr
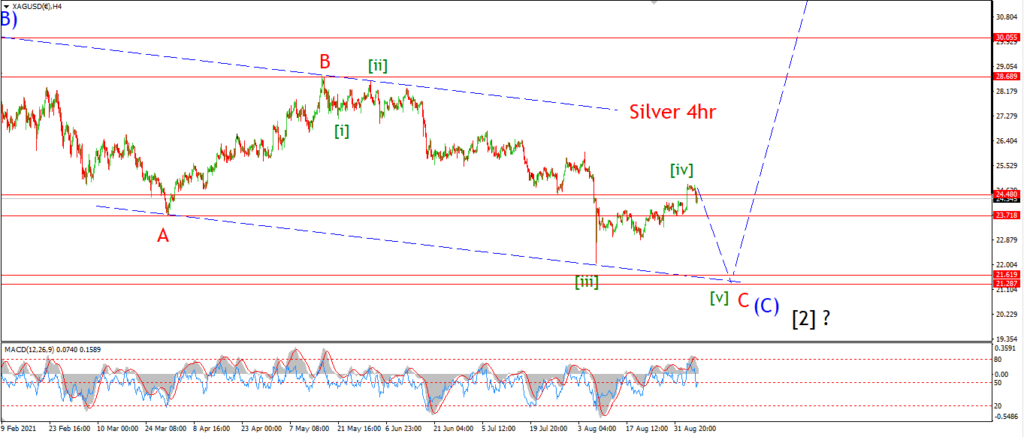
SILVER 4hr.
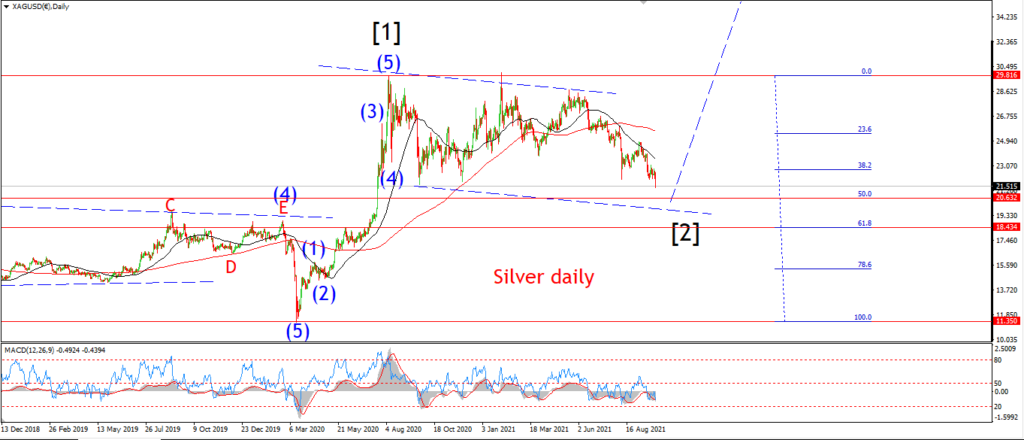
SILVER daily.
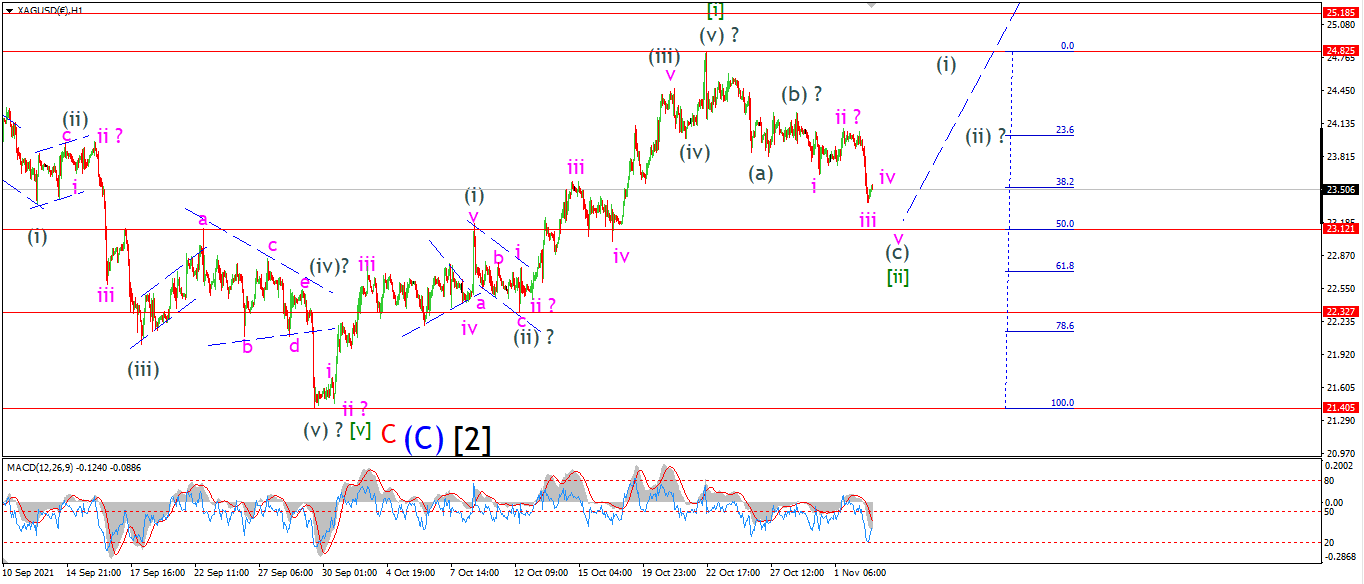
Todays action requires a rethink of the pattern on the hourly chart.
The bullish impulsive wave is still my main count.
but the decline over the last week has retraced too much to be considered as part of wave [i] now.
I am now looking at the possibility that wave [ii] is now underway,
and the pattern off the high at wave [i] best fits a flat correction.
Three waves down in (a),
three up in (b),
and now five waves down underway in wave (c) to complete wave [ii].
The price is approaching the 50% retracement level of wave [i],
so we should see wave [ii] find a low pretty soon in that area.
If this count is correct,
then we will see a reversal higher by Friday to signal wave [iii] up has begun.
BITCOIN
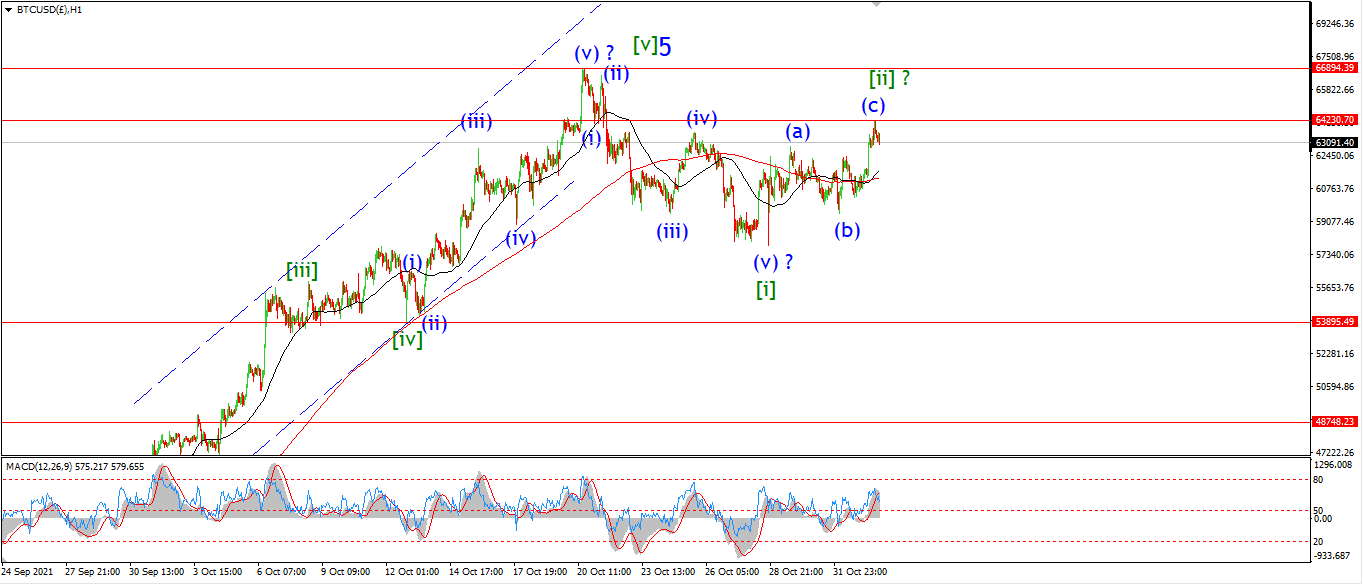
BITCOIN 1hr.
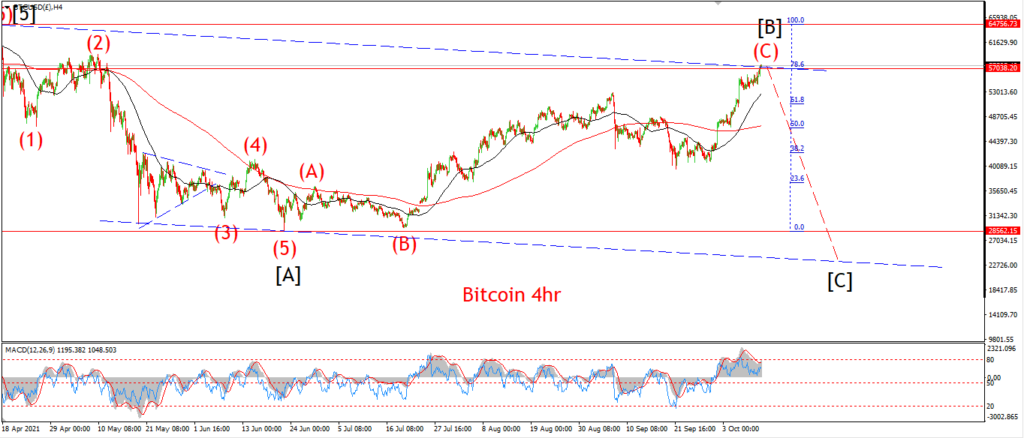
BITCOIN 4hr.
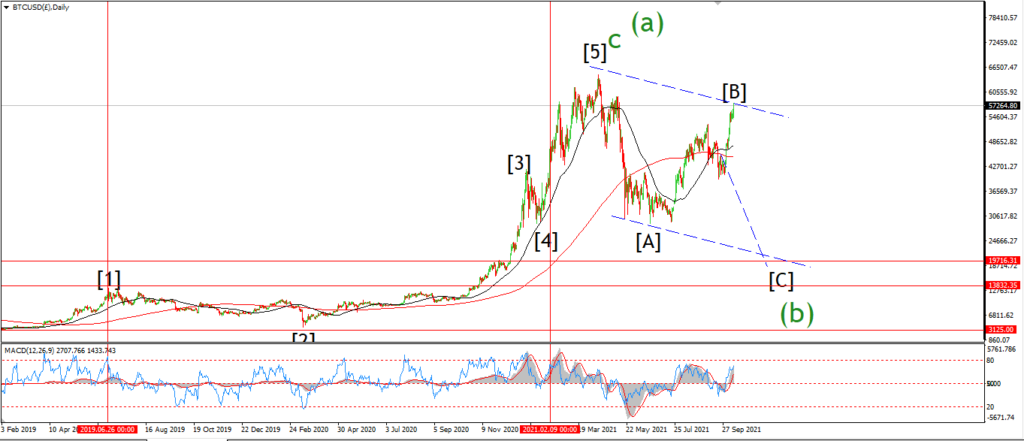
BITCOIN daily.
Topping in wave [B].
FTSE 100.
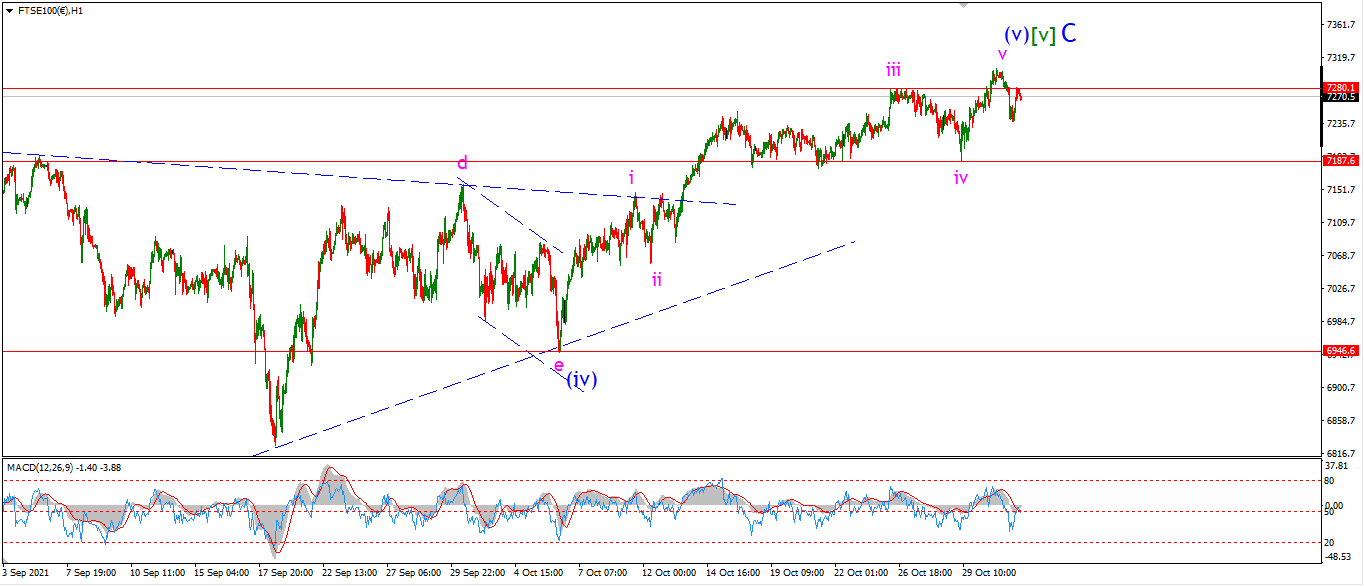
FTSE 100 1hr.
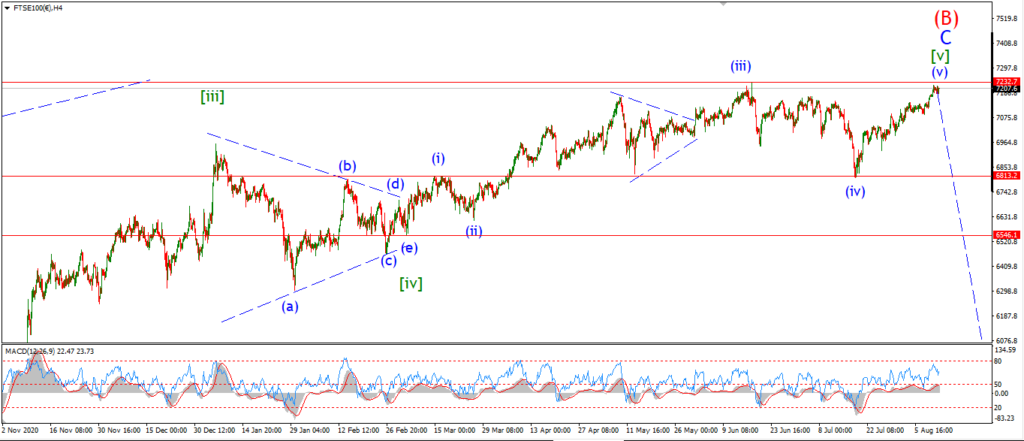
FTSE 100 4hr.

FTSE 100 daily.
Complete wave (B).
DAX.
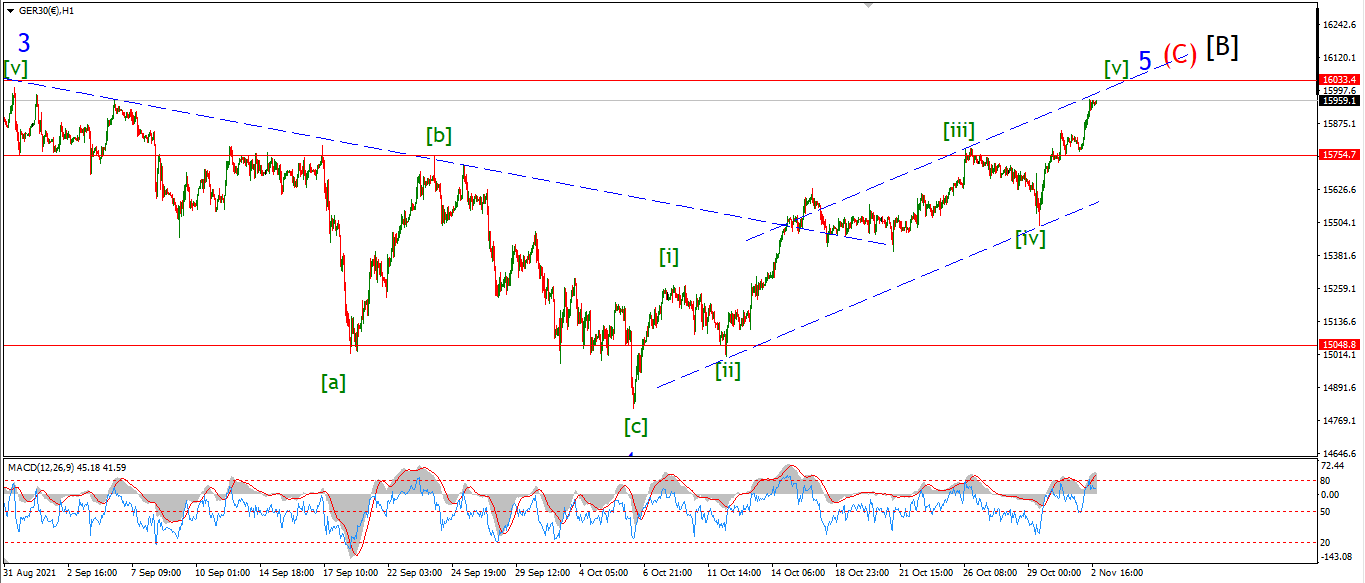
DAX 1hr
DAX 4hr
DAX daily.
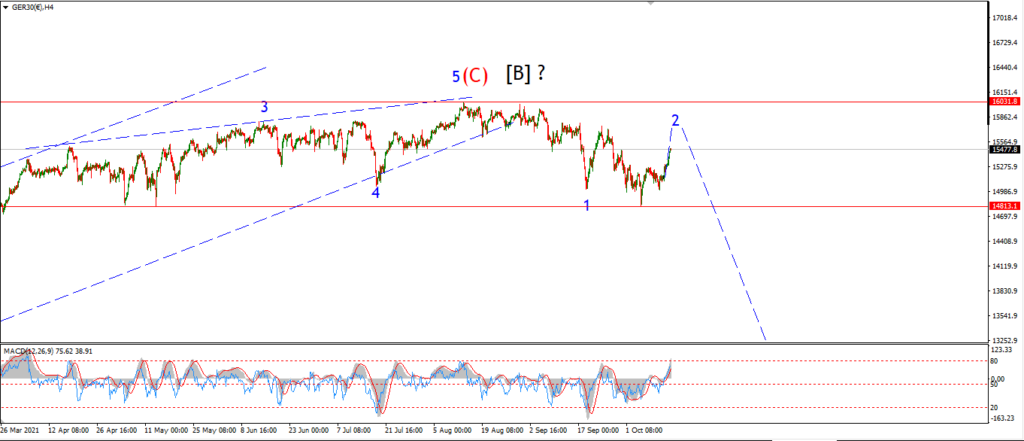
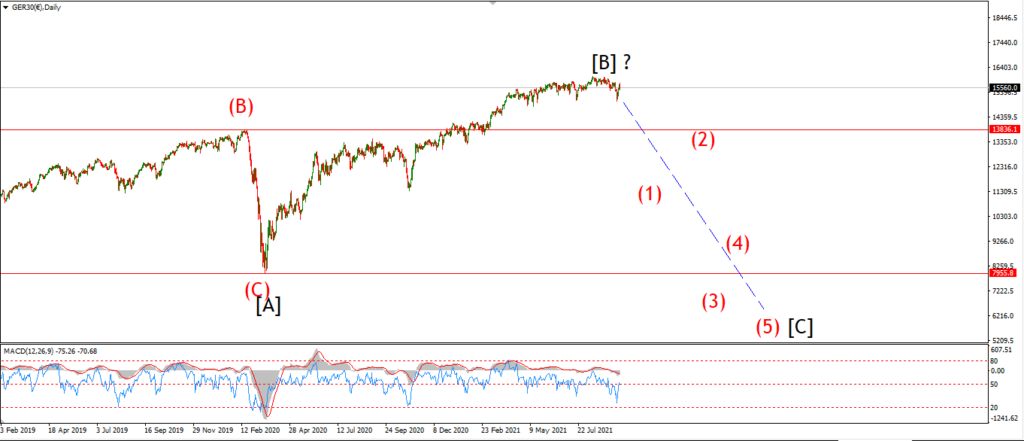
Topping out in wave [B].
NASDAQ 100.
NASDAQ 1hr
NASDAQ 4hr.
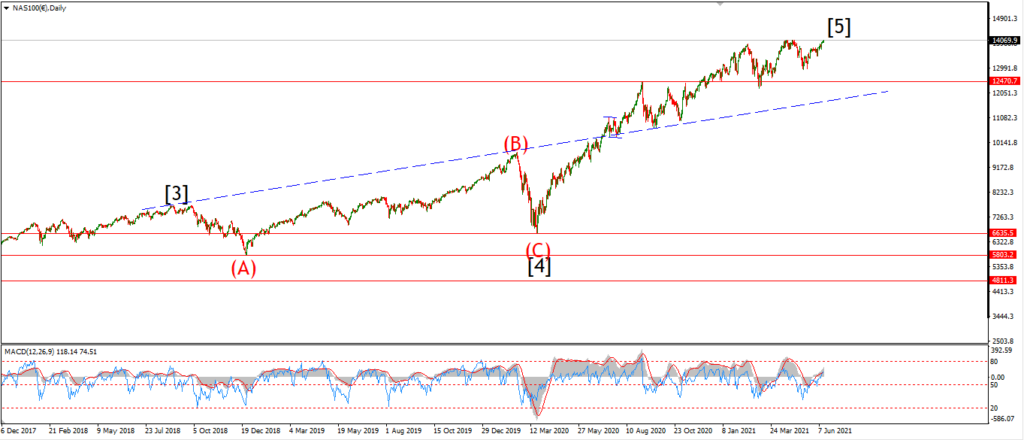
NASDAQ daily.
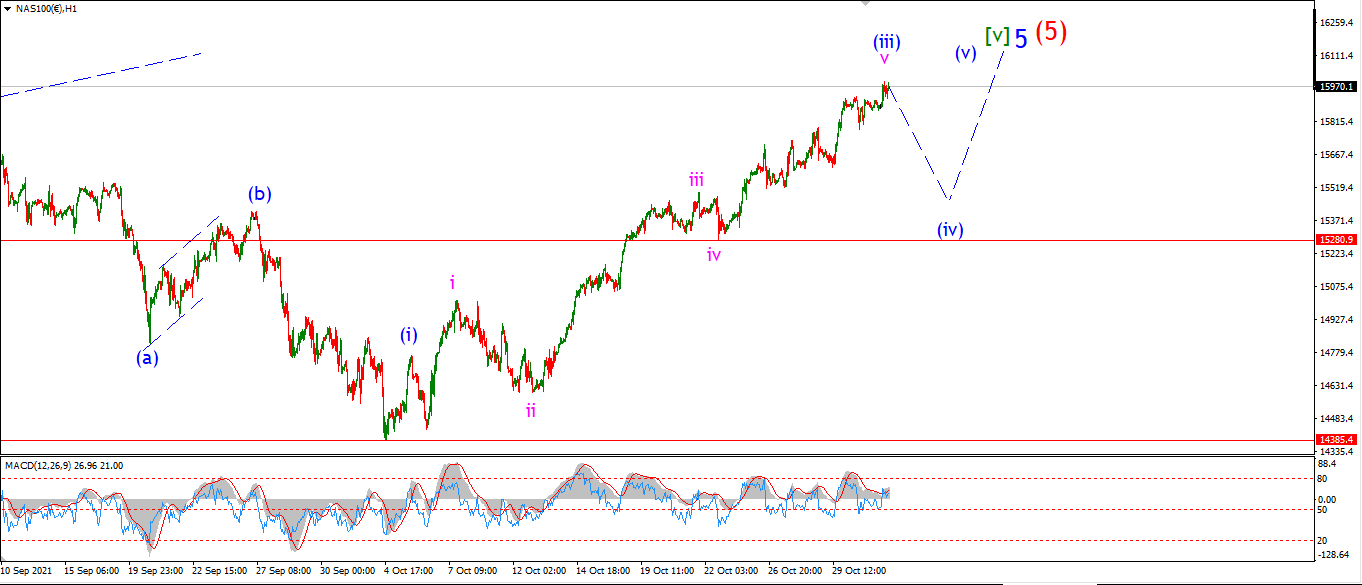
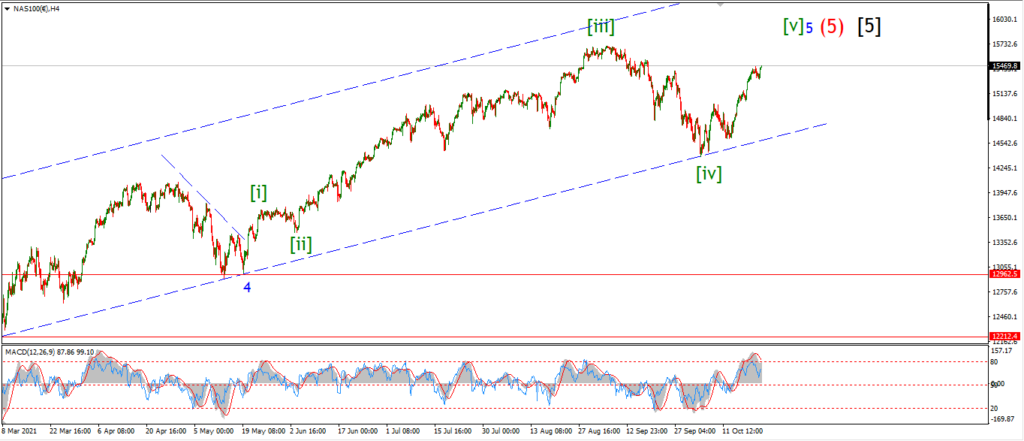
Is this it for the Nasdaq??