
Good evening to one and all,
God’s Blessings to you all tonight.
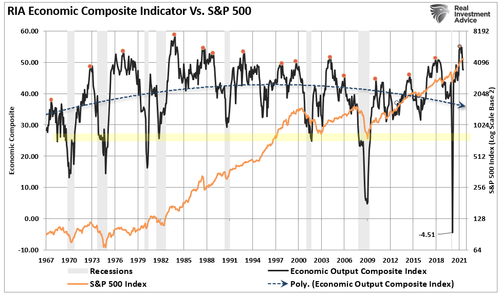
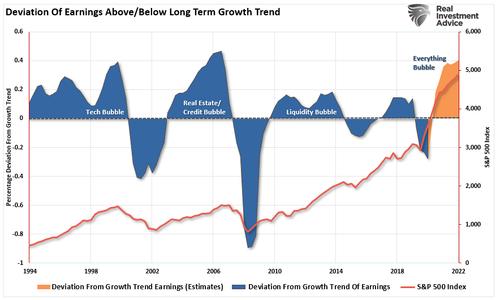
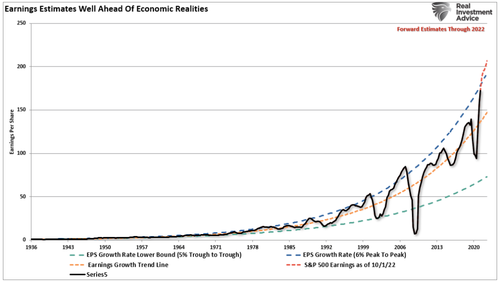
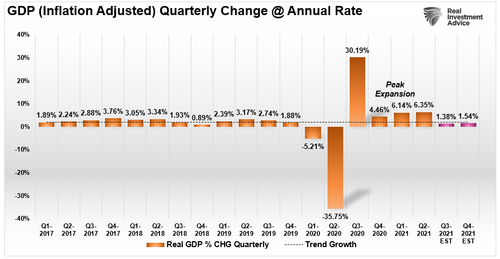
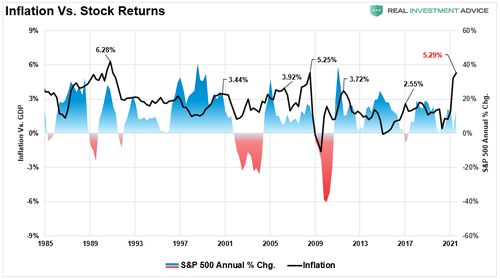
A few charts from an awesome piece on zerohedge today.
https://www.zerohedge.com/markets/market-melts-economic-growth-weakens
EURUSD.
EURUSD 1hr.
EURUSD 4hr.
EURUSD daily.
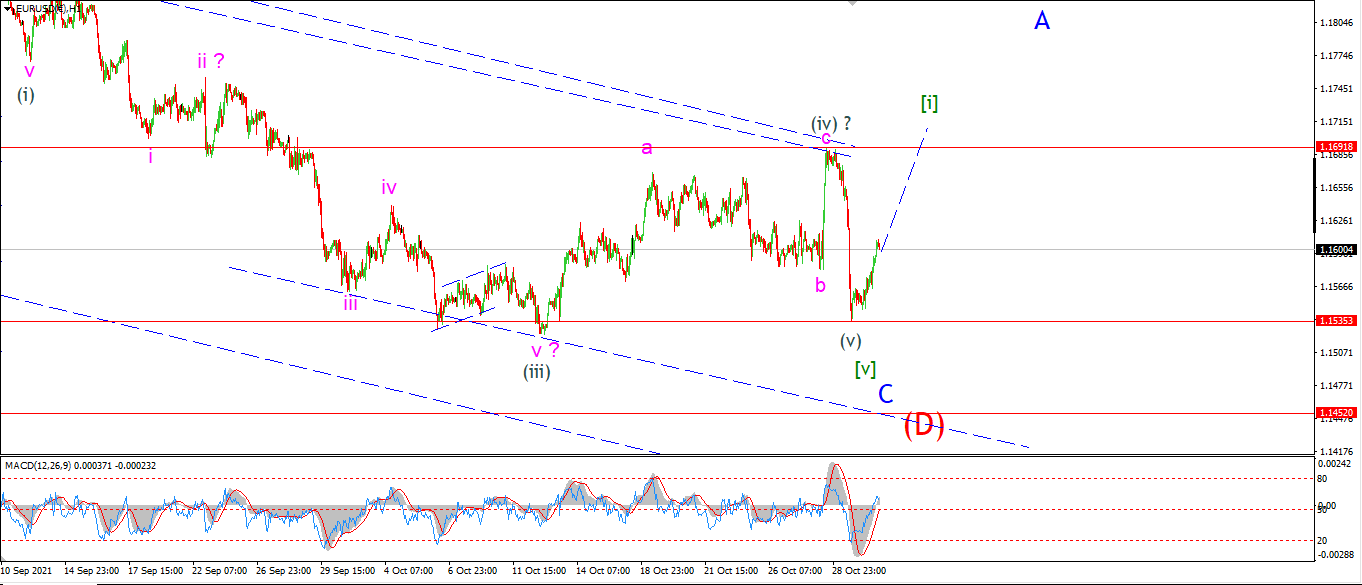
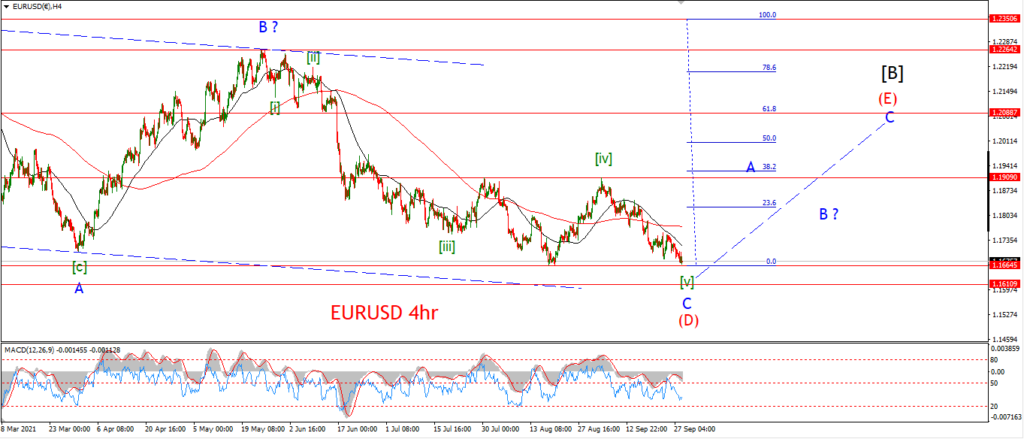
I am looking at the possibility of a failed fifth wave scenario in wave (v) of [v] tonight.
the price never made a new low to break 1.1524.
And then today we see a reasonable retracement rally to counter act that hard spike lower last week.
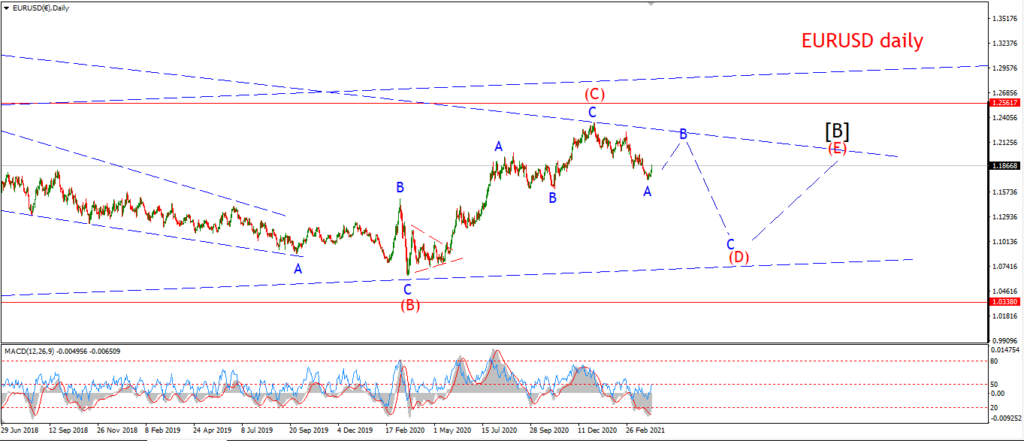
It is now clear that momentum is starting to turn higher and that should be followed by price soon as wave (E) takes over.
Tomorrow;
the goal here is to identify an impulse wave to the upside to begin wave ‘A’ of (E) again.
Watch for five waves up to complete tomorrow.
GBPUSD
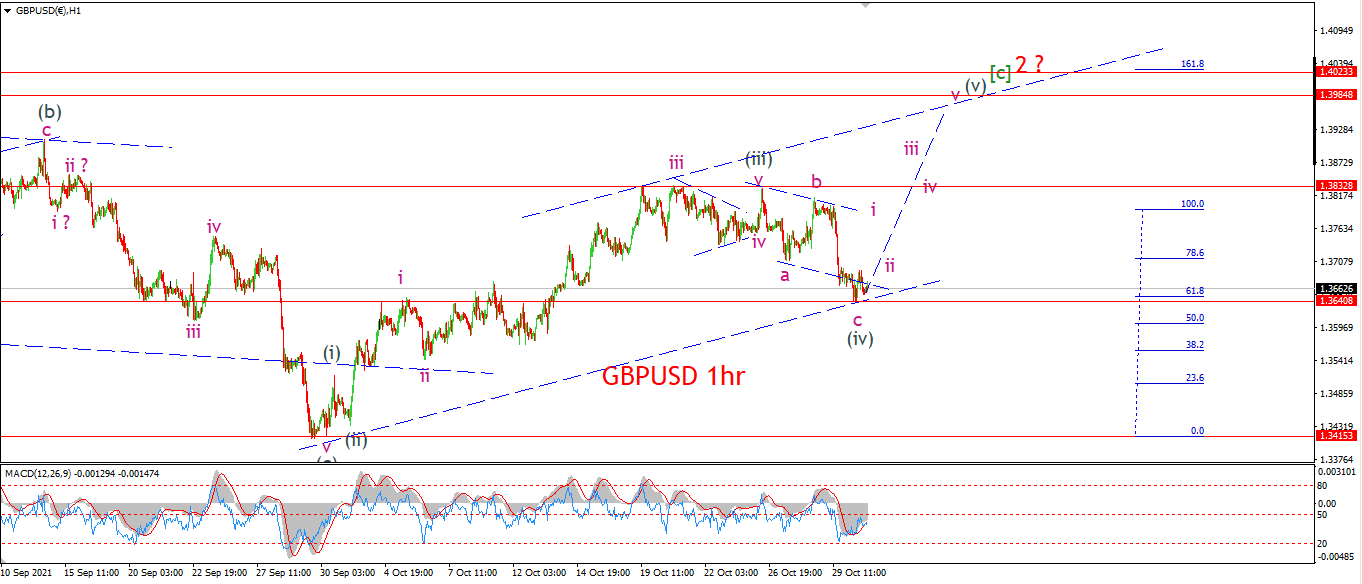
GBPUSD 1hr.
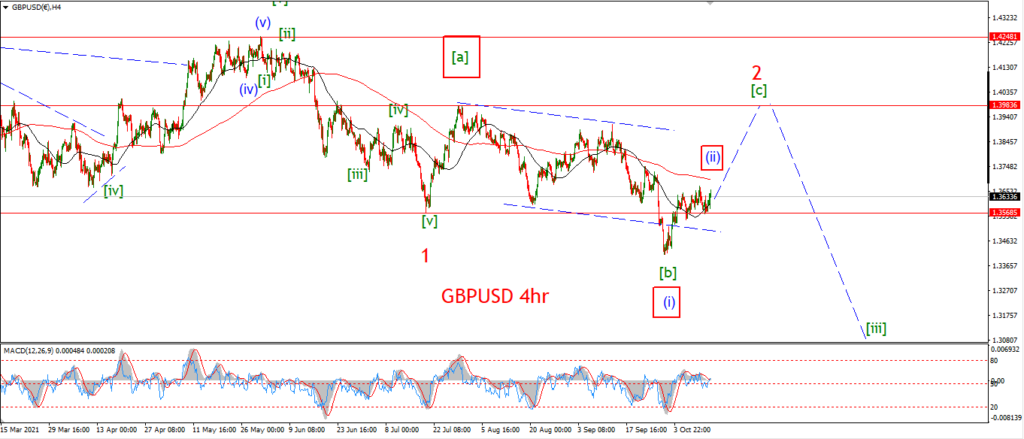
GBPUSD 4hr.
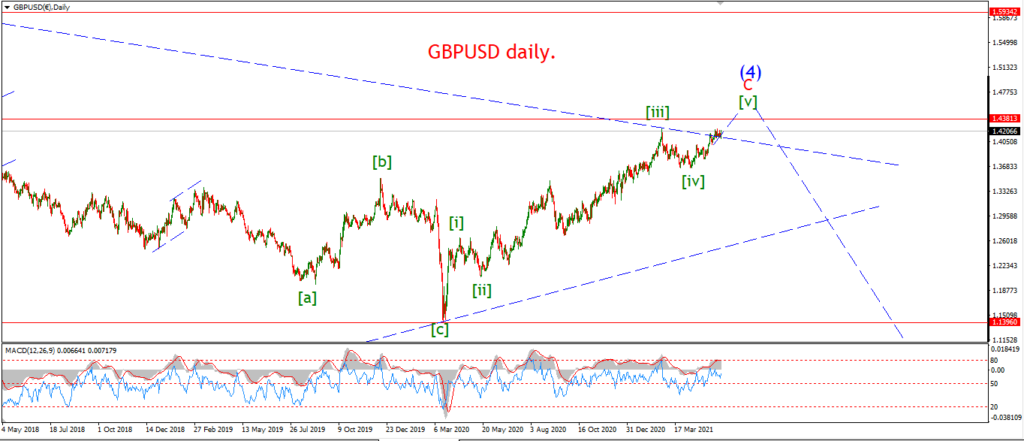
GBPUSD daily.
The short term count in cable has not cleared up yet,
the price does seem to be making an effort to turn higher,
but the very slight new low this morning has forced a rethink of the pattern in wave [c] today.
I am still tracking five waves up,
but now we really need wave (v) of [v] to get going to carry up to the target at 1.3984.
Tomorrow;
Watch for todays low to hold at 1.3540.
Wave ‘i’ of (v) should push up towards 1.3800 again.
USDJPY.
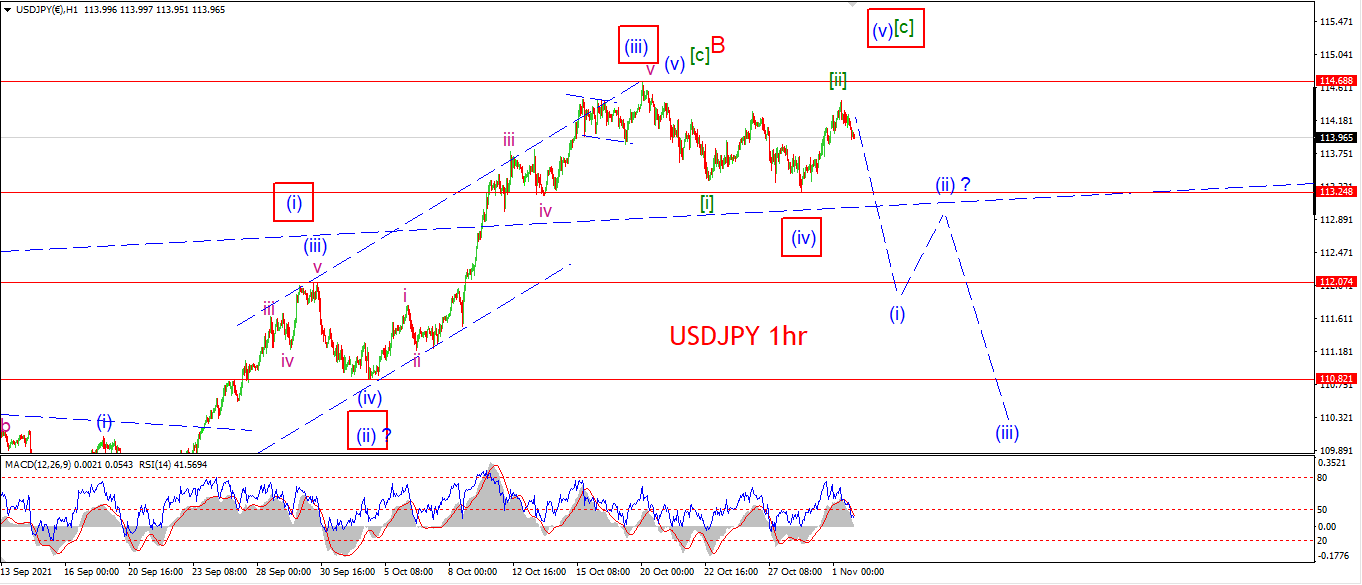
USDJPY 1hr.
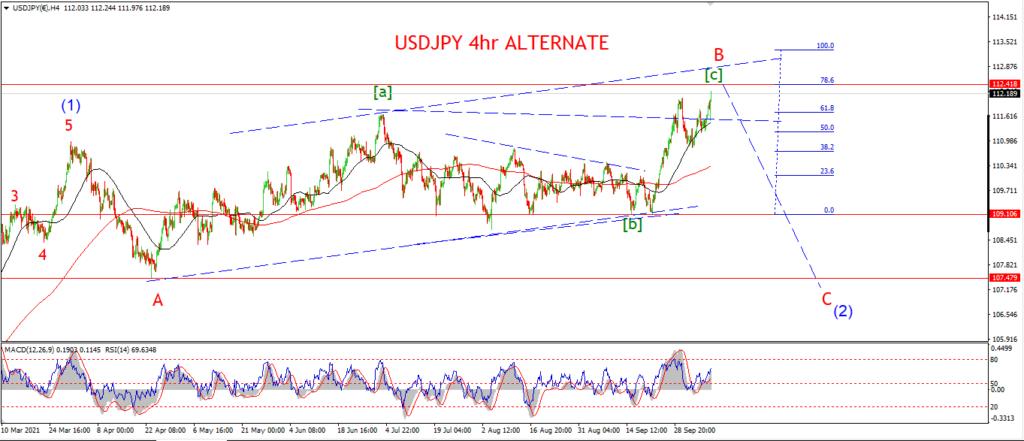
USDJPY 4hr.
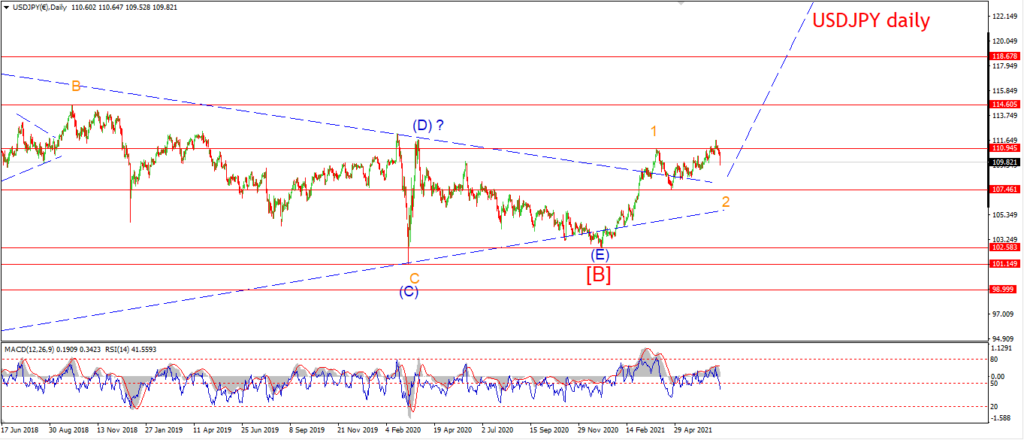
USDJPY daily.
I have introduced an alternate count this evening for this wave [c] of ‘B’ in green.
The price has not rolled over into wave ‘C’ yet,
and it came quite close to breaking to a new high today also,
so there is still a chance that wave [C] is completing here.
With wave (v) of [c] yet to top out.
This is the alternate scenario now as shown.
AS for the reversal pattern on the main count.
A drop below 113.24 again will signal wave (i) of [iii] has begun.
Tomorrow;
Watch for wave [ii] to hold below 114.68.
And wave (i) of [iii] to begin with a break of 113.24.
DOW JONES.
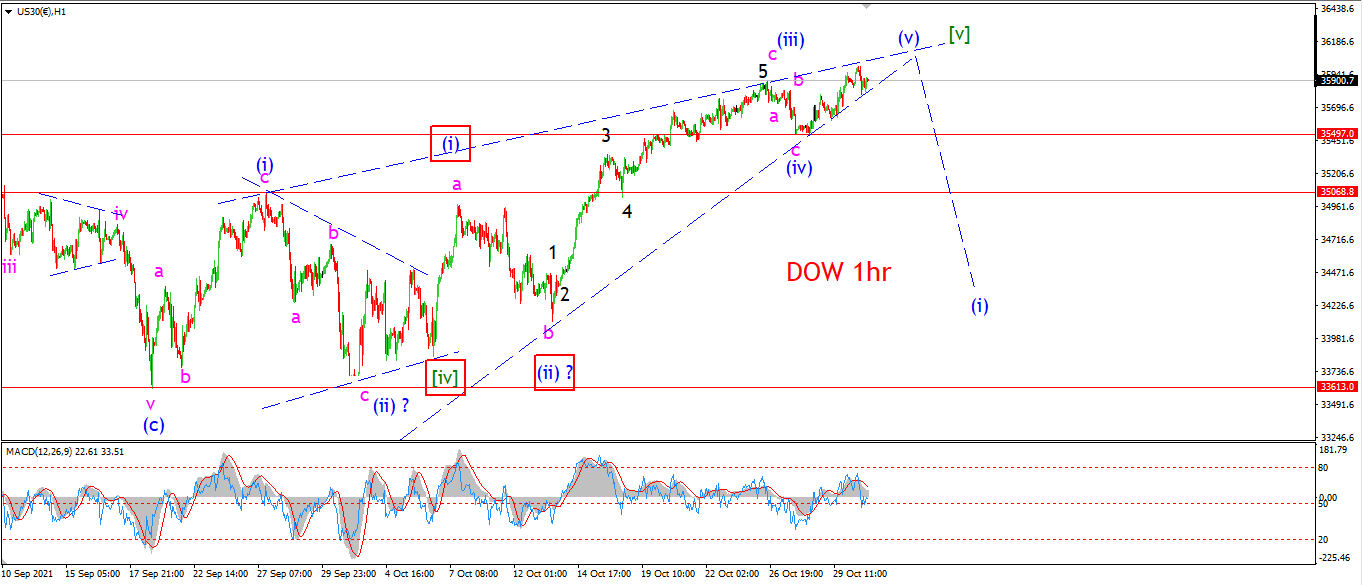
DOW 1hr.
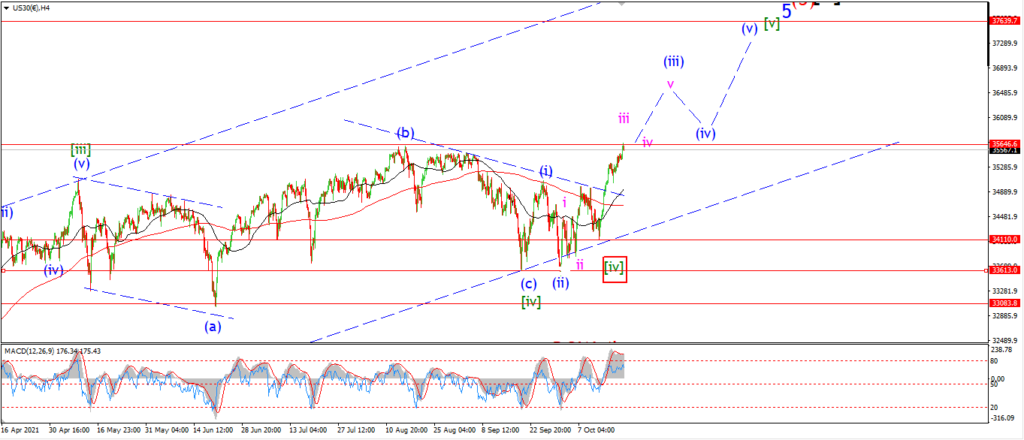
DOW 4hr
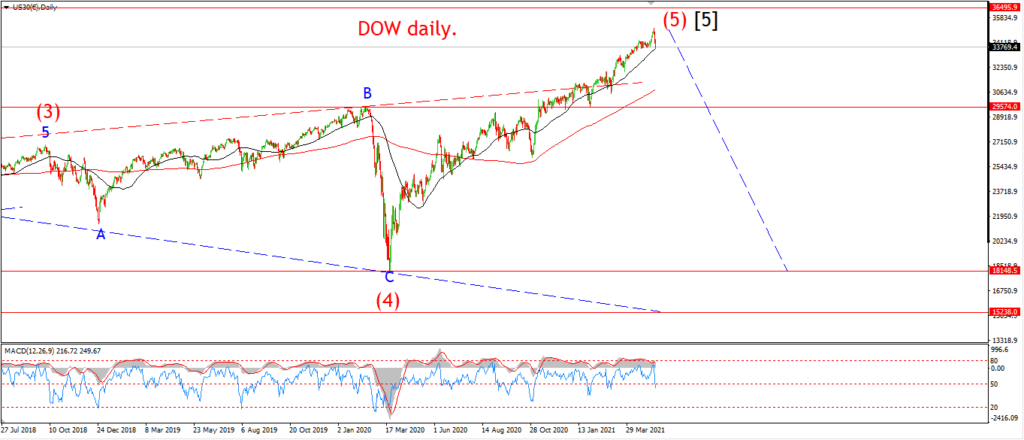
DOW daily.
Is it actually possible that we have reached the end of the road of this pattern again so quickly??
I am looking at the ending diagonal pattern today for wave [v],
and we can see that the wedge is tightening quickly now.
The best case scenario here is that wave [v] will just quench itself within that wedge and fall out in an impulsive manner to begin the reversal again.
In terms of the technical setup,
it seems the market is pretty much asleep at the wheel here.
Momentum is not exactly screaming exhaustion,
so there is of course room for another move higher with these conditions.
In short,
this pattern is close to the end,
the question is whether this pattern is correct or not.
I will just have to wait and see how this plays out.
Tomorrow;
If the price does fall sharply tomorrow that will be a vote in favor of this pattern.
GOLD
GOLD 1hr.
GOLD 4hr.
GOLD daily.
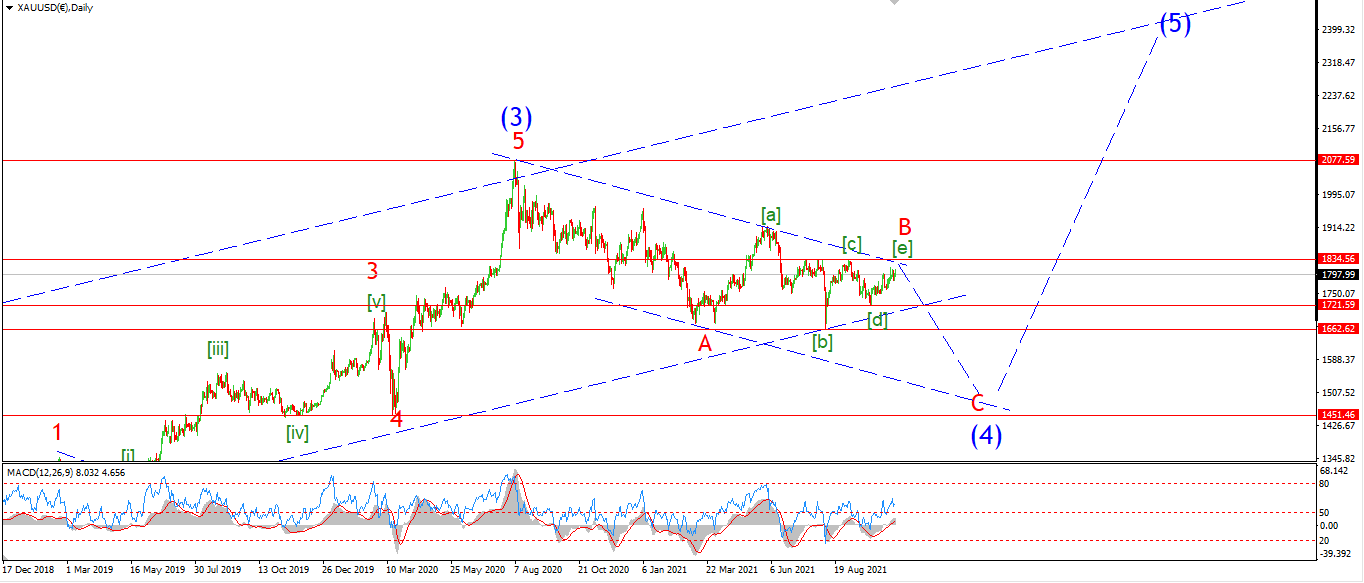
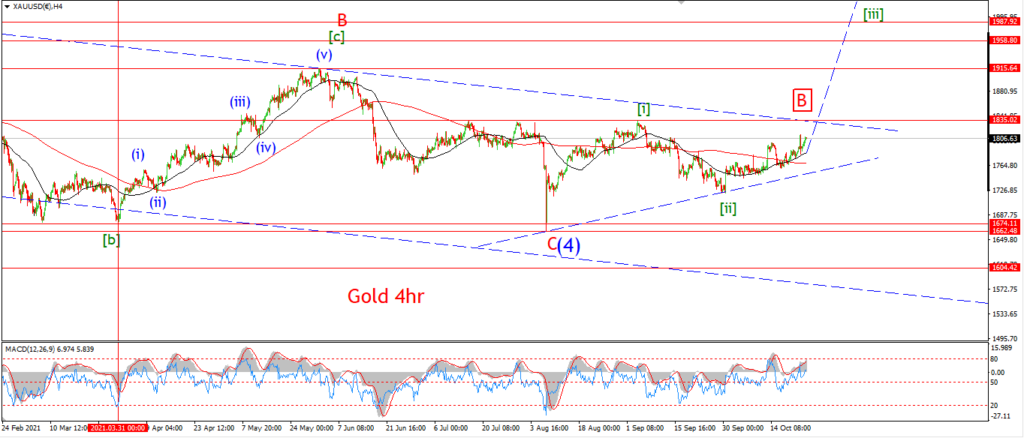
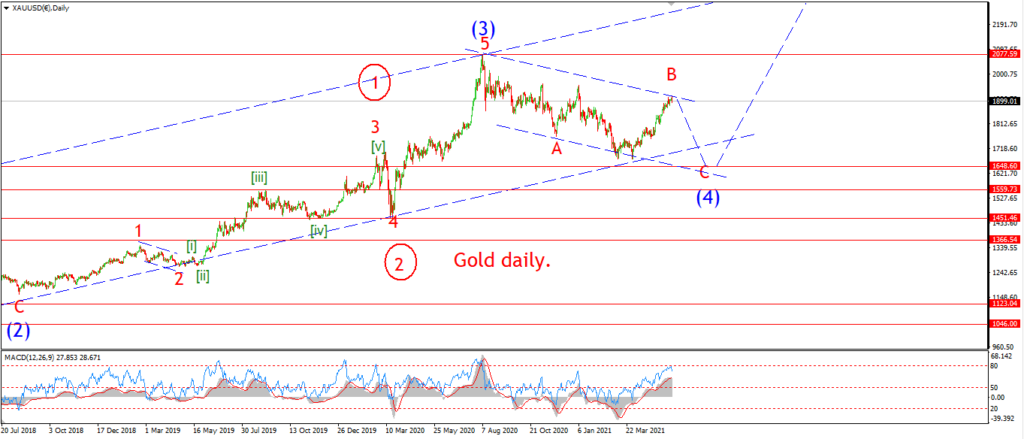
There has not been any sign to either rule in or out the bearish alternate count yet,
so I am holding onto it until we can completely rule it out.
I think if we see a push above 1835 again that would be enough for me to discard that triangle idea in wave ‘B’,
and then I will just concentrate on a big third wave up.
On the other side of that equation we have the 1721 low.
If that level breaks,
then we are looking at a real breakdown scenario into the 1550 area again
as per wave ‘C’ in the alternate count.
I don’t want this to happen,
but it is a possibility that I can’t ignore.
Tomorrow;
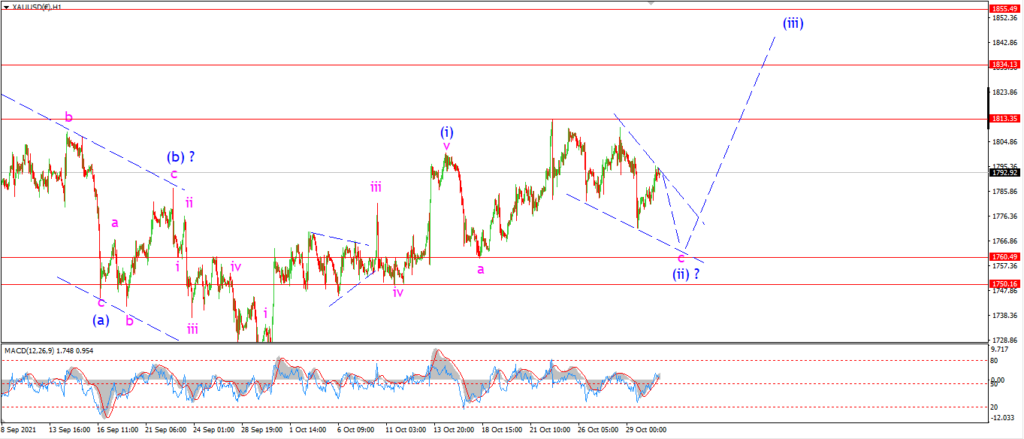
Wave (ii) needs to close out early this week and then accelerate higher into wave (iii) of [iii] by the end of this week.
That is the bottom line here!
Watch for a final low in wave ‘c’ of (ii) tomorrow and then a turn higher on Wednesday.
CRUDE OIL.
CRUDE OIL 1hr.
CRUDE OIL 4hr.
CRUDE OIL daily.
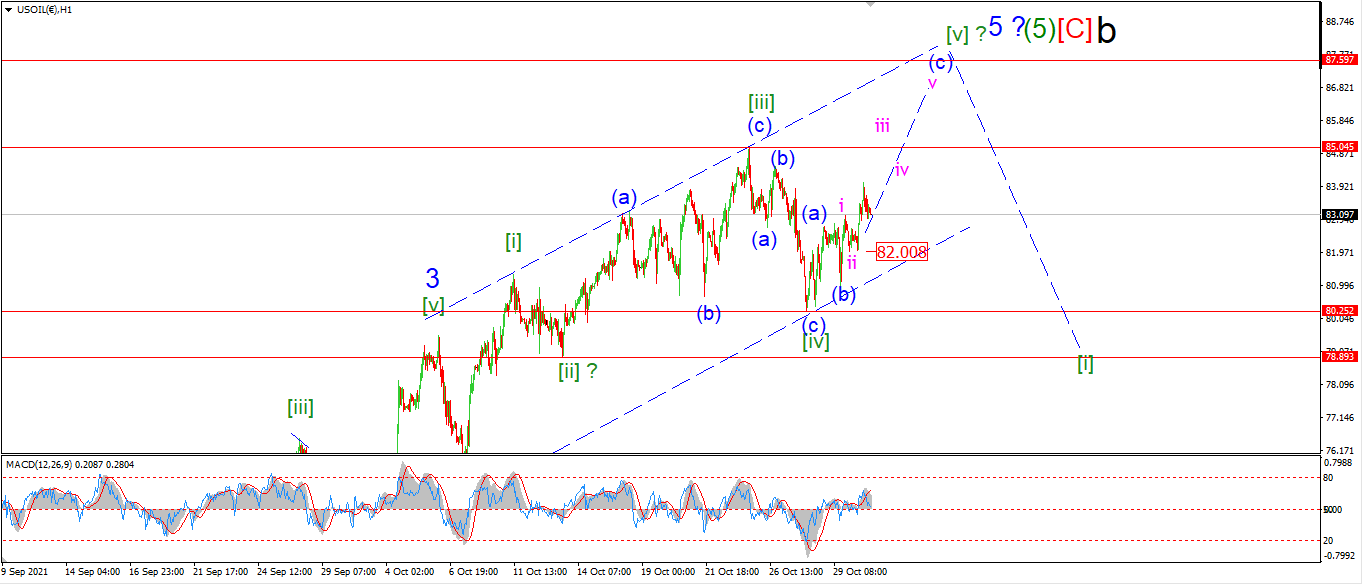
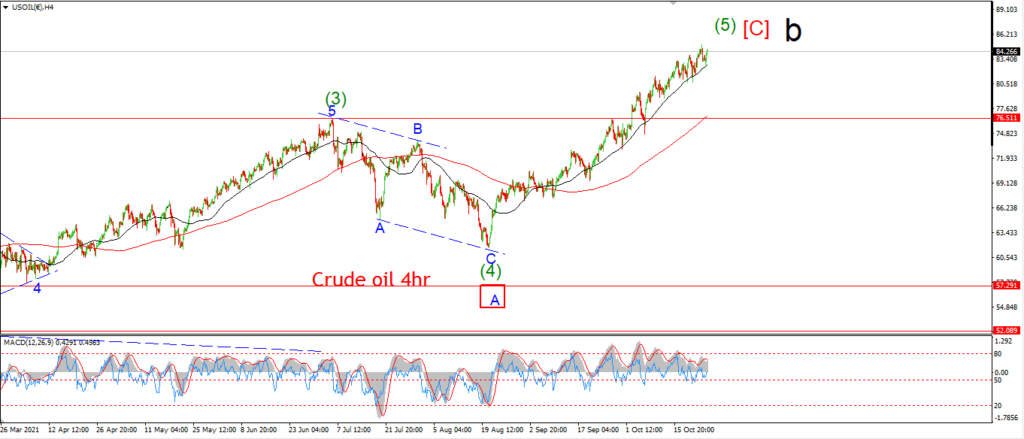
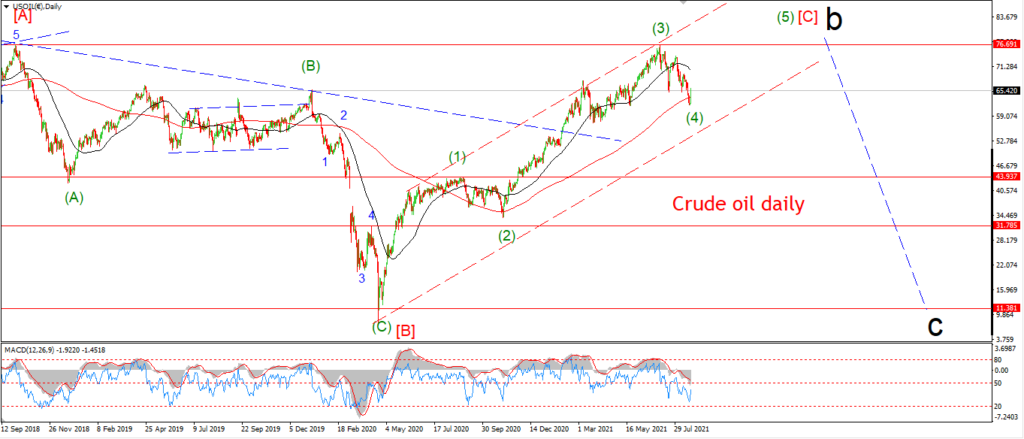
Crude is tracking well with a rally in wave (c) again today.
The price should trace out a five wave pattern higher in wave (c) of [v] this week.
and the initial target for that wave [v] high lies at about 87.00 again.
that will bring the price close to that upper trend line and complete three waves up.
This count will hold unless the price fall back below 82.25 again at the wave [iv] low.
If that happens I will consider that a signal that the top is in for wave ‘5’ blue.
Tomorrow;
Watch for wave ‘ii’ of (c) to hold at 82.08.
Wave ‘iii’ of (c) should continue higher again.
S&P 500.
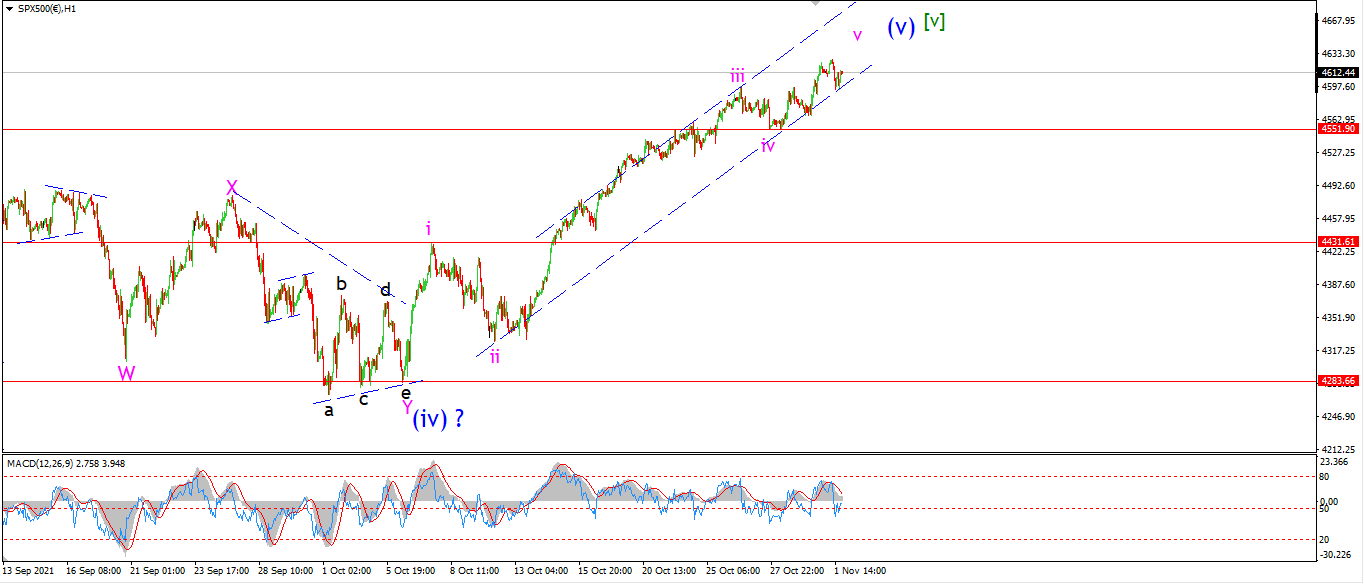
S&P 500 1hr
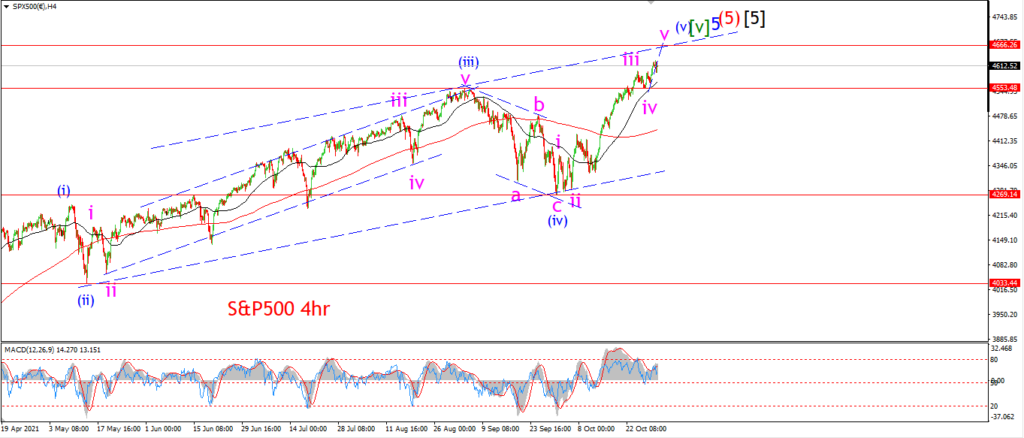
S&P 500 4hr
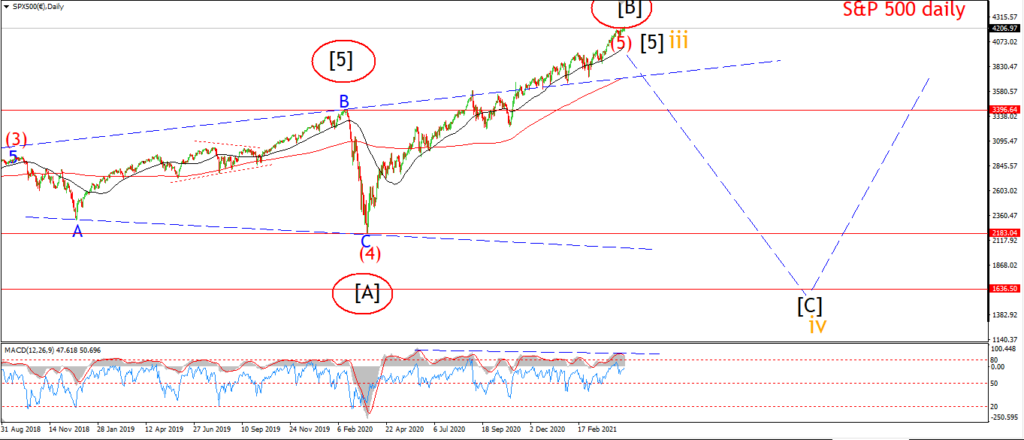
S&P 500 daily.
If you take a look at the 4hr chart you can see a classic fifth wave momentum divergence is now well established here.
The recent peak in MACD and RSI occurred in the dead center of wave ‘iii’ of (v).
And now we have a rising price in wave ‘v’ of (v) as the momentum falls off quietly.
This is not an immediate sign that the top is in,
but it is of course exactly what we should expect to see at the top.
The pattern in wave (v) is now close to completing a five wave structure again.
Wave ‘v’ of (v) does not have a clean five wave internal pattern just yet,
so I will allow this pattern time to clean up.
Suffice to say that this week should be more than enough to sort it out.
SILVER.
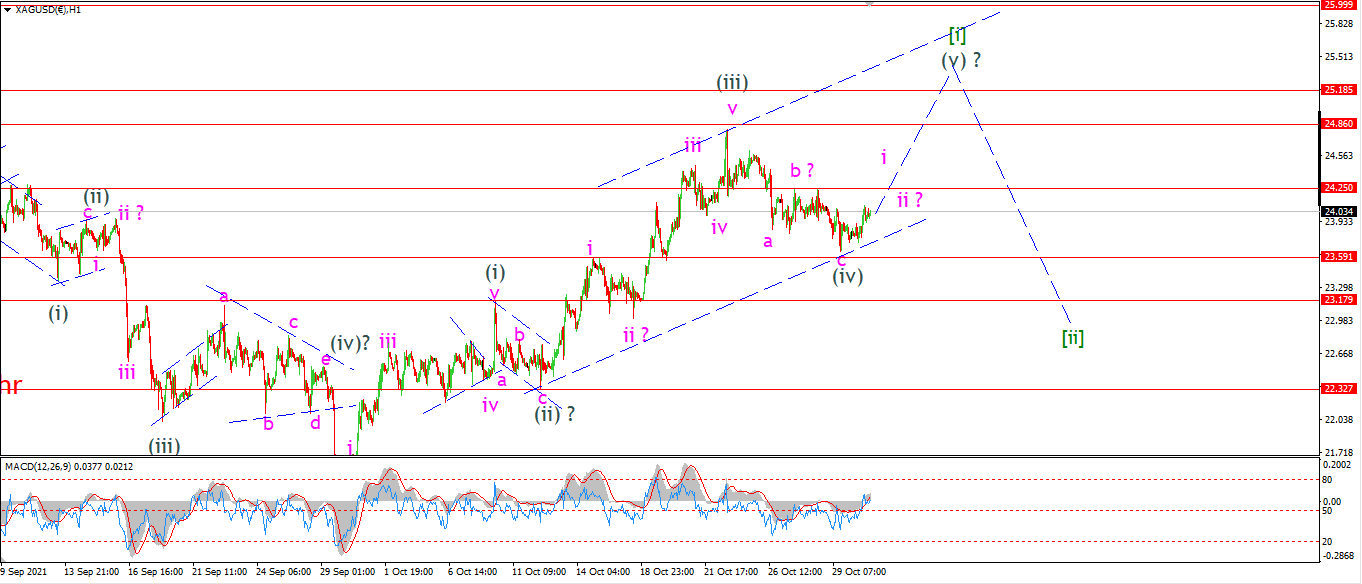
SILVER 1hr
SILVER 4hr.
SILVER daily.
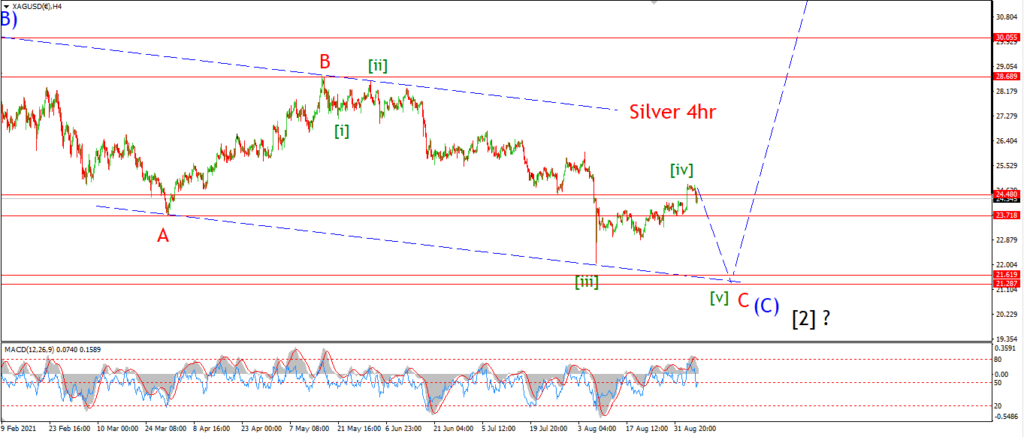
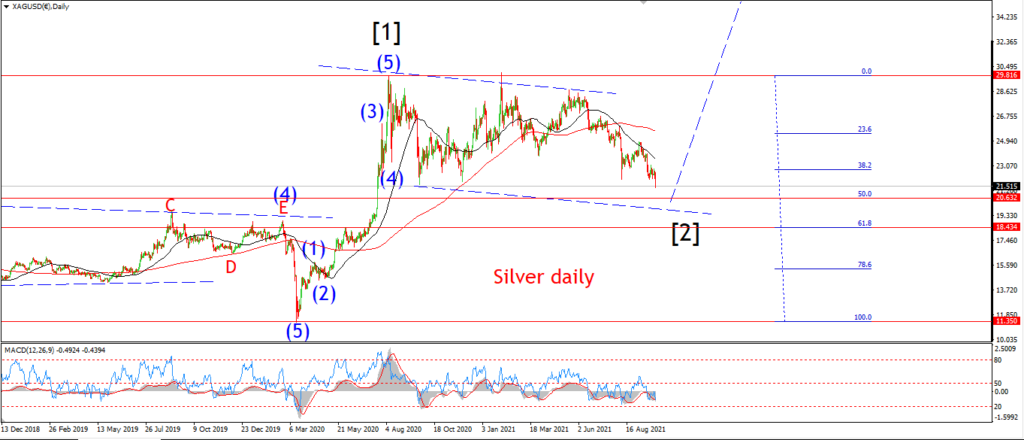
So far the key support levels are holding in silver as the price moves a little higher today.
wave (iv) is holding above the wave (i) high at 23.17,
but I will admit that todays small price rise is not exactly impulsive looking yet.
Wave ‘b’ of (iv) lies at 24.25,
so I would like to see a break of that level to signal wave ‘i’ of (v) has begun.
Tomorrow;
Watch for the wave (i) high to hold and wave ‘i’ of (v) to push above 24.25.
BITCOIN
BITCOIN 1hr.
BITCOIN 4hr.
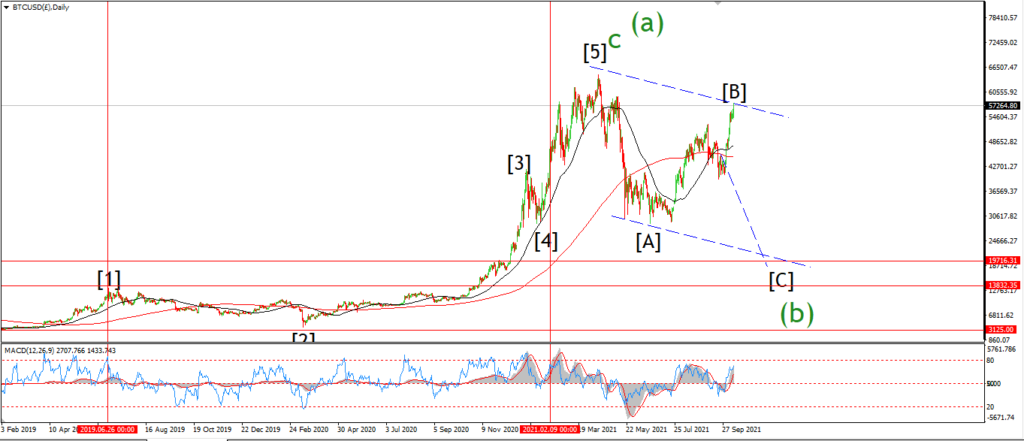
BITCOIN daily.
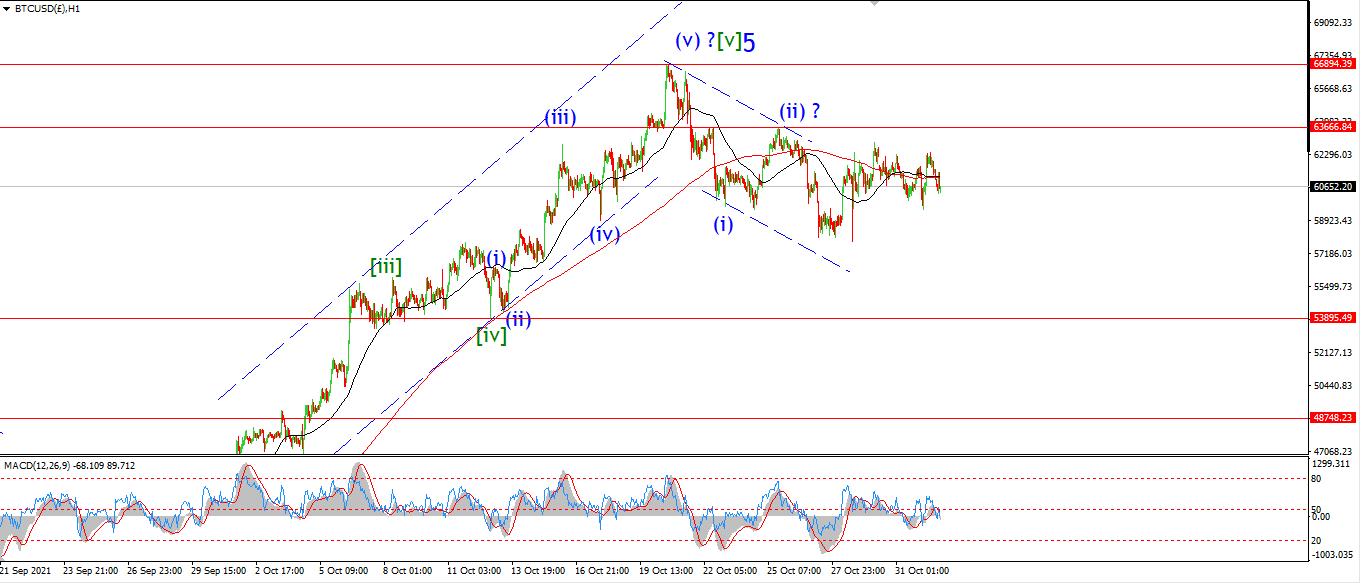
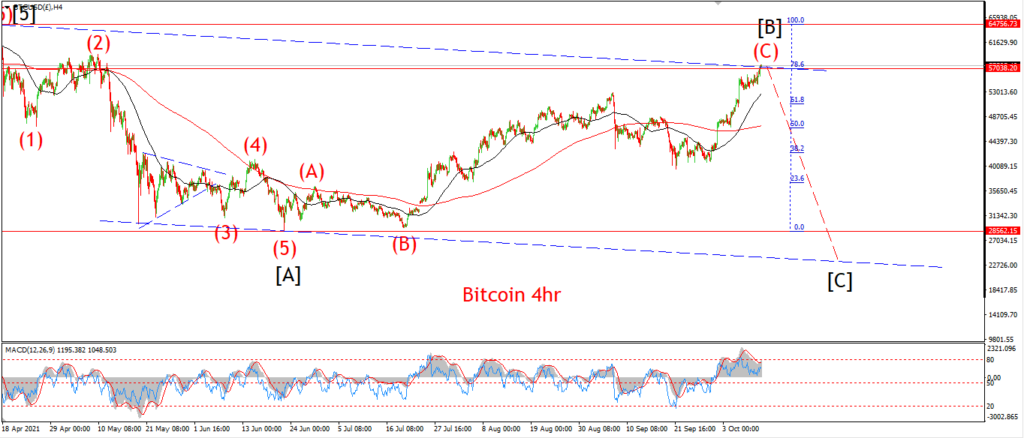
Topping in wave [B].
FTSE 100.
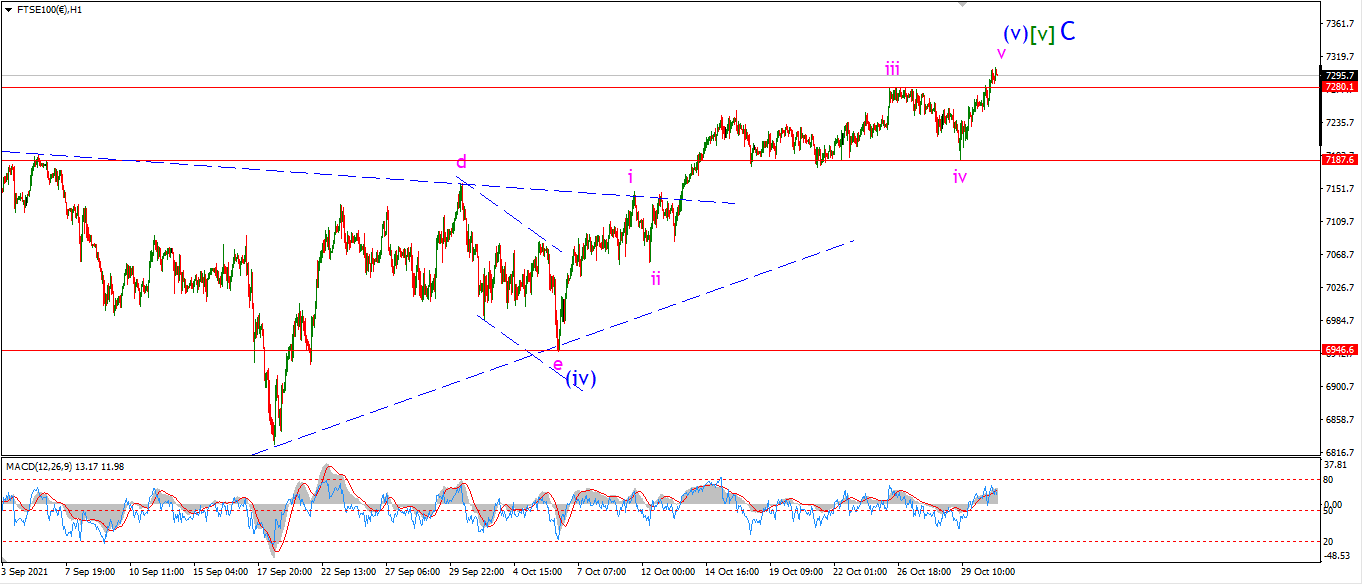
FTSE 100 1hr.
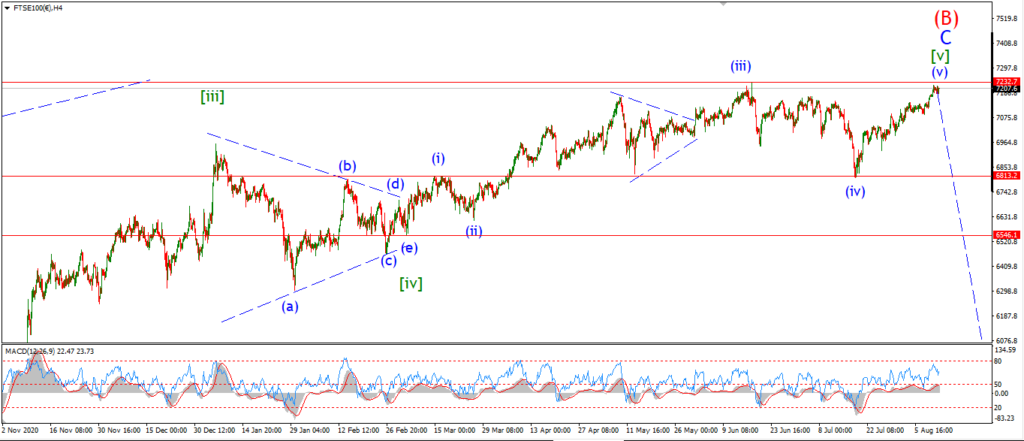
FTSE 100 4hr.

FTSE 100 daily.
Complete wave (B).
DAX.
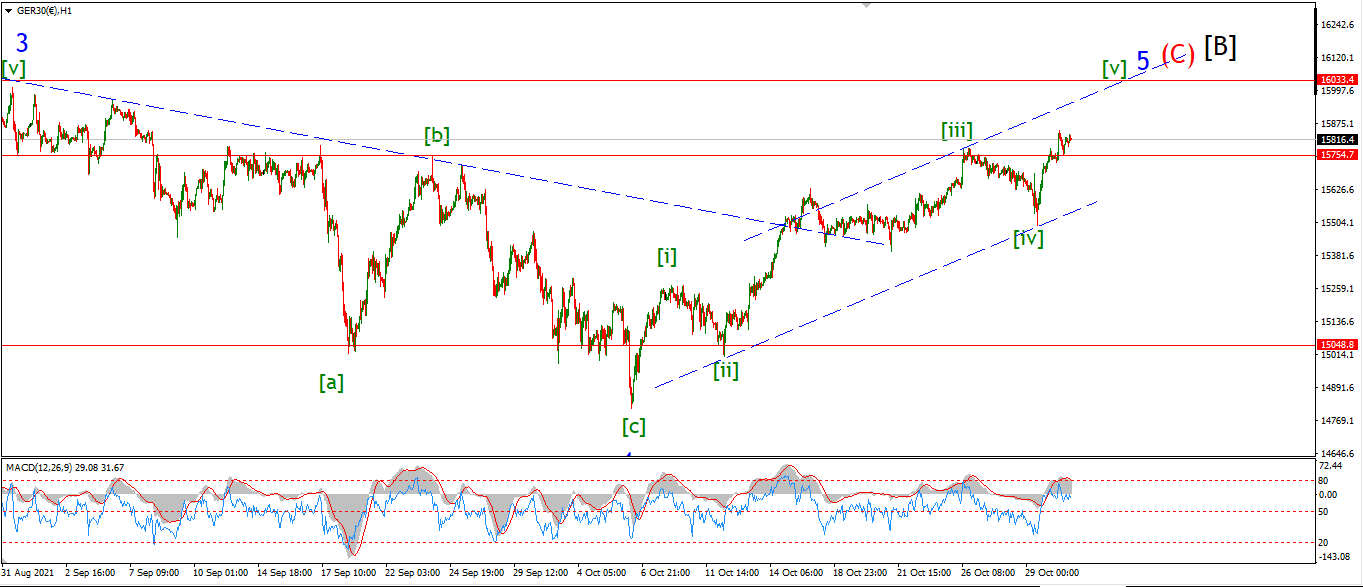
DAX 1hr
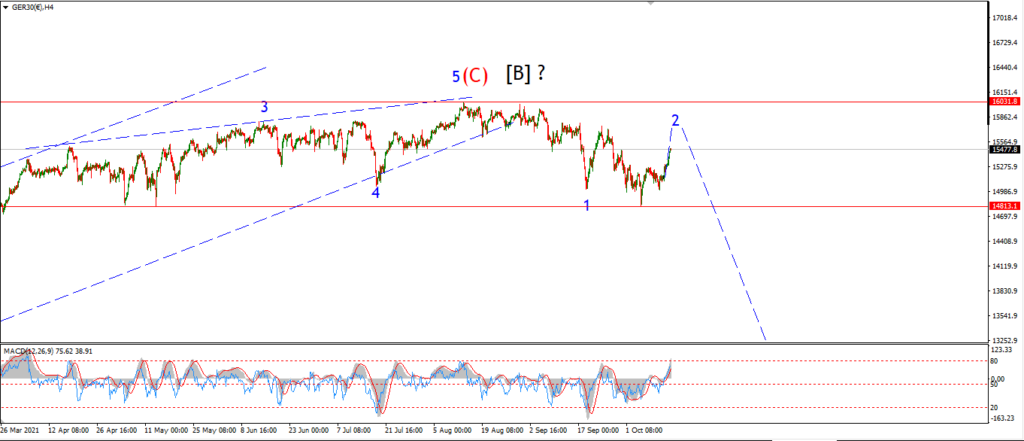
DAX 4hr
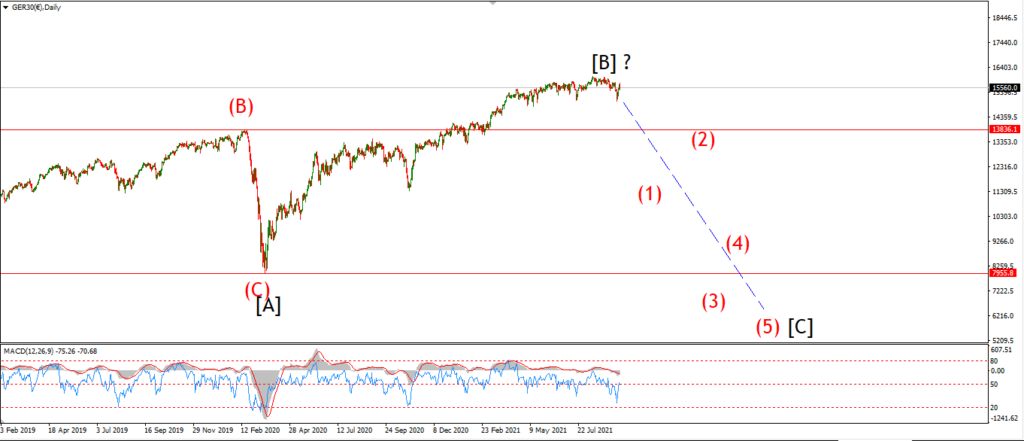
DAX daily.
Topping out in wave [B].
NASDAQ 100.
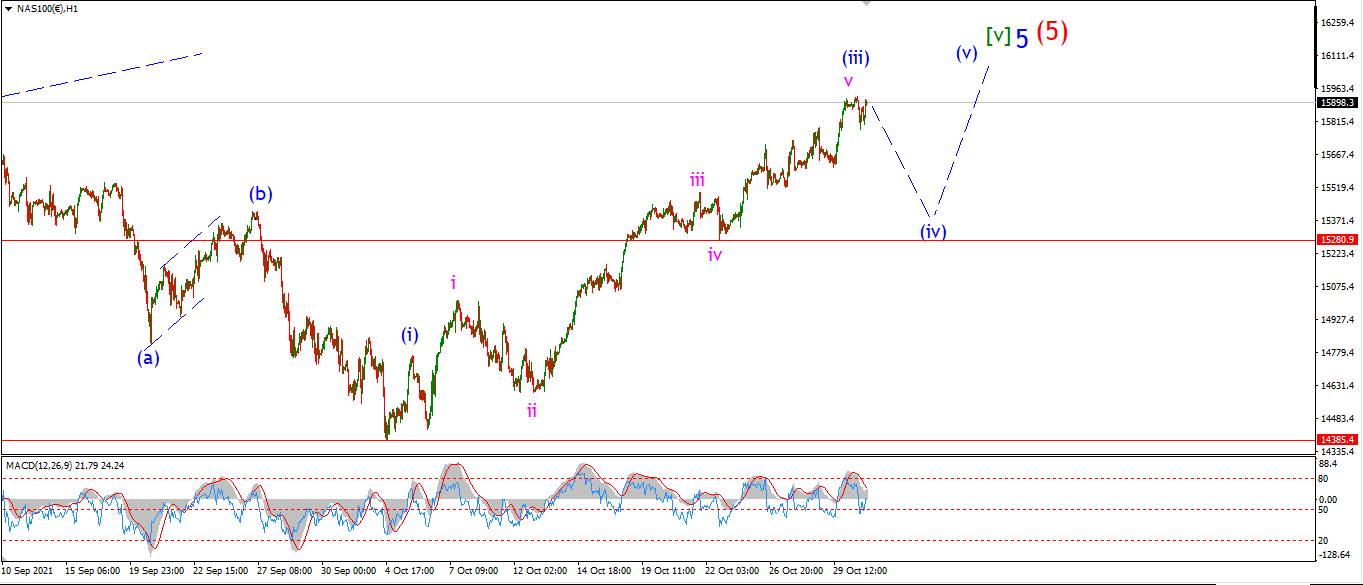
NASDAQ 1hr
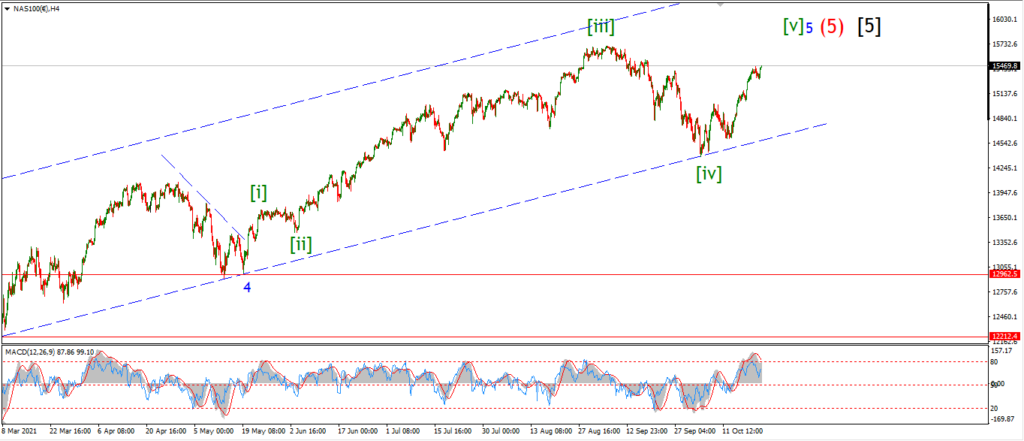
NASDAQ 4hr.
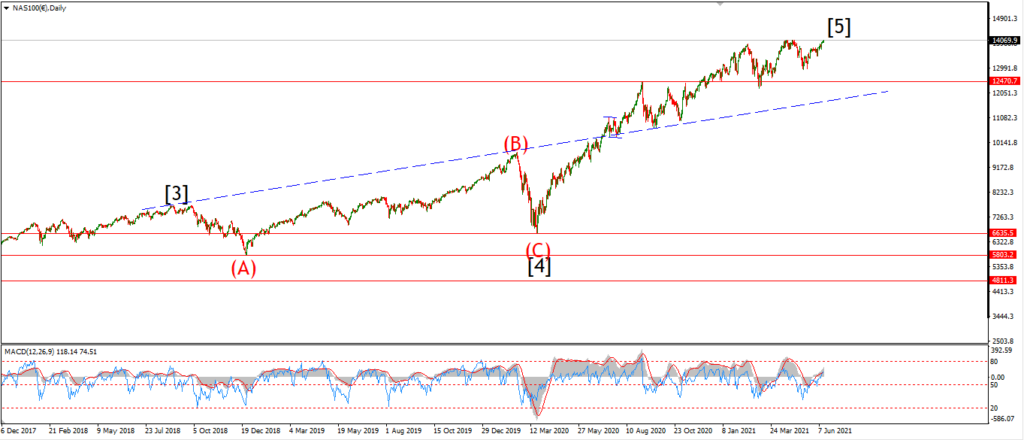
NASDAQ daily.
Is this it for the Nasdaq??