
Good evening to one and all,
God’s Blessings to you all tonight.

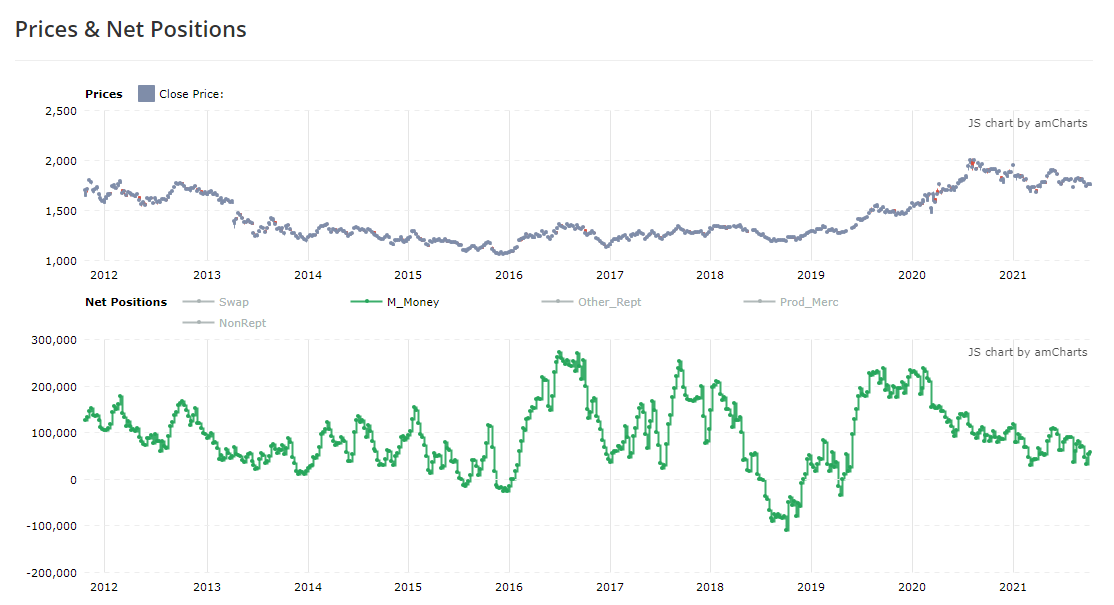
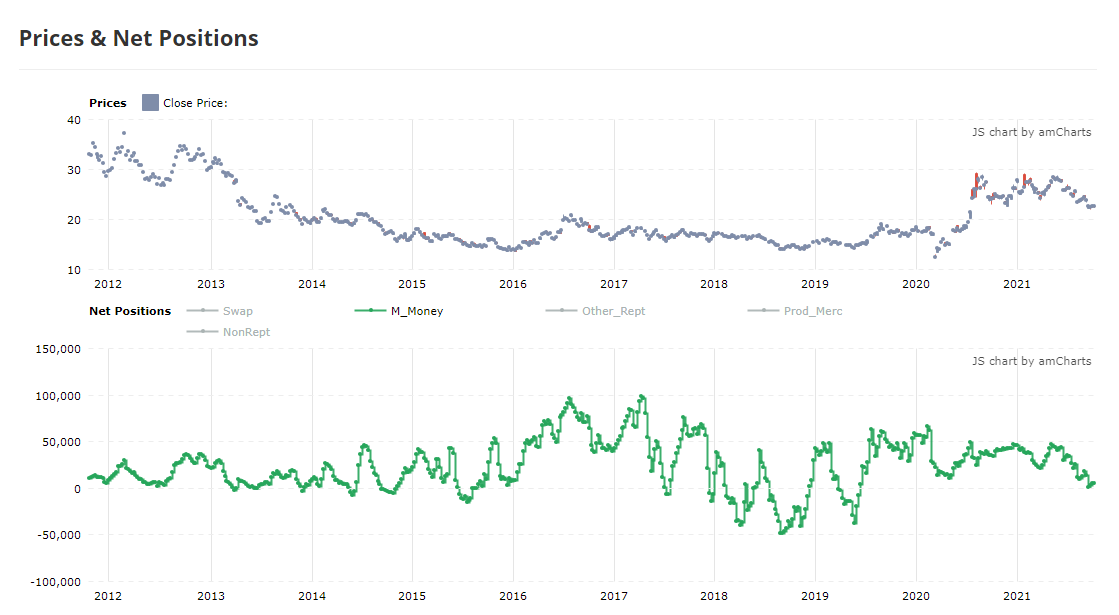
I am watching the COT positioning stabilizing at previous lows now that the price is bottoming again in the metals market. This is bullish…………
EURUSD.
EURUSD 1hr.
EURUSD 4hr.
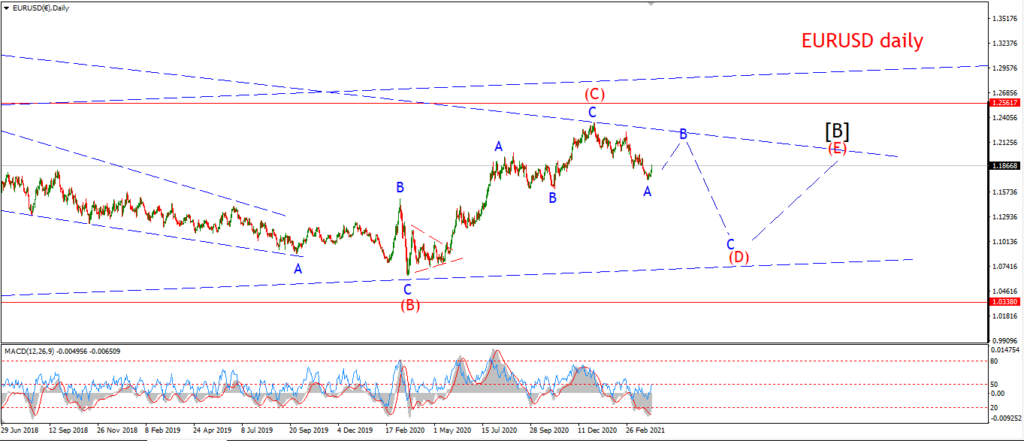
EURUSD daily.
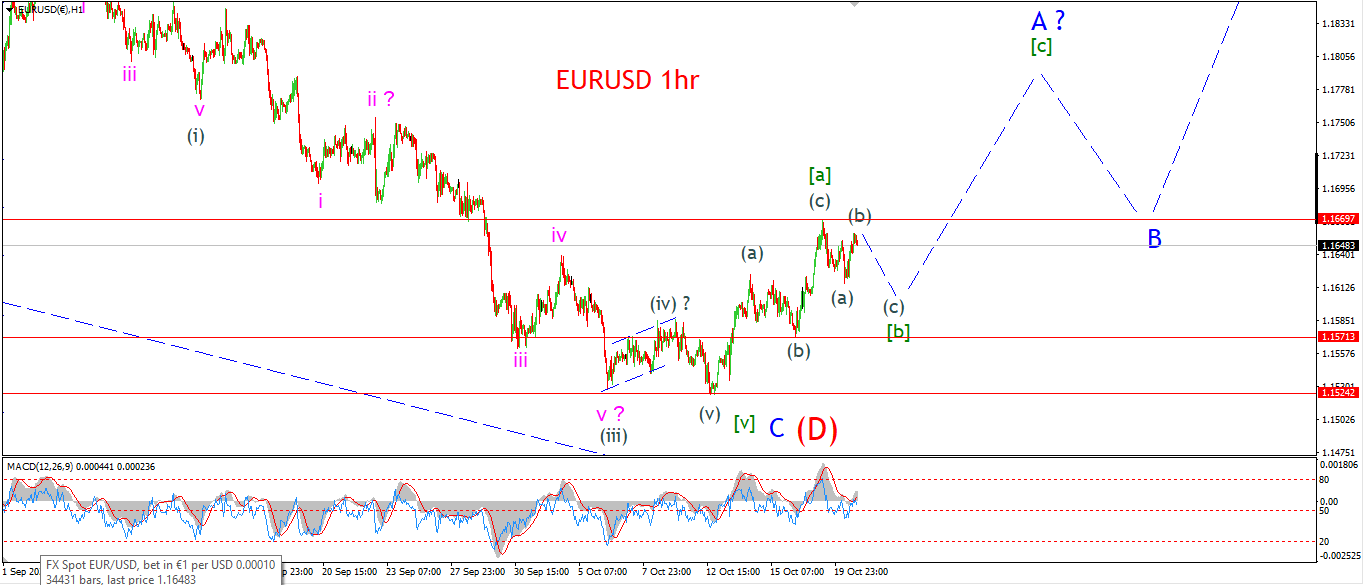
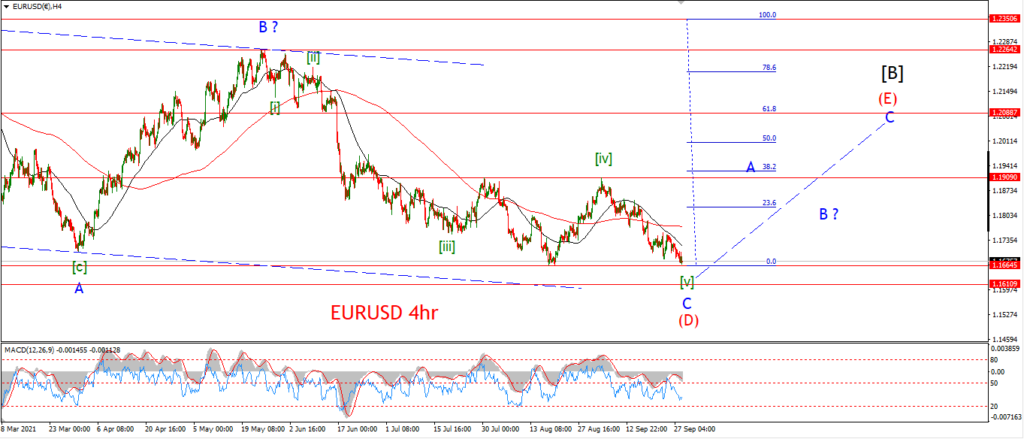
Wave [b] is now moving in a sideways range today.
The price declined in three waves into wave (a),
todays rebound is labelled as wave (b),
although it is hard to know if wave (b) is complete just yet.
I do expect we will see another drop into wave (c) over the coming days to complete three wave down.
Wave [b] should find support at the 1.1570 area.
Tomorrow;
Watch for wave (b) to hold below 1.1669.
Wave (c) down should fall again in five waves.
GBPUSD
GBPUSD 1hr.
GBPUSD 4hr.
GBPUSD daily.
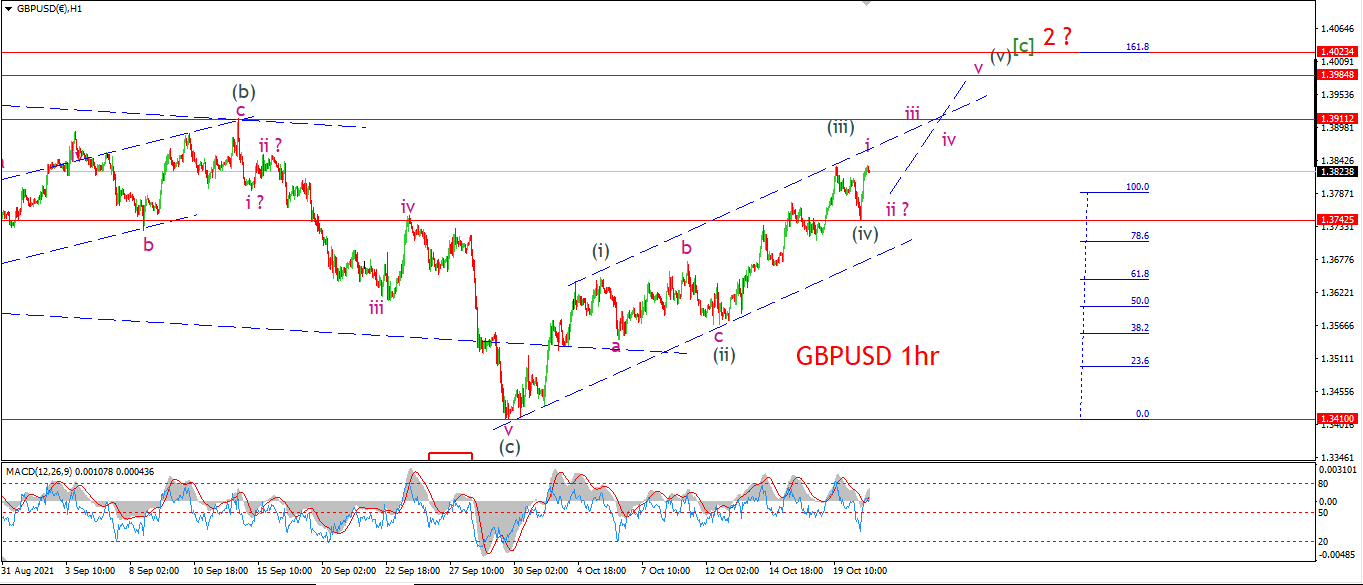
I am labelling todays lows as wave (iv) of [c].
The pattern is moving along quite quickly now.
And the rise off wave (iv) has begun a five wave rally in wave (v).
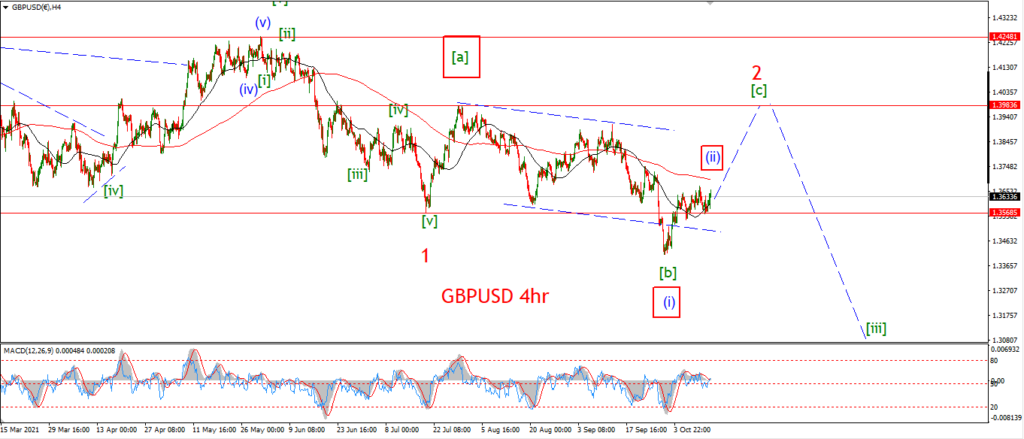
Wave (v) of [c] is expected to rally into the 1.3984 level at a minimum.
This level marks the high of wave [a],
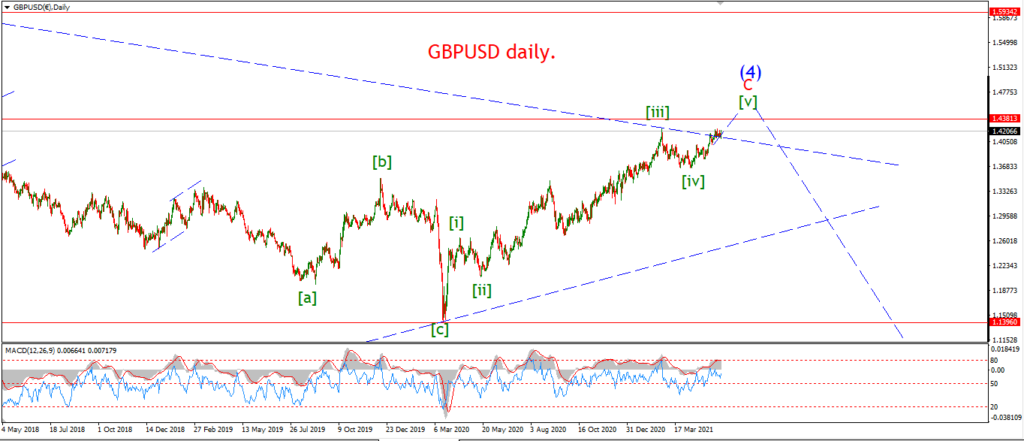
and as such an expanded flat should complete above that wave [a] high.
Tomorrow;
Watch for wave (v) to continue higher in five waves and hit that target level by Friday evening.
USDJPY.
USDJPY 1hr.
USDJPY 4hr.
USDJPY daily.
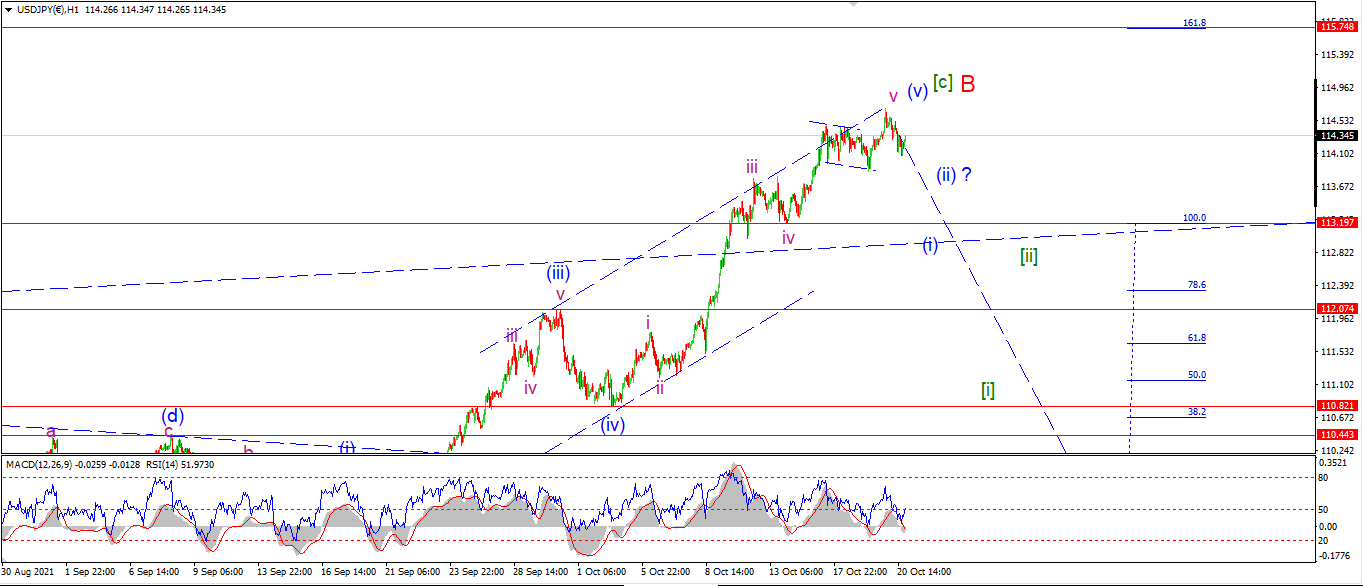
We have five wave up complete in wave ‘v’ at this weeks high.
And todays trade did create a small decline so far.
It remains to be see if this decline develops into an impulsive move as expected.
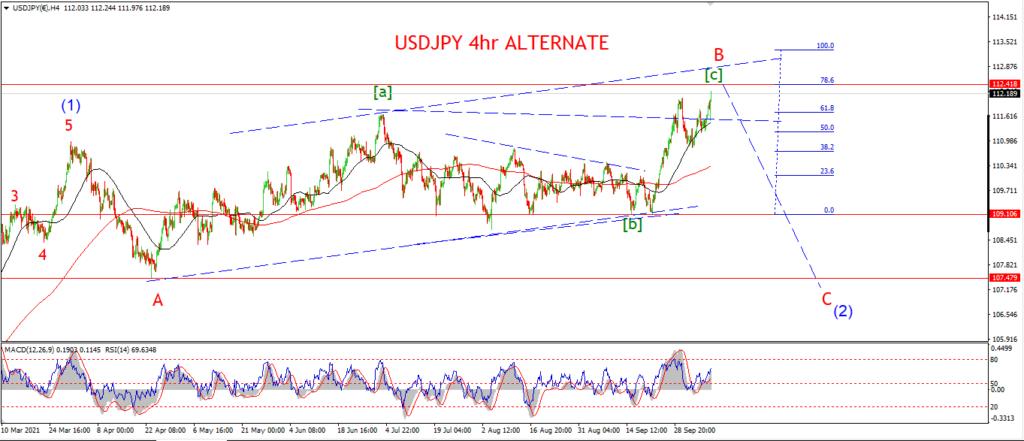
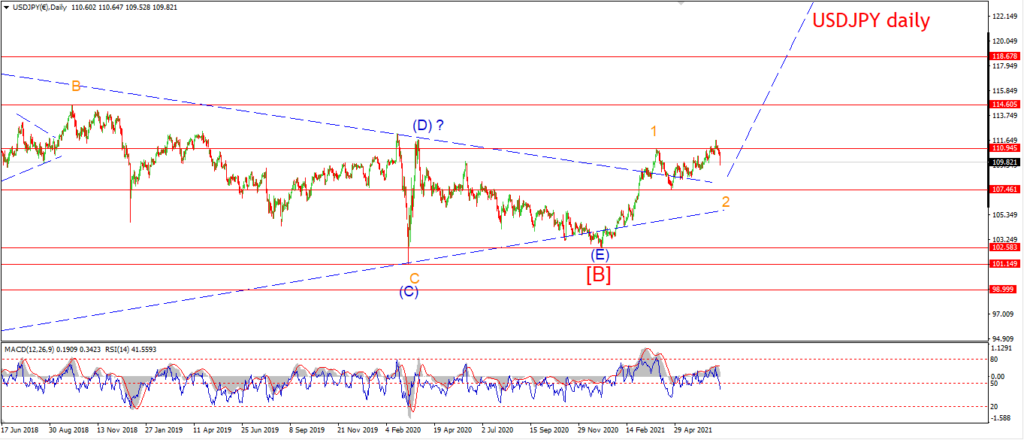
A significant decline is on the cards for USDJPY over the coming weeks,
but I will just have to wait for that initial five waves down to signal it is underway.
Tomorrow;
Watch for a five wave decline in wave (i) to form by the end of this week.
A break of the wave ‘iv’ low at 113.19 will be a good sign that the market is beginning a turn.
DOW JONES.
DOW 1hr.
DOW 4hr
DOW daily.
Ok,
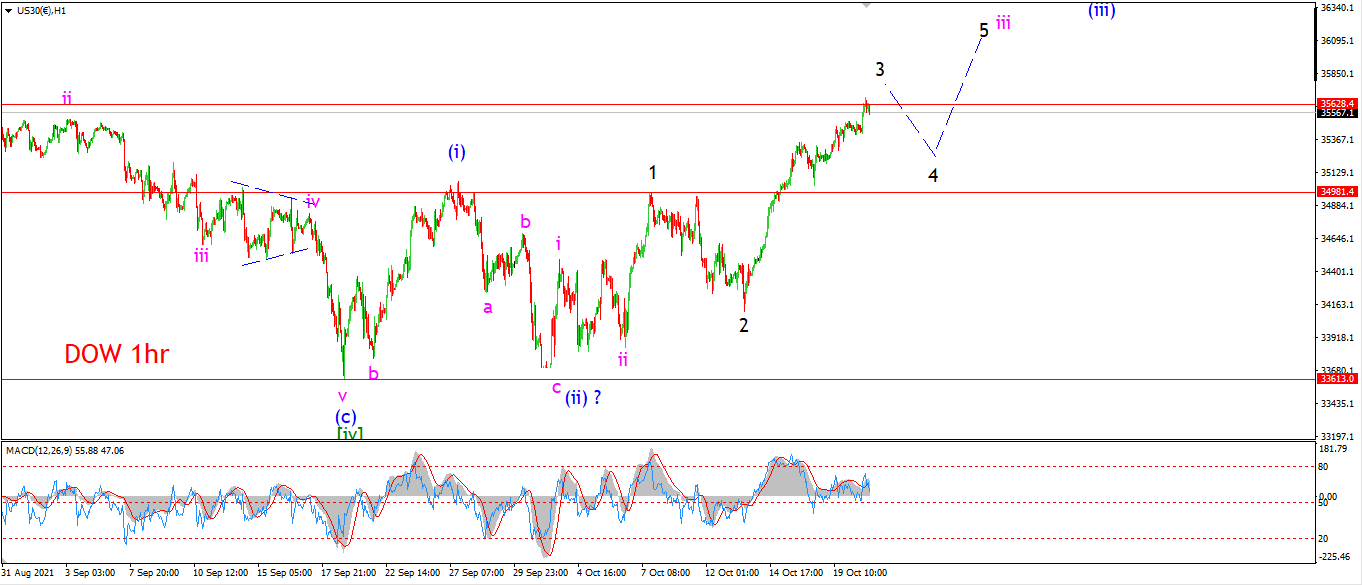
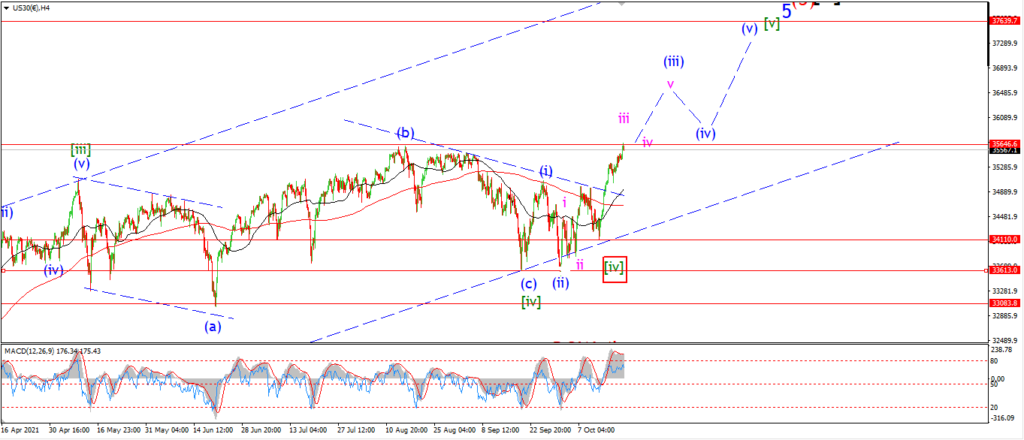
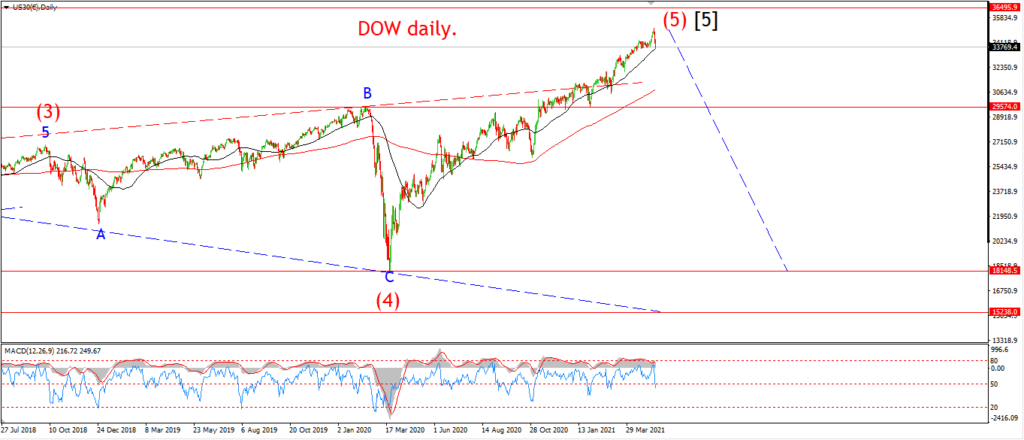
the market has burst my bubble today and broken to a very slight new high.
Of course this rules out my short term bearish count.
And now I have to switch to the alternate count.
Take a look at the 4hr chart.
This shows two scenarios for wave [iv] green.
A running flat correction is the main count and that completed at 33613.
A series of 1,2 waves off that low is tracing out wave [v] up now.
If this count is correct,
then this weeks rally is part of wave ‘iii’ of (iii).
The other idea for wave [iv] is a triangle in wave [iv] green.
In this case wave [iv] only complete this week.
and now wave [v] has begun with an impulsive move in wave (i) of [v].
Tomorrow;
The count for wave [v] will now allow for a continued rally into the middle of November.
Wave ‘iii’ up will complete soon.
GOLD
GOLD 1hr.
GOLD 4hr.
GOLD daily.
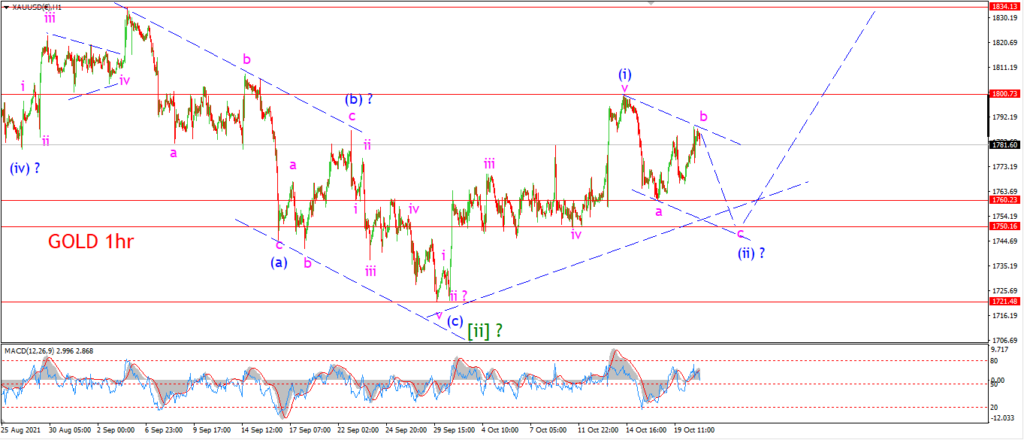
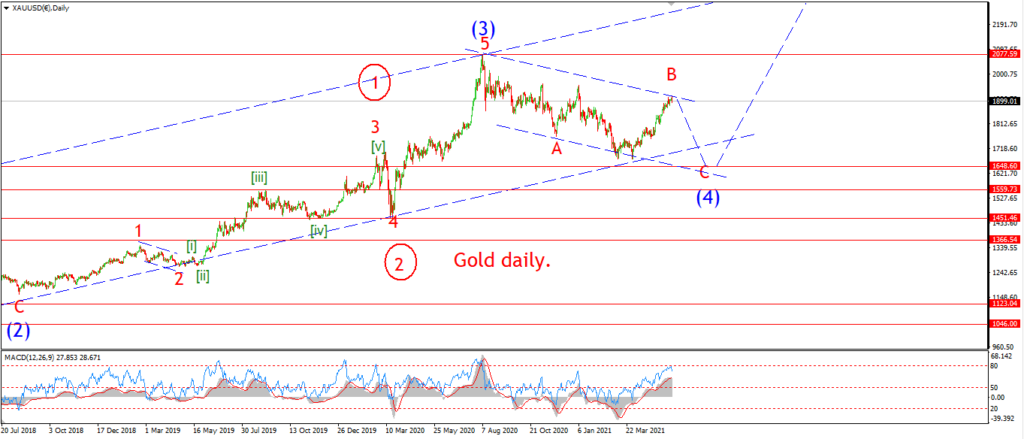
I have switched to the alternate count for wave (i) and (ii) today
simply because the action over the last week seems to be forming a large three wave move lower as shown.
The rally this week has formed a lower high,
and overall this move has formed a three wave pattern.
Todays top takes the wave ‘b’ label,
and now I expect wave ‘c’ to begin and fall back into that 1750 level over the coming few sessions.
Tomorrow;
watch for wave ‘b’ to top out then reverse by tomorrow evening.
The minimum target for wave ‘c’ lies at 1760 with a break of the wave ‘a’ low.
CRUDE OIL.
CRUDE OIL 1hr.
CRUDE OIL 4hr.
CRUDE OIL daily.
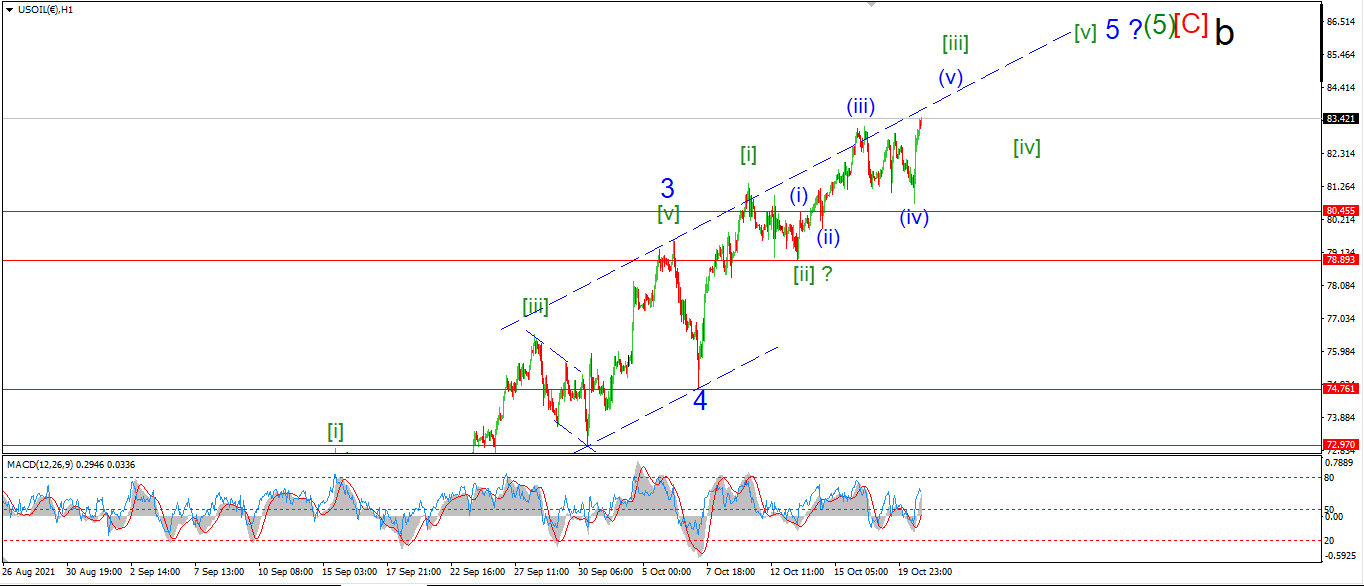
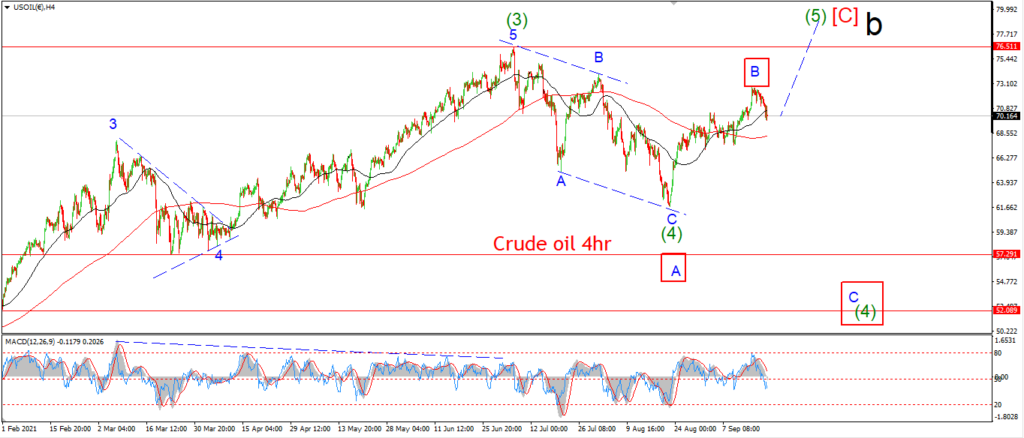
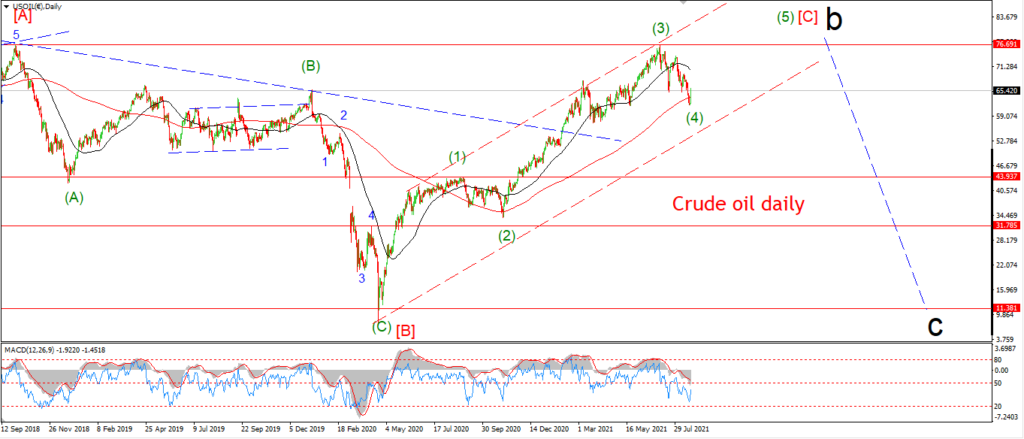
The correction in wave (iv) did trace out an overall three wave pattern into the lows of todays session.
The low held above the wave (i) high only just!
but so far this pattern is valid in wave [iii].
the price has moved higher again today into wave (v) of [iii].
We should see a top form in wave (v) of [iii] by the end of this week.
That should lead to another three wave decline in wave [iv] next week.
Tomorrow;
Watch for wave [iii] to complete with a push above the trend channel line again.
The wave (i) high at 80.45 must hold.
S&P 500.
S&P 500 1hr
S&P 500 4hr
S&P 500 daily.
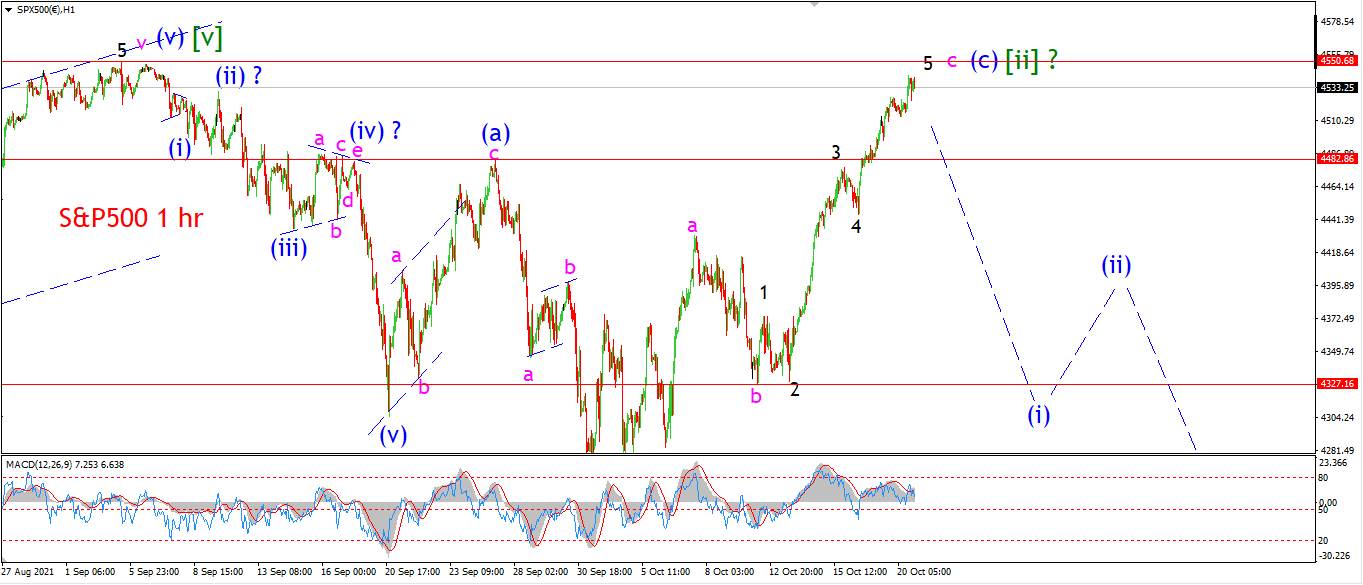
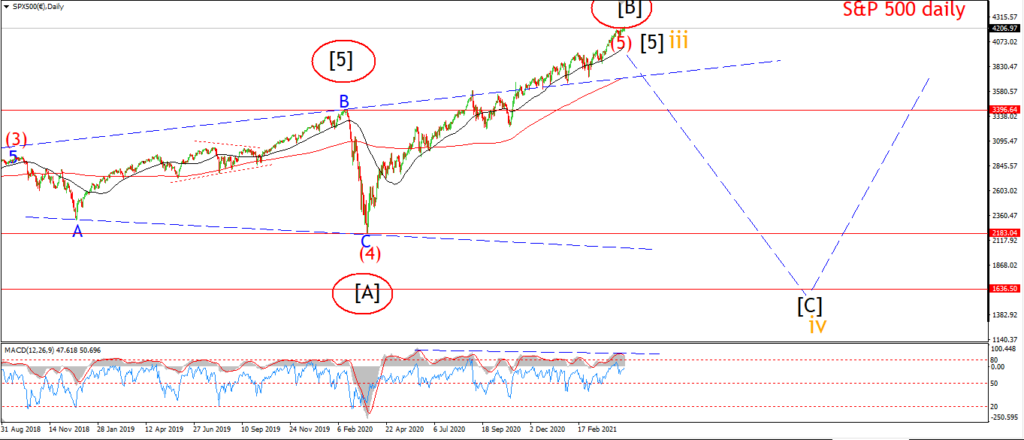
The S&P is holding below the all time highs this evening and so far but I suspect this index will go the way of the others tomorrow and pop to a new all time high.
It would be very odd to call for an extension of the rally in the Dow and then hope for the S&P to hold below the highs.
With that in mind,
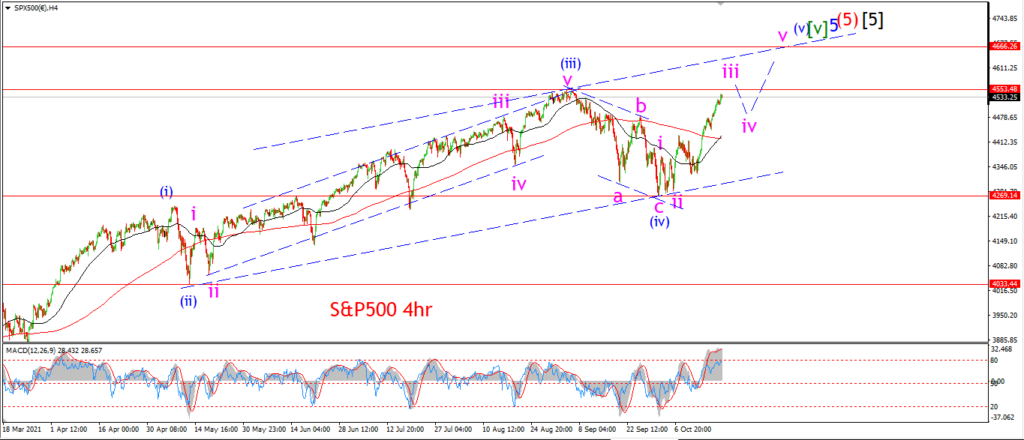
I have shown the alternate count for wave [v] green on the 4hr chart.
The recent decline is shown as a three wave correction in wave (iv).
And now we have a five wave rally underway up into wave (v) of [v].
If this count is correct,
then the rally this week is now tracing out wave ‘iii’ of (v).
Wave (v) now has a target area at 4670 at the upper trend channel line.
Tomorrow;
I suspect we will see an early break of this bearish pattern to trigger the count on the 4hr chart.
I will then start tracking wave ‘iii’ of (v) on the hourly chart.
SILVER.
SILVER 1hr
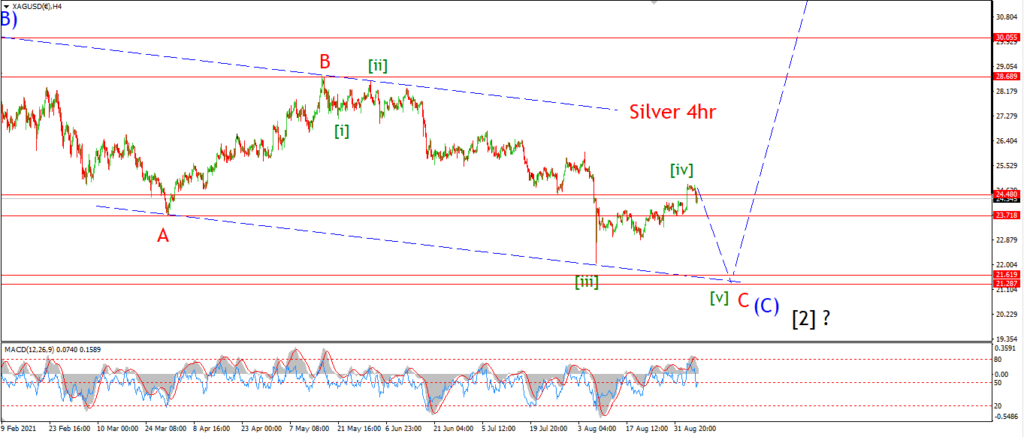
SILVER 4hr.
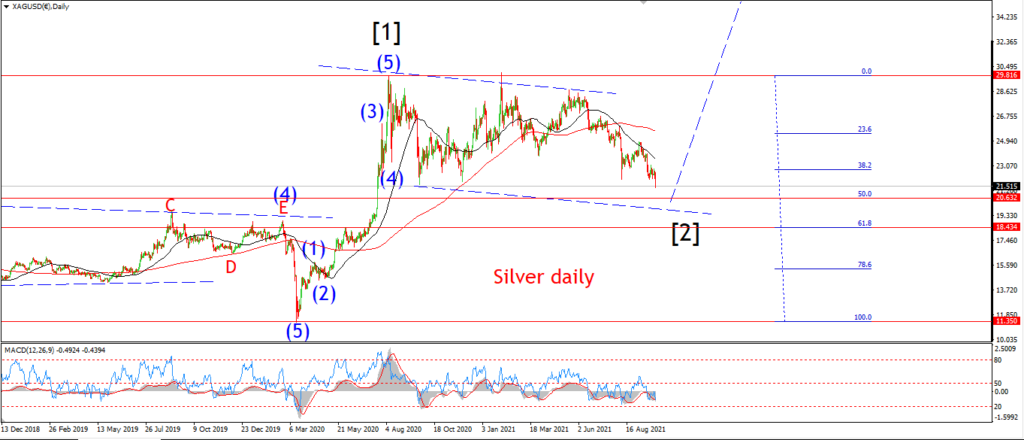
SILVER daily.
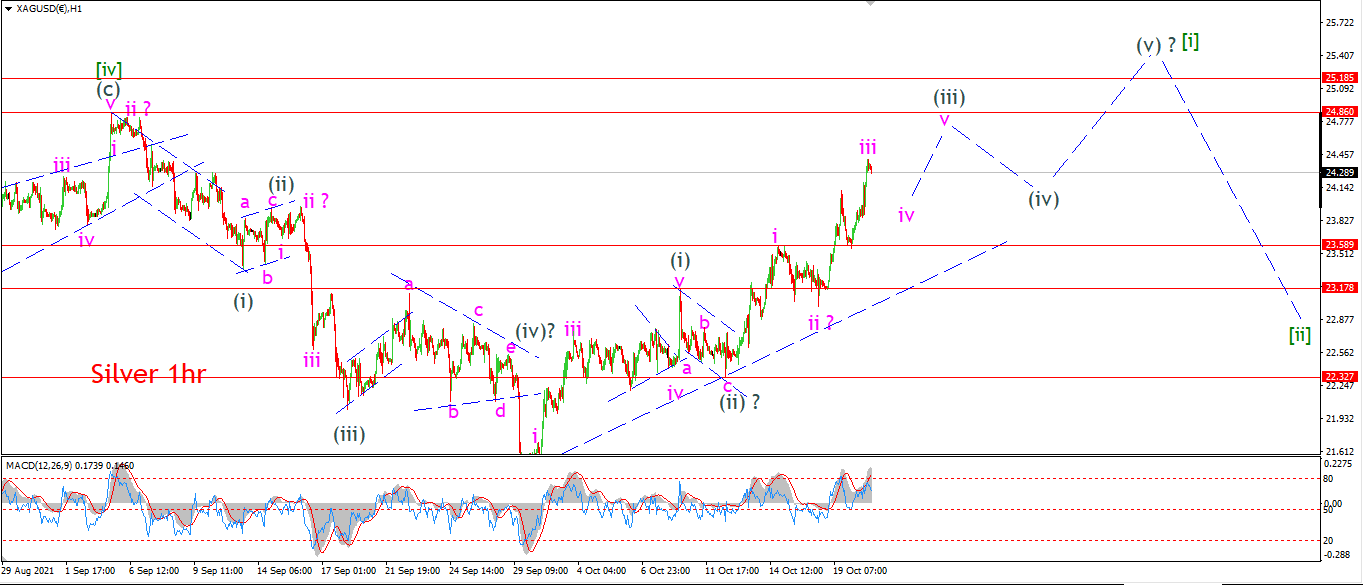
Silver turned higher today to complete wave ‘iii’ of (iii).
The price should top out soon in wave ‘iii’ and then roll over into wave ‘iv’ of (iii) by Fridays session.
This pattern is working quite well at the moment,
so as long as the high at wave (i) holds at 23.17,
then we are looking at this new uptrend strengthening over the coming months.
There will be sharp declines along the way,
but I think we have enough evidence on the table now to suggest that the major correction in wave [2] is over,
and we can look forward to a long bull run in wave [iii] over the coming year.
Tomorrow;
We should see wave ‘iv’ begin a decline by tomorrow evening.
WAve ‘iv’ should hold above 23.58.
BITCOIN
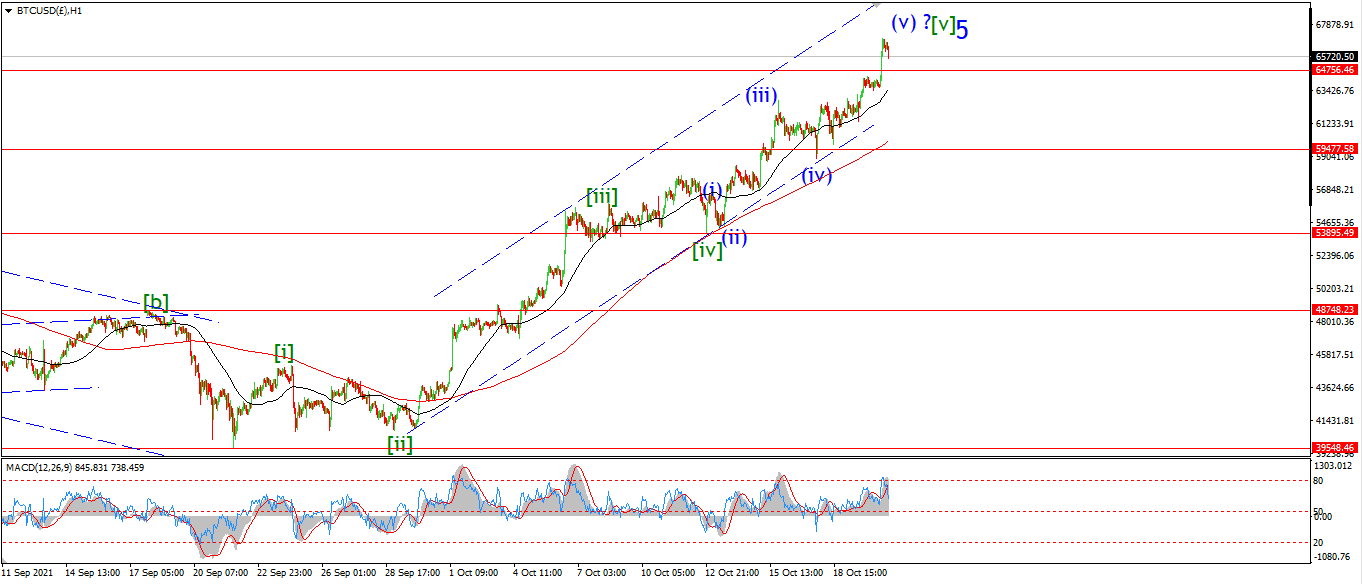
BITCOIN 1hr.
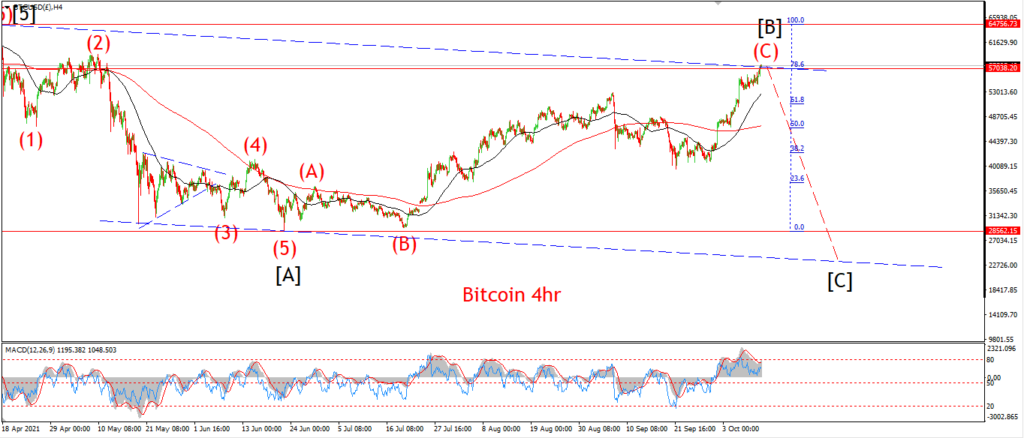
BITCOIN 4hr.
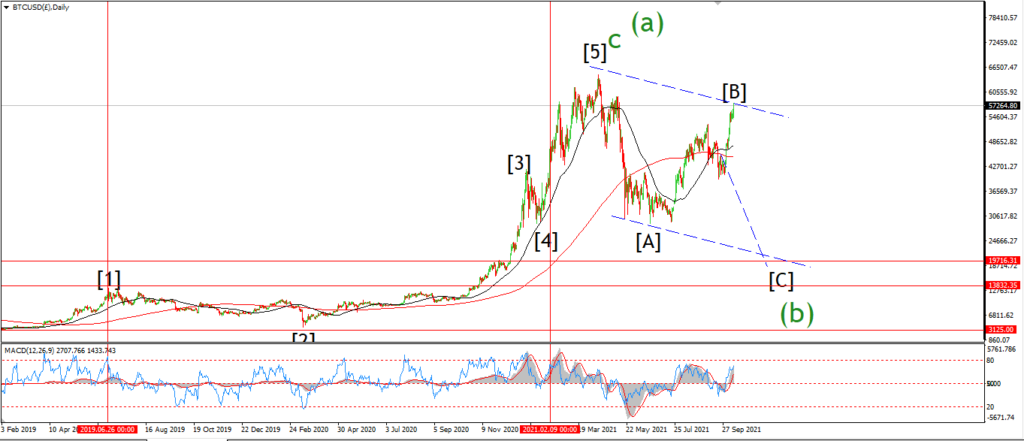
BITCOIN daily.
Topping in wave [B].
FTSE 100.
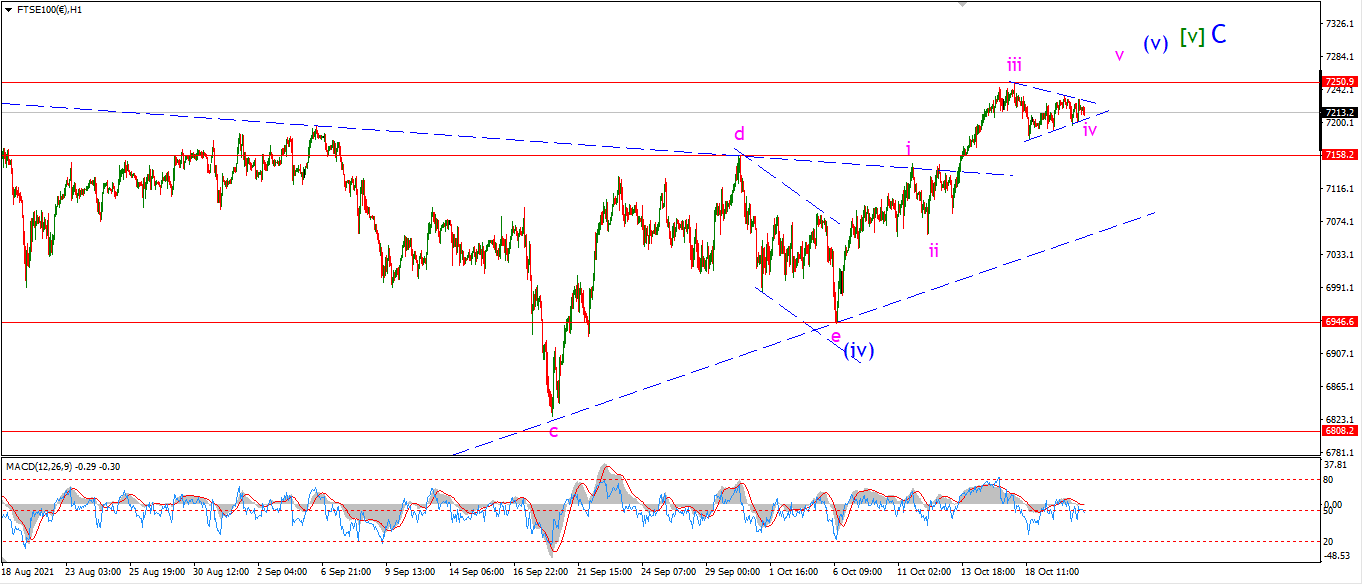
FTSE 100 1hr.
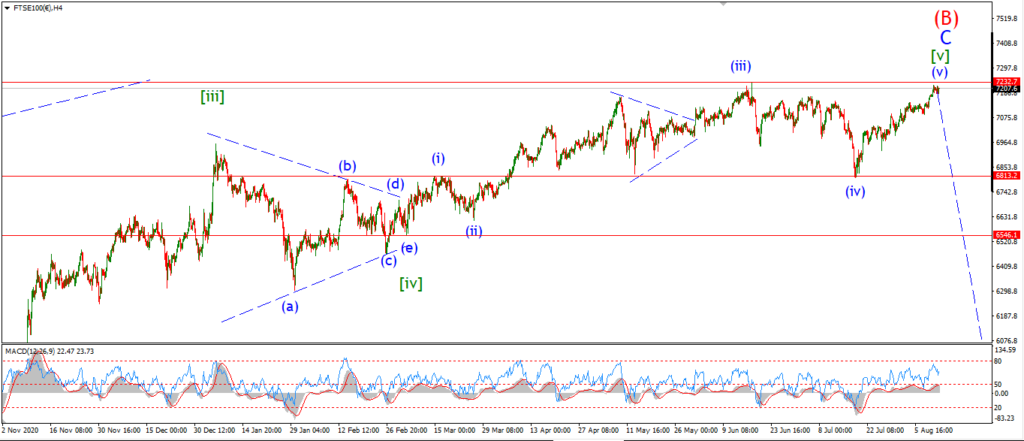
FTSE 100 4hr.

FTSE 100 daily.
Complete wave (B).
DAX.
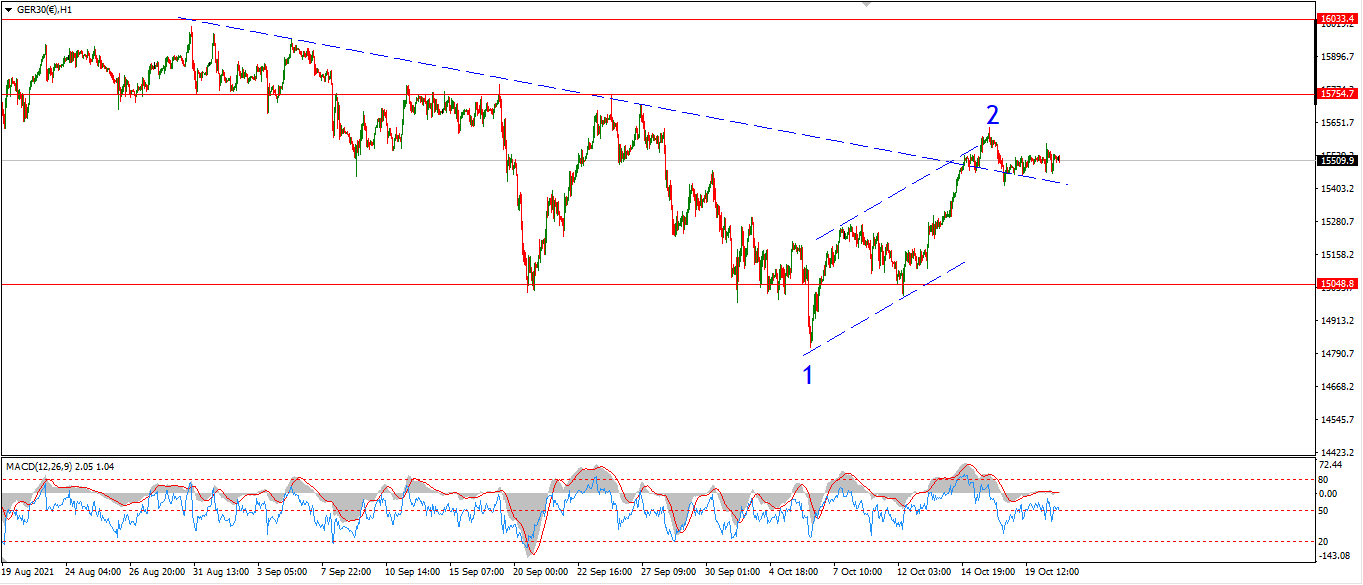
DAX 1hr
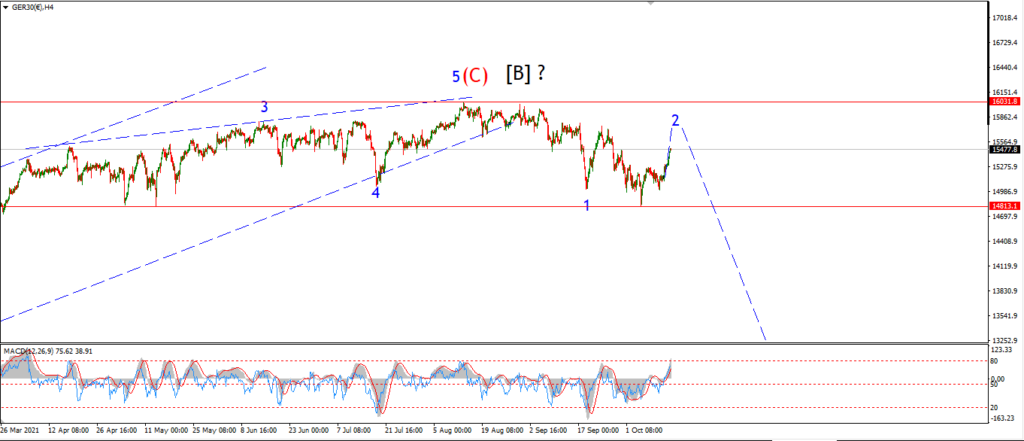
DAX 4hr
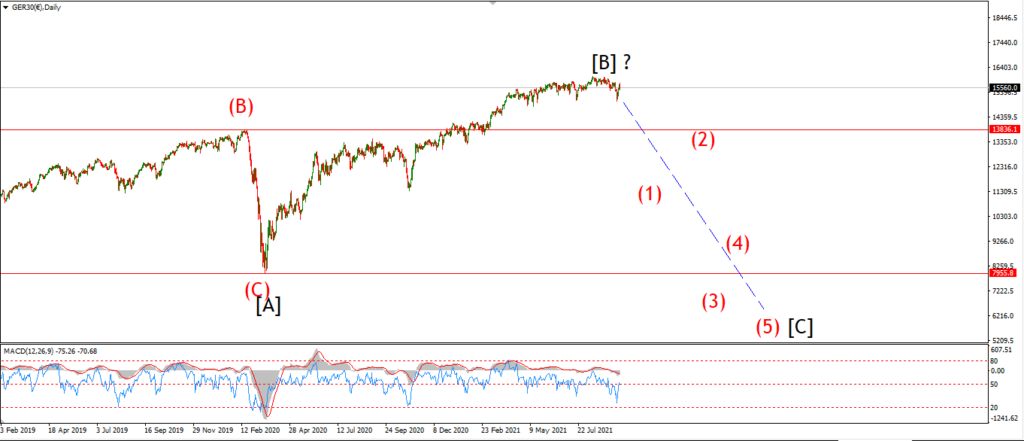
DAX daily.
Topping out in wave [B].
NASDAQ 100.
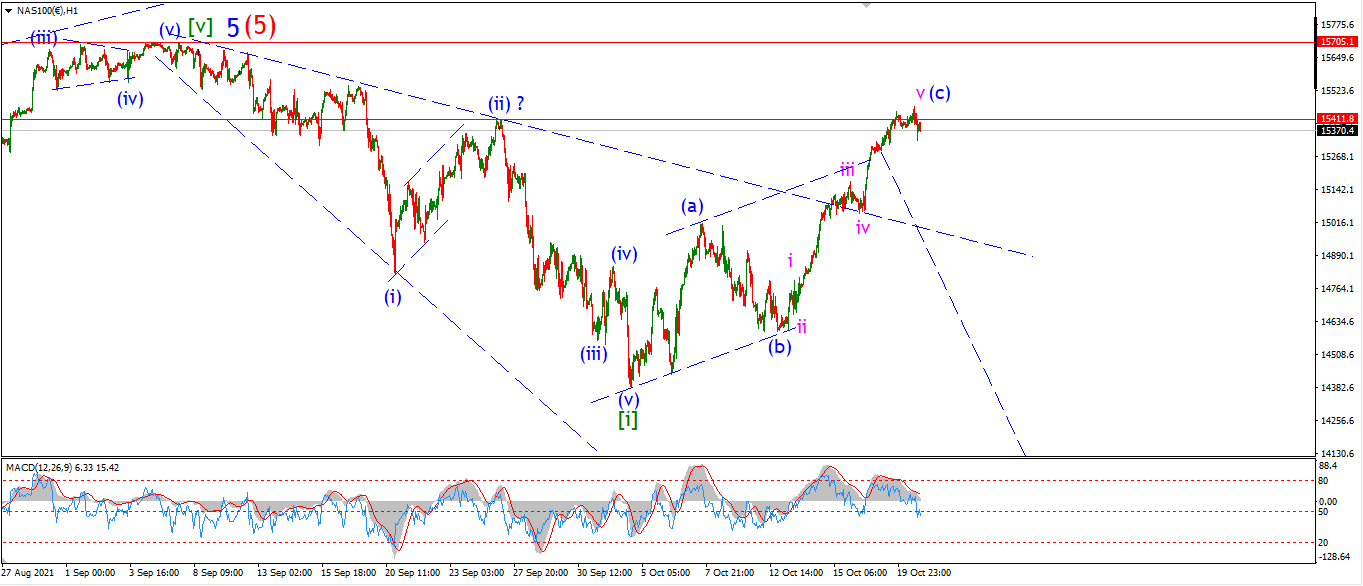
NASDAQ 1hr
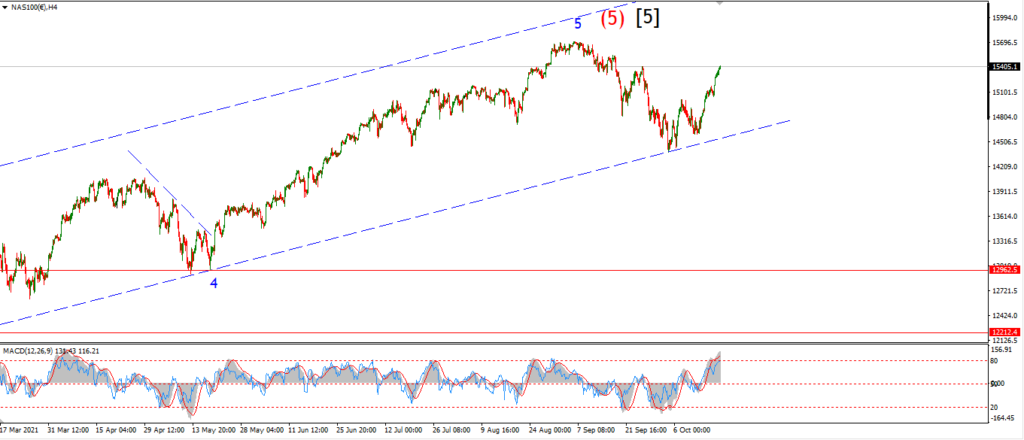
NASDAQ 4hr.
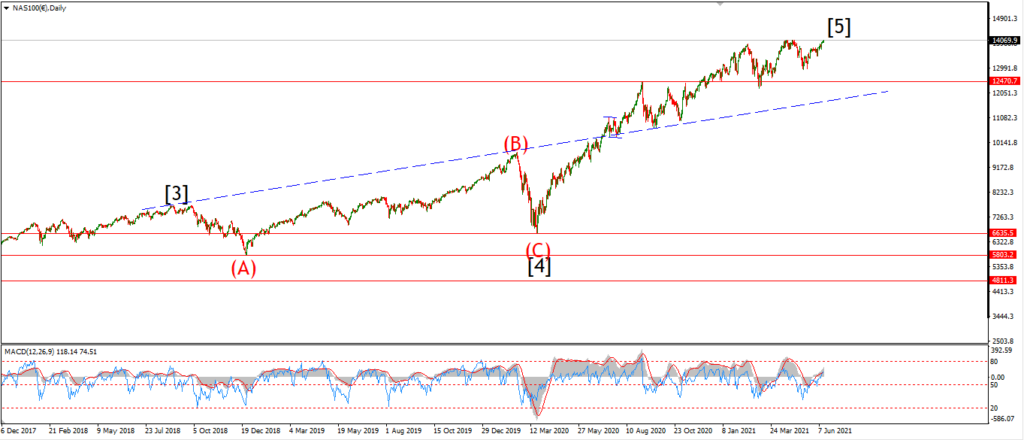
NASDAQ daily.
Is this it for the Nasdaq??