
Good evening, and Gods Blessings to you all tonight.
I recorded a video earlier today which focuses solely on the weekly charts and what my long term perspective is across the markets.
Also, I read a very interesting post from macrocharts.blog earlier, I think it is very well worth your time if you have a chance.
I have taken a hatchet to my long held views on the stock market tonight by introducing another alternate count which could surprise you.
So without further adieu, here we go.
EURUSD.
EURUSD 1hr.
EURUSD 4hr.
EURUSD daily.
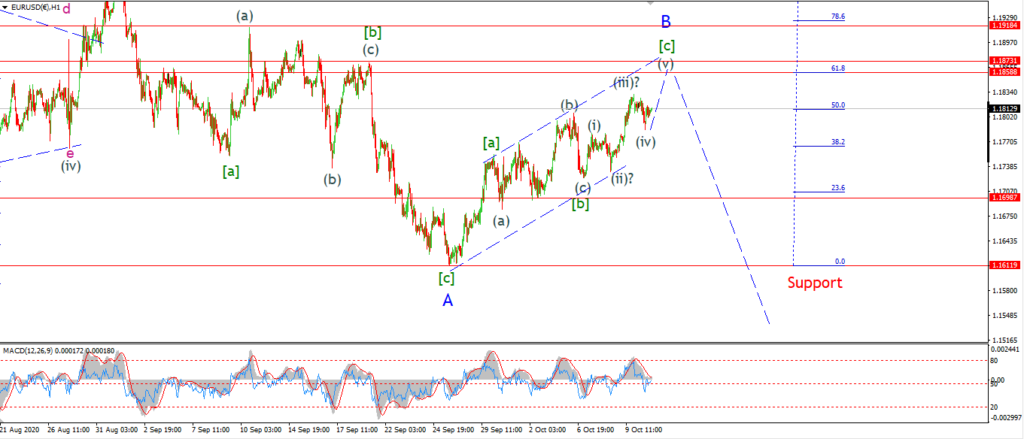
This evening I have shown a slightly different interpretation for wave [c] of ‘B’.
Wave [b] is green is now shown as a running flat correction,
There is a clear five wave pattern developing off the wave [b] low last week.
I am counting this as wave [c] as shown.
The correction today is labelled wave (iv) of [c] and wave (v) should carry us up to the 62% retracement level.
Tomorrow;
Watch for wave (v) to complete and hit the area of resistance at 1.1860.
GBPUSD
GBPUSD 1hr.
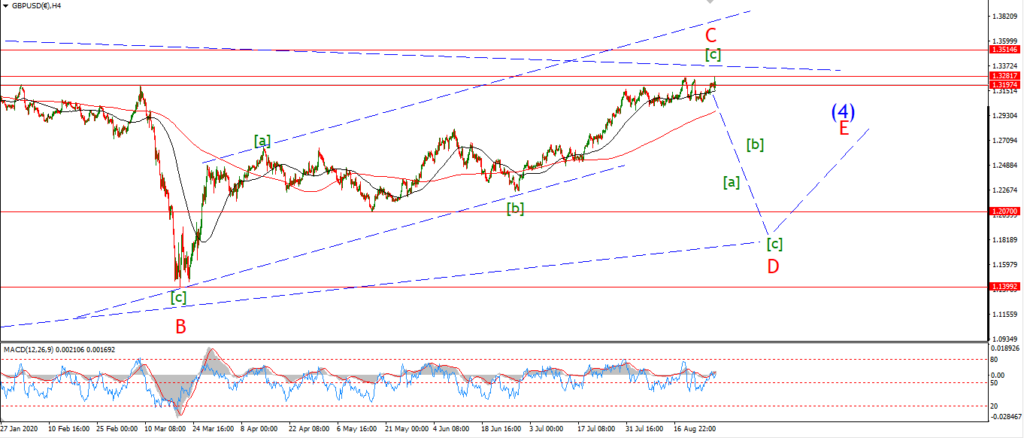
GBPUSD 4hr.

GBPUSD daily.
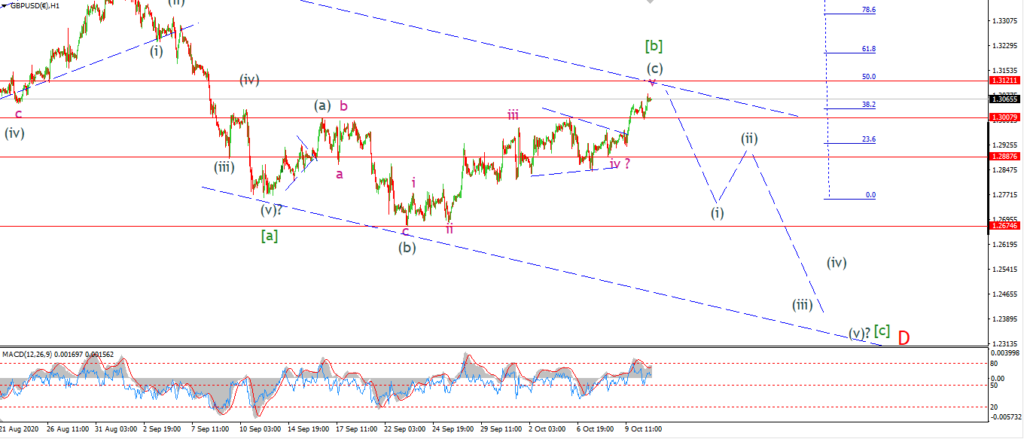
After todays move higher another interpretation has emerged for wave (c) of [b].
The main pattern is the same,
but wave ‘iv’ of (c) is now labelled as a triangle,
and wave ‘v’ of (c) is now heading towards that 50% retracement level at 1.3121.
This level should offer resistance to the rally in wave (c),
to be honest this move looks pretty jaded now.
Tomorrow;
Watch for wave [b] to hit the Fib retracement and then begin a reversal down into wave (i) of [c].
A break of 1.2900 again will signal wave (i) is in force.
USDJPY.
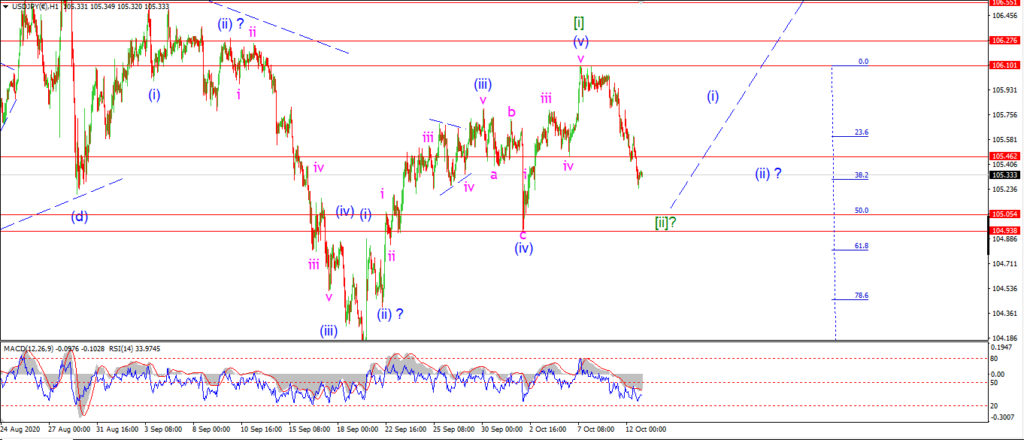
USDJPY 1hr.
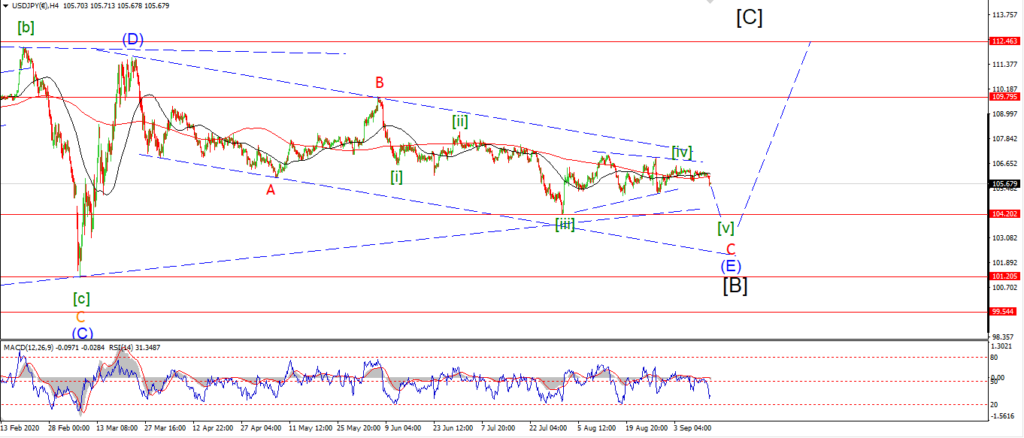
USDJPY 4hr.
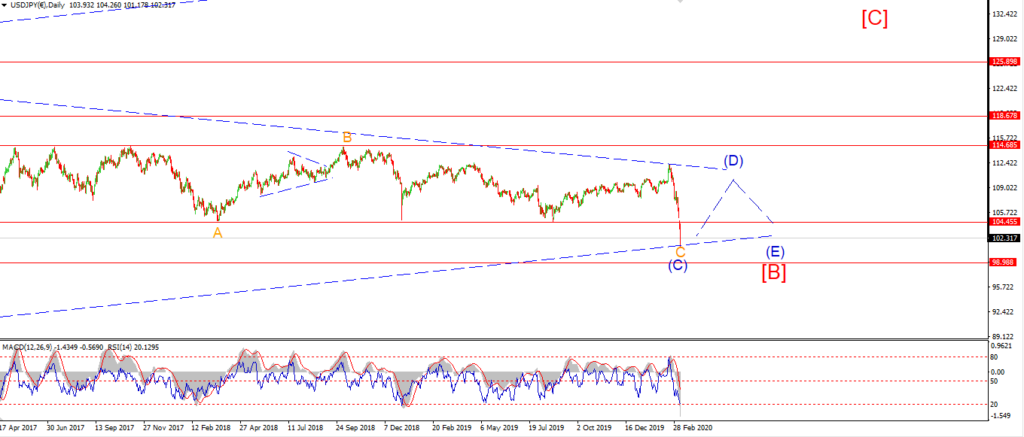
USDJPY daily.
The decline off last weeks highs continued throughout todays session.
This decline is now big enough to suggest that something different is going on for waves [i] and [ii].
I have now shown wave [i] at the recent high of 106.10.
And the sharp move lower off last weeks highs is labelled wave [ii].
The price has hit the 38% retracement level today,
but the 50% retracement comes in at 105.05,
and that level also comes in near the previous fourth wave at 104.93.
It looks like this level could offer enough support to complete wave [ii].
Tomorrow;
Watch for wave [ii] to complete early this week.
A move back above 106.00 again will signal wave [iii] has begun.
DOW JONES.
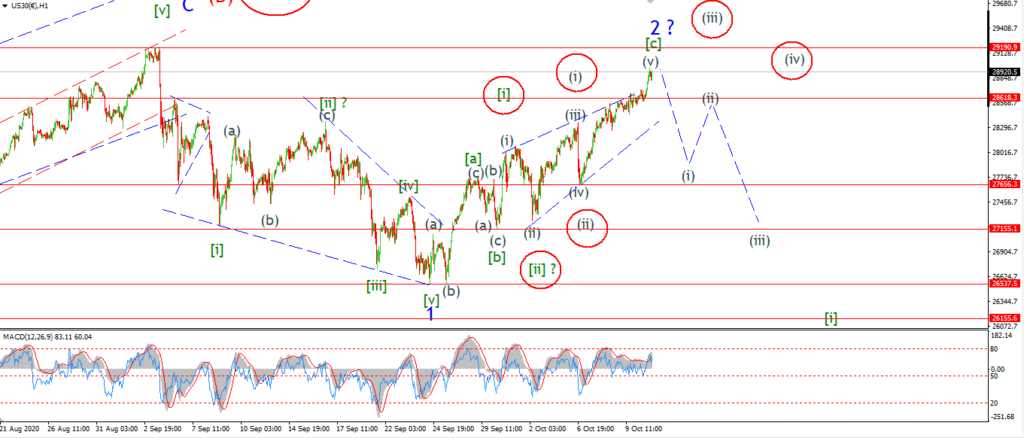
DOW 1hr.
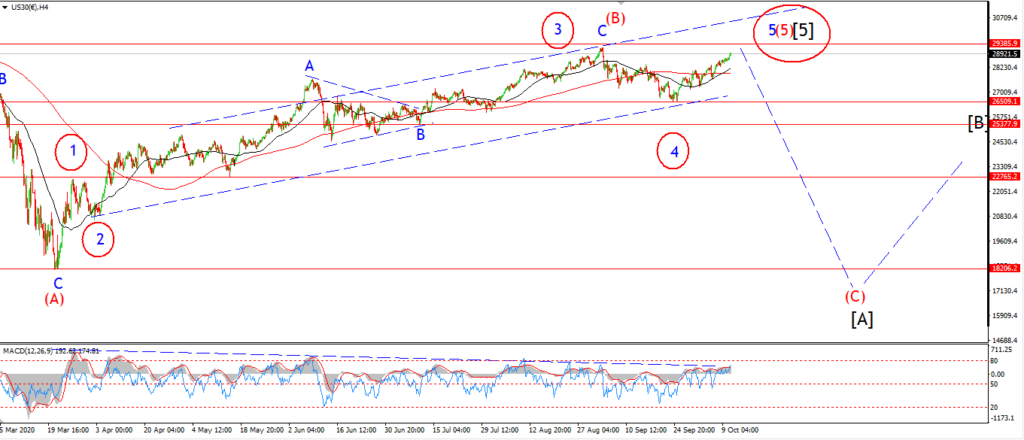
DOW 4hr
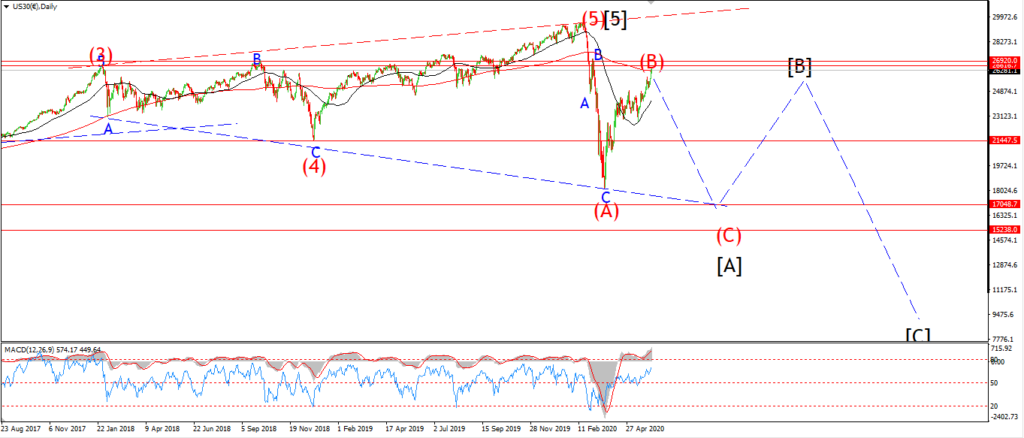
DOW daily.
It is time for me to swallow my pride and look at another alternate count on the 4hr chart tonight.
Against every gut feeling and outright Ludacris technical and valuation metric available to me,
the market just keeps proving me wrong to the upside.
The market has reached up to within a whisker of a new all time high again today.
Which this is still possible within a second wave as shown.
It is also possible that we are just running to new all time highs as part of a final fifth wave.
On the 4hr chart;
I have shown a possible count for wave (5) red off the March lows.
This views the recent decline as a fourth wave in blue,
and the rally off that low as wave ‘5’ blue still developing.
This alternate count will allow for more upside in wave ‘5’ of (5) towards the 31000 handle.
And that will carry us past the U.S election.
By the way,
a new all time high in the market will favor the incumbent for sure.
The public is not in the mood for a shake up just yet!
Tomorrow;
Back to the short term.
The hourly count still stands as long as we hold below the September high and we see a sharp reversal this week.
GOLD
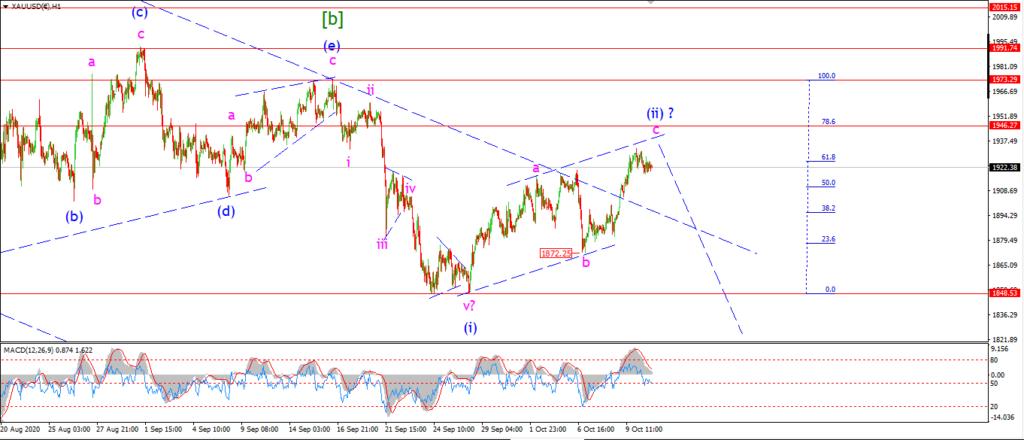
GOLD 1hr.
GOLD 4hr.
GOLD daily.
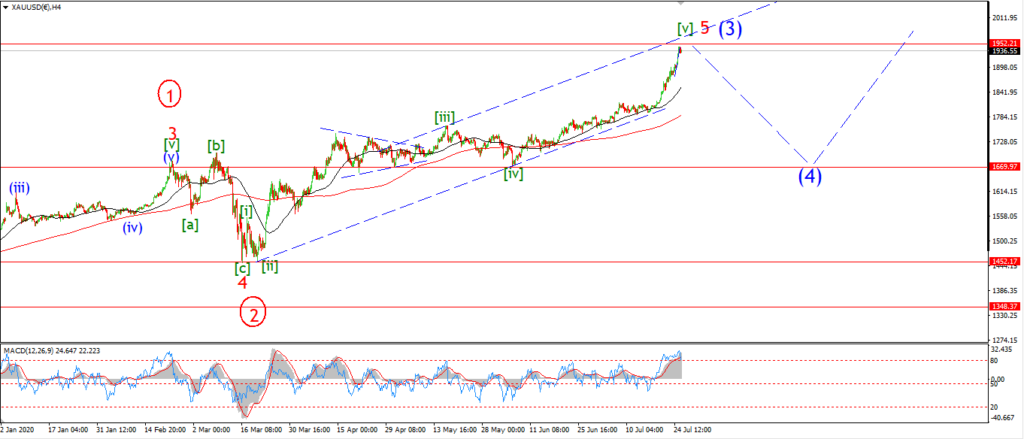
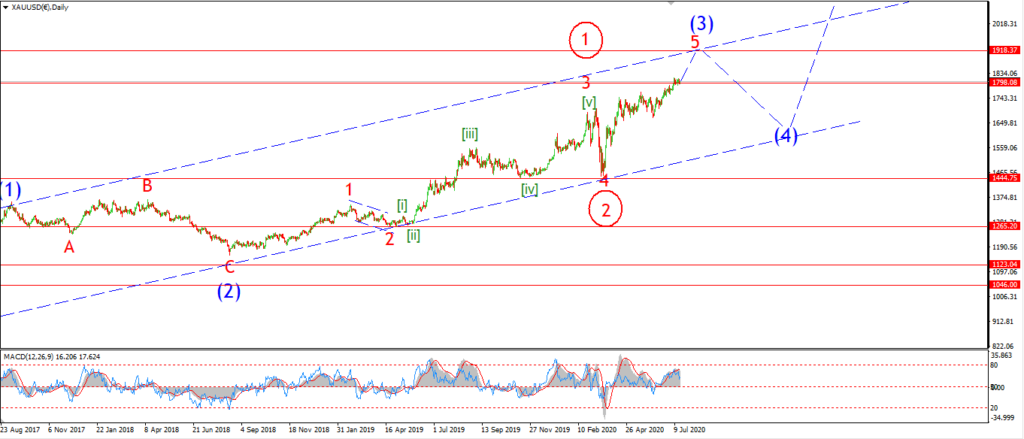
Wave (ii) is coming to an end now,
but it looks like we will have another small rise into the upper trend channel line
to complete wave ‘c’ before turning lower again to begin wave (iii) down.
Wave ‘c’ is correcting today and this is likely a small fourth wave,
another pop to 1940 will complete five wave up in wave ‘c’.
Tomorrow;
Watch for wave (ii) to complete at the upper trend channel line at about 1940.
CRUDE OIL.
CRUDE OIL 1hr.
CRUDE OIL 4hr.
CRUDE OIL daily.
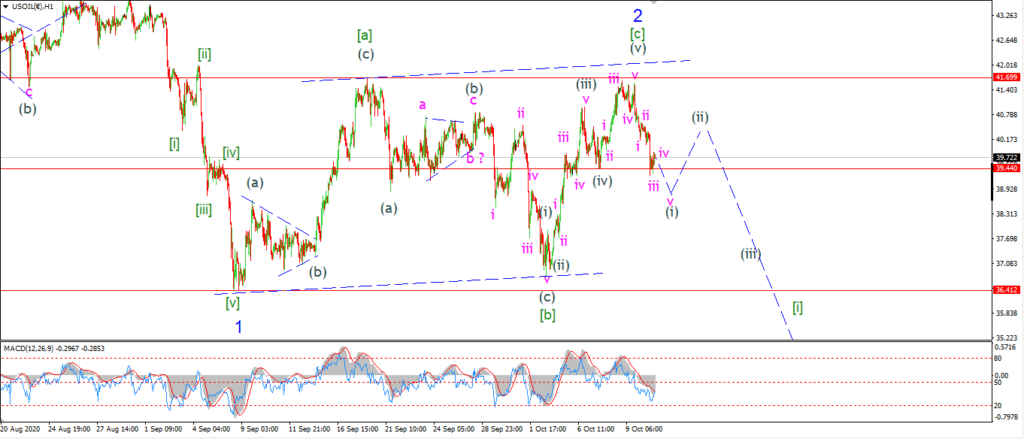
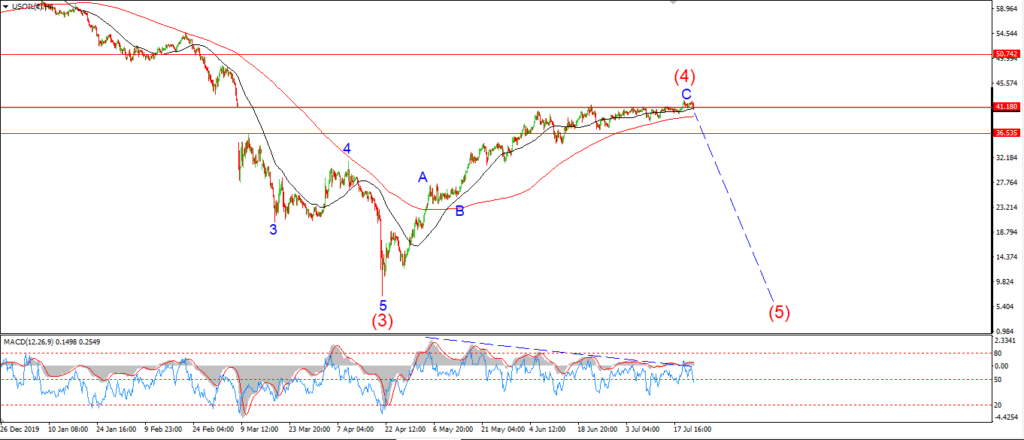
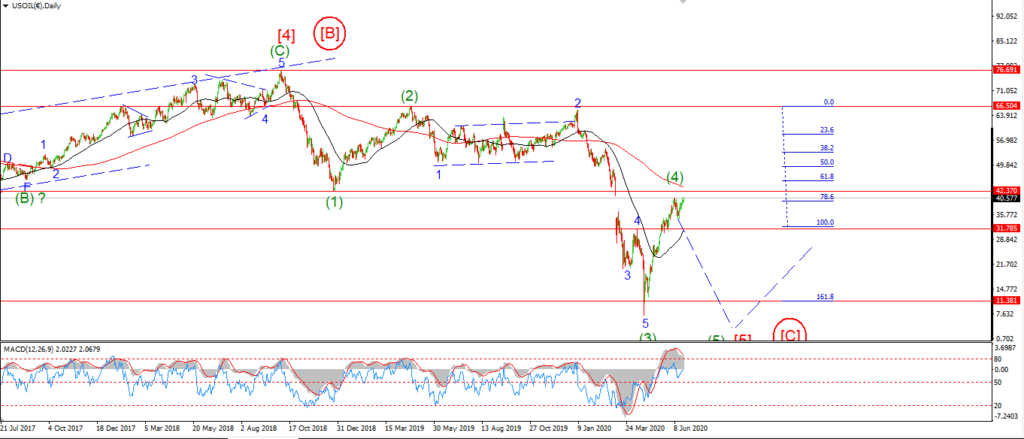
Todays drop in crude came early but is not unwelcome!
The rally in wave (v) stopped short of a new high above wave [a].
This classifies wave ‘2’ as a running flat.
We do not have five waves down off the high just yet,
I can see a three wave decline in place,
so another drop below 39.00 again should complete wave (i) down.
The decline today has hit the previous fourth wave low also,
and I would like to see a clean break of that level in wave (i) before any correction higher into wave (ii).
Tomorrow;
Watch for wave ‘iv’ and ‘v’ to complete five waves down off the wave ‘2’ high.
S&P 500.
S&P 500 1hr
S&P 500 4hr
S&P 500 daily.
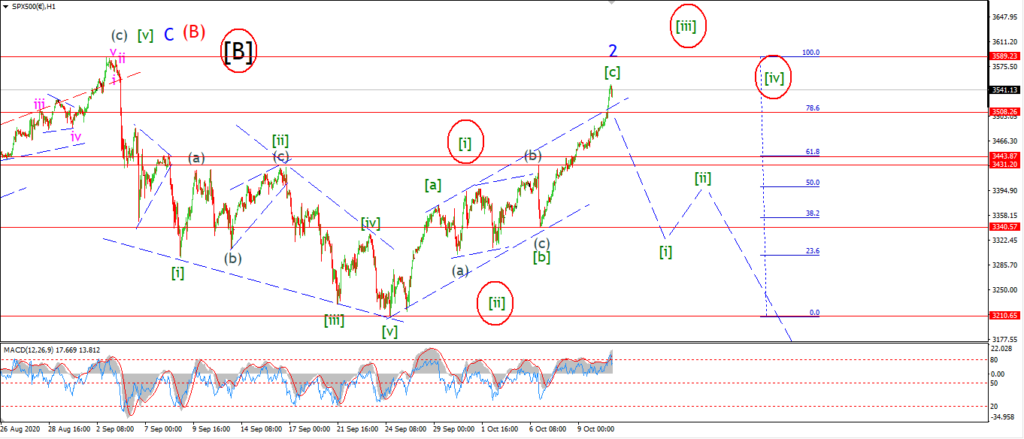
While todays rally can certainly be viewed as a blow off top in wave [c] of ‘2’.
I would be a fool to discount the alternate count as I explained in the DOW.
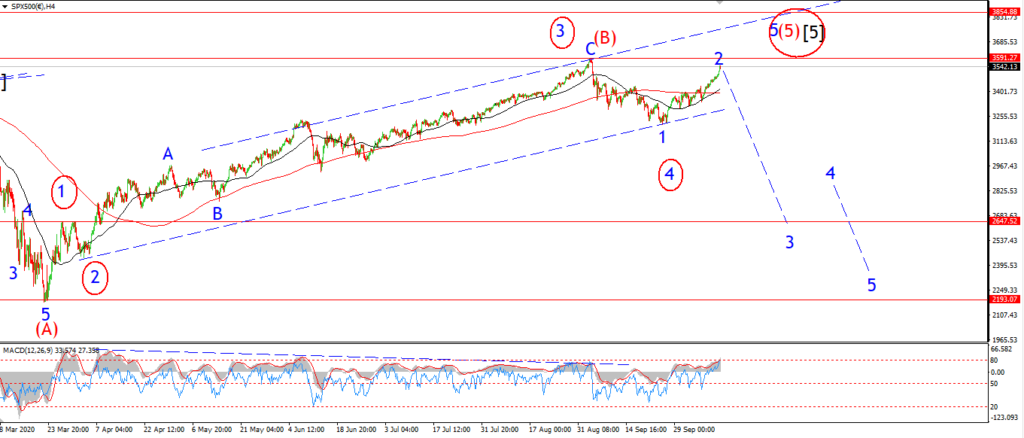
You can view this rally as a developing five wave structure as shown in the alternate count.
And the current move higher as wave ‘5’ of (5).
If this count is correct,
This is best viewed on the 4hr chart also.
If we get another new all time high in the S&P,
and five waves up off the late September lows at 3210,
then we have another candidate for a top in wave (5) red.
wave (5) will break to a new high and hit the upper trend channel line in the area of 3800.
Back to the main count.
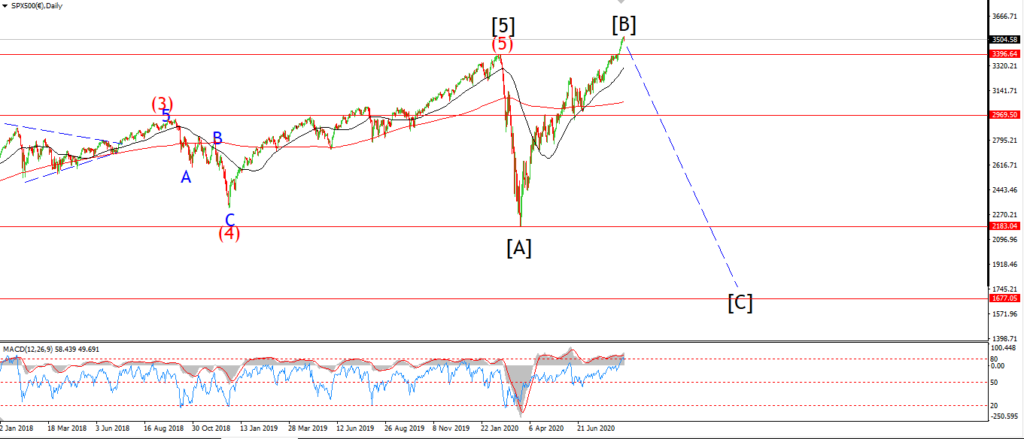
A sharp reversal off this top will keep the bearish count alive.
But I am on the edge of my seat in this regards.
Tomorrow;
It is simple what needs to happen.
A five wave decline to back into 3340 at the wave [b] low is essential over the coming days to keep the bearish count alive.
SILVER.
SILVER 1hr
SILVER 4hr.

SILVER daily.
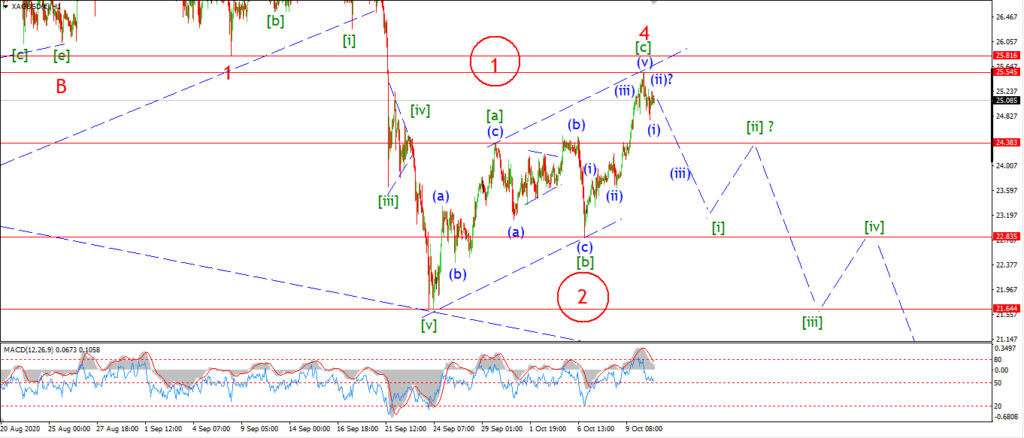
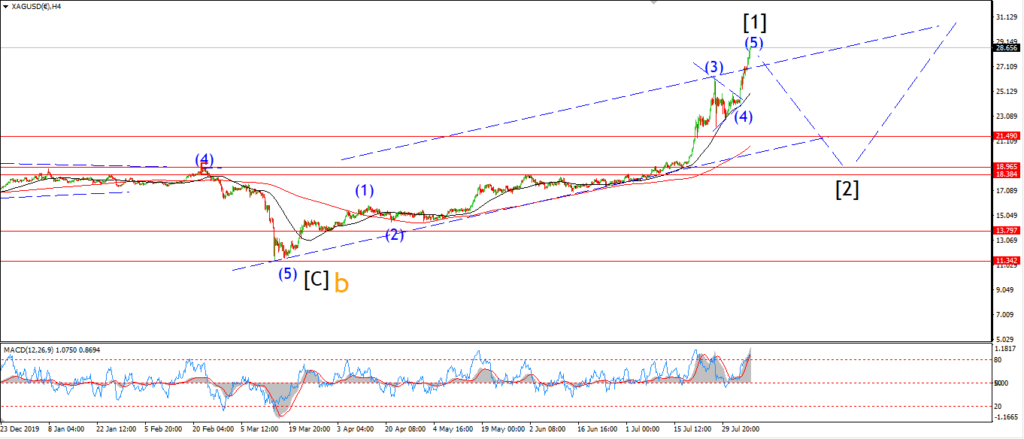
Silver spiked lower early today and this raises the probability that wave ‘4’ is now complete.
we have a solid three wave pattern higher in place in wave ‘4’ at this high.
And we need a new impulsive move off the high to signal wave ‘5’ has begun.
Tomorrow;
Watch for todays high at 25.50 to hold,
and then a drop below 24.38 to signal wave [i] has begun.
NEW MARKETS, charts only for now.
BITCOIN
BITCOIN 1hr.
BITCOIN 4hr.
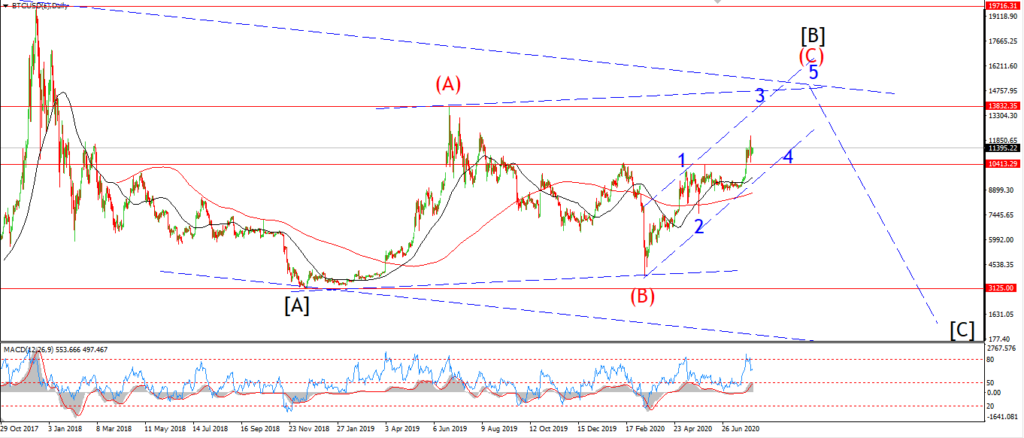
BITCOIN daily.
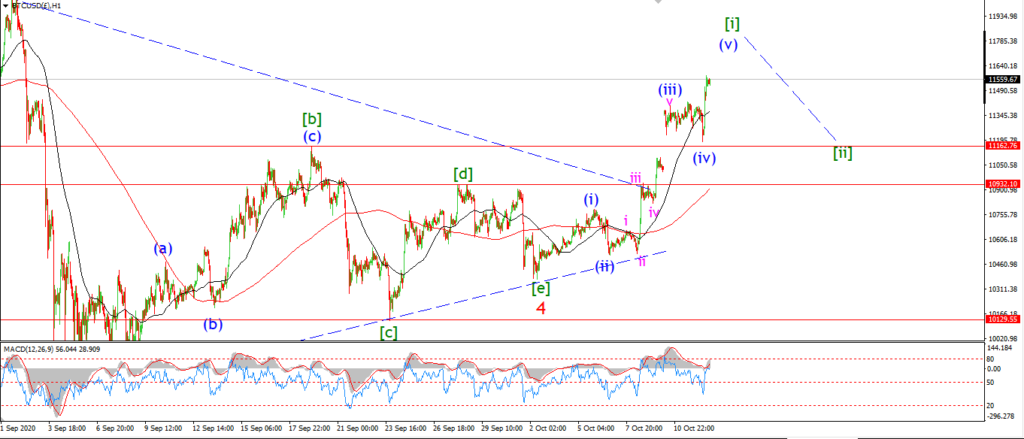
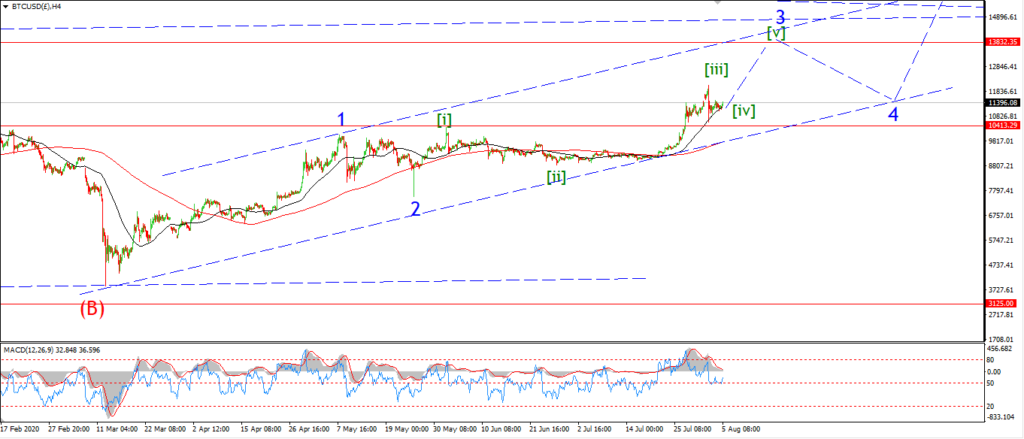
Topping in wave [B].
FTSE 100.
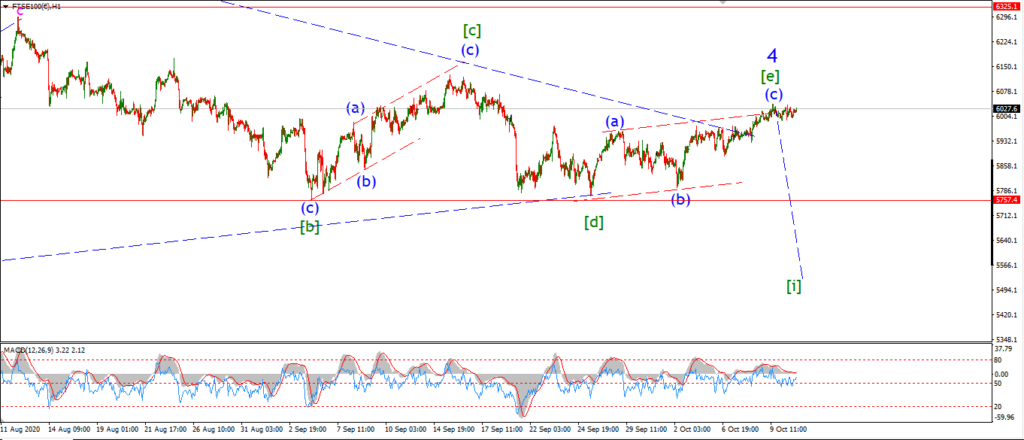
FTSE 100 1hr.
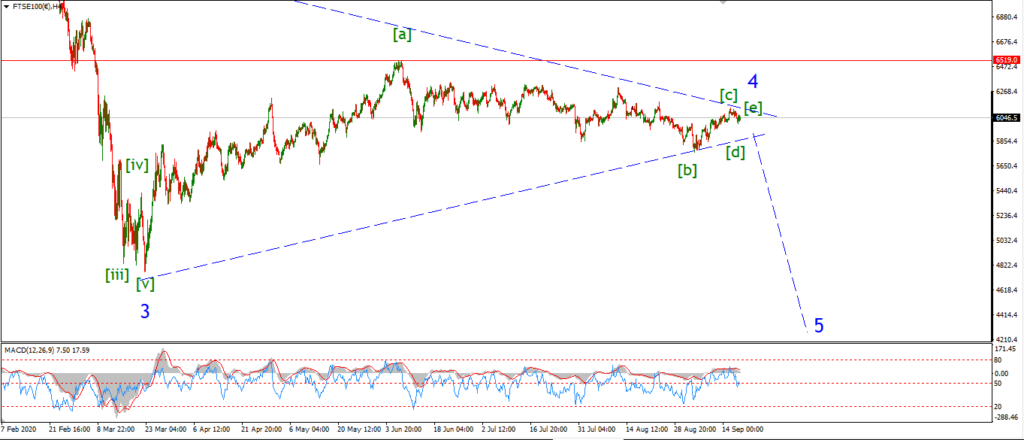
FTSE 100 4hr.
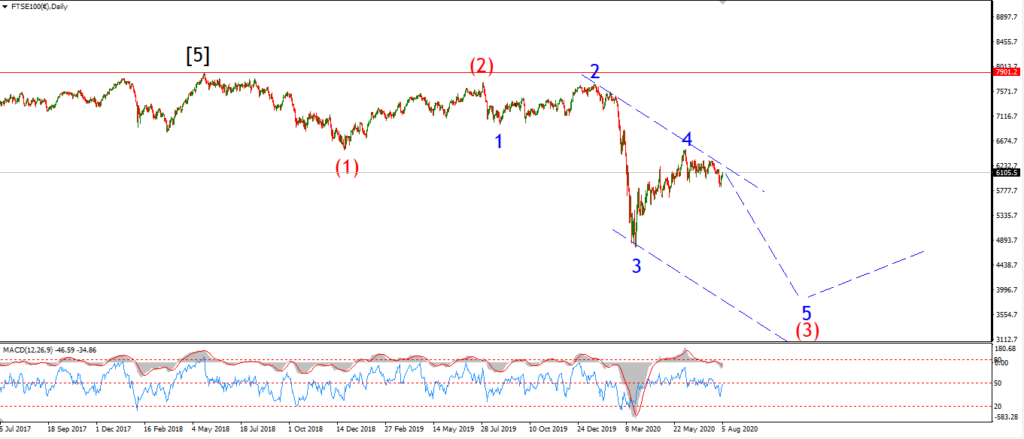
FTSE 100 daily.
Completing a fourth wave.
DAX.
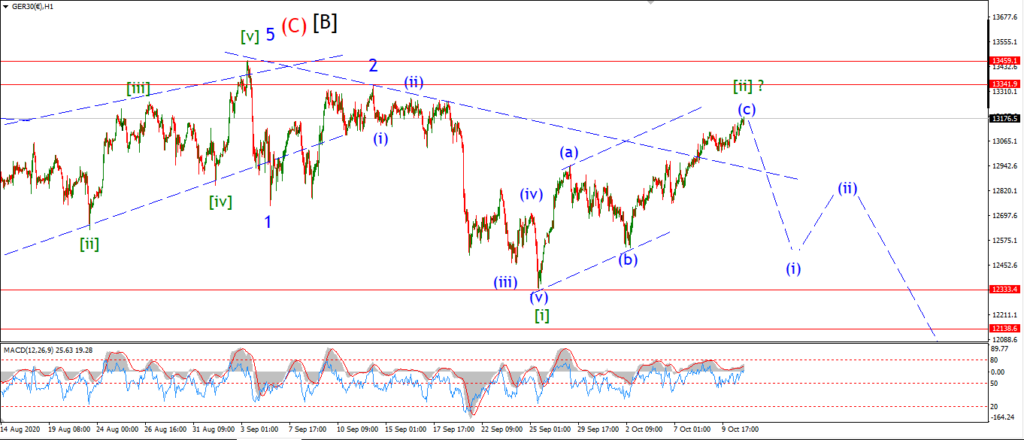
DAX 1hr
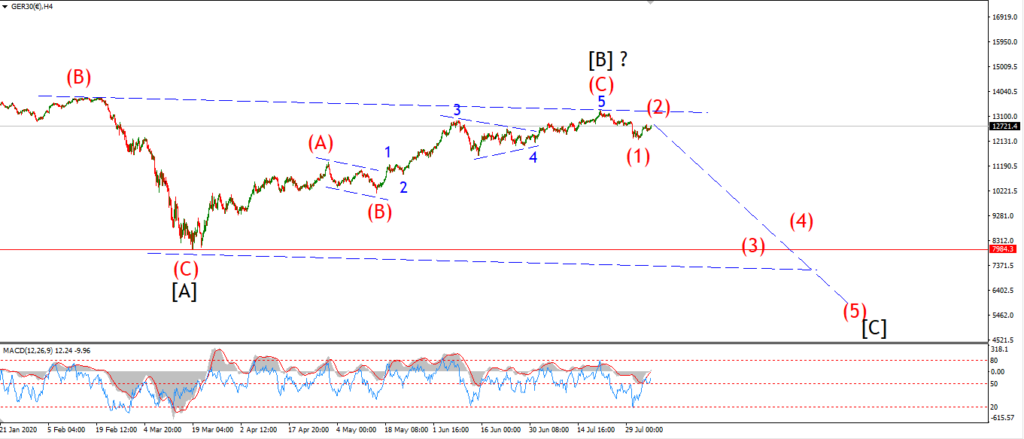
DAX 4hr
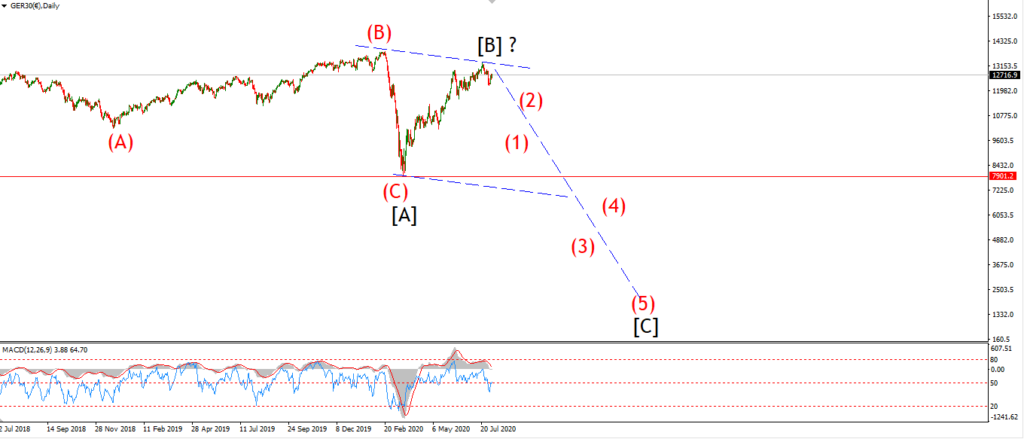
DAX daily.
Topping out in wave [B].
NASDAQ 100.
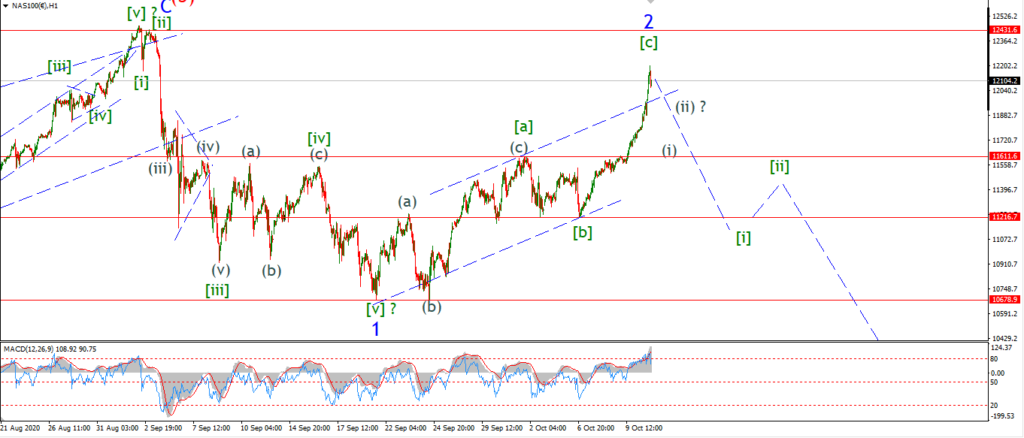
NASDAQ 1hr
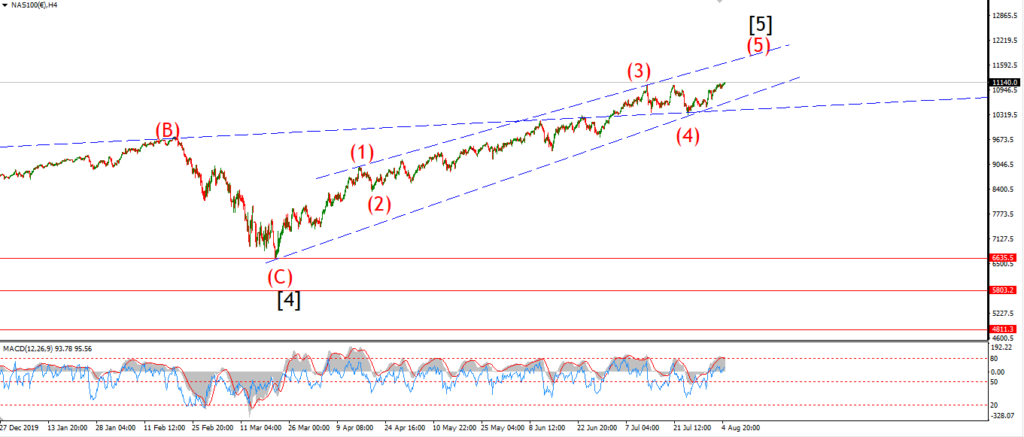
NASDAQ 4hr.
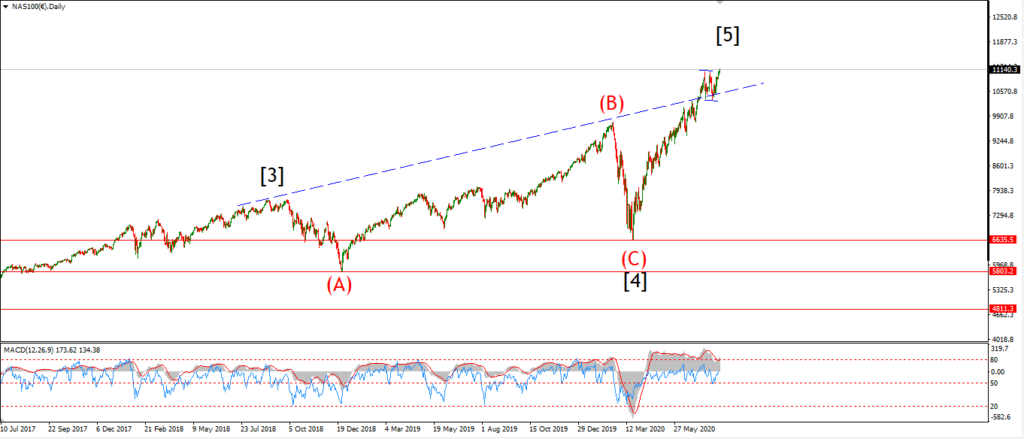
NASDAQ daily.
Topping out at all time high.