
Good evening to you folks.
God’s blessings to you all tonight.
EURUSD.
EURUSD 1hr.
EURUSD 4hr.

EURUSD daily.
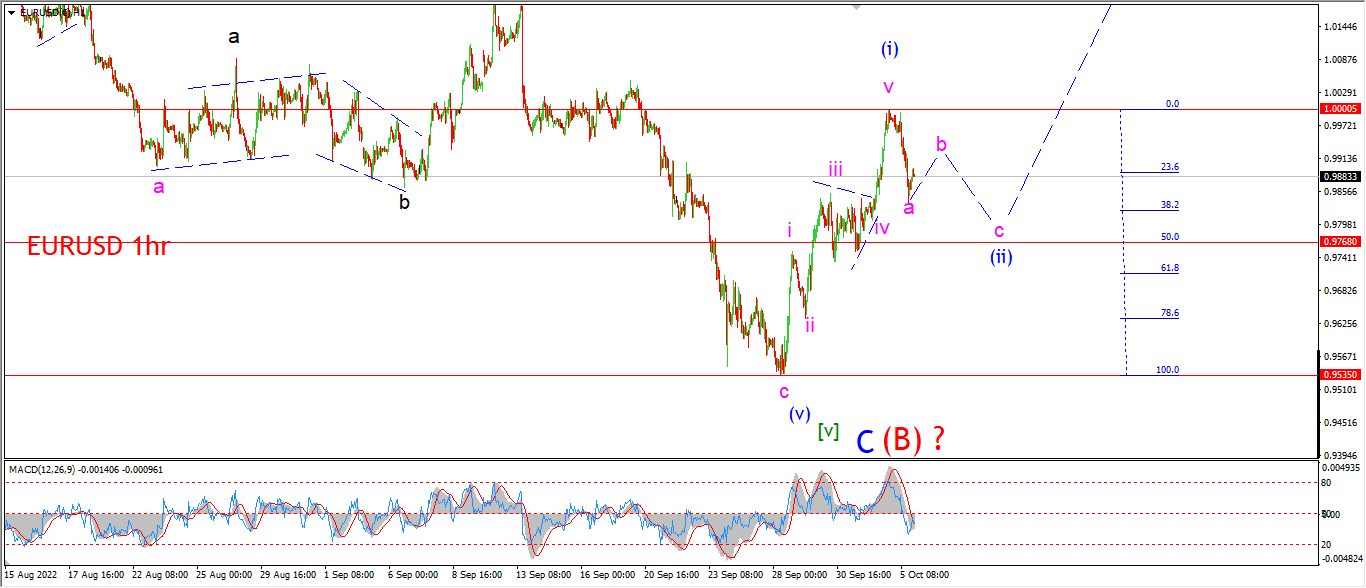
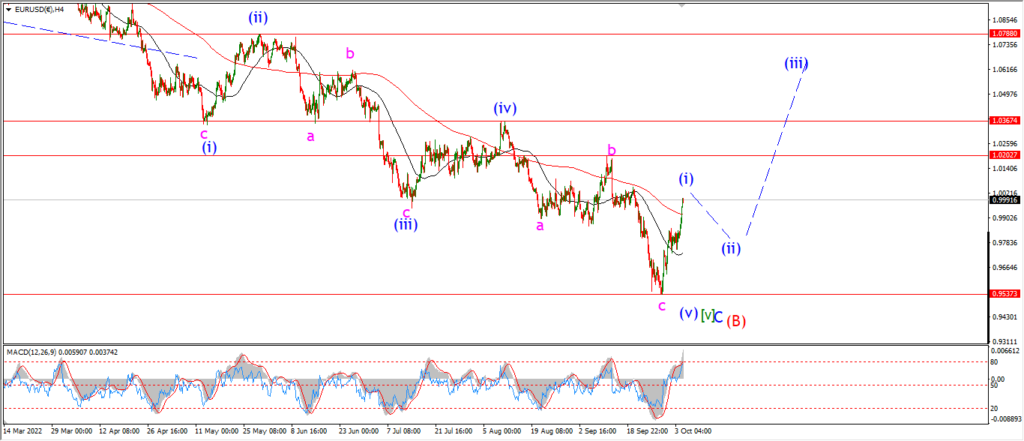
EURUSD has dropped off Tuesdays high today and it seems sure now that wave (ii) is underway.
The initial decline is wave ‘a’ of (ii) with ‘b’ and ‘c’ left to complete the pattern.
Wave (ii) should find support at the lower end of the previous wave ‘iv’.
This target area lines up with the 50% retracement level also at 0.9768.
That gives us a nice level to watch for a bullish higher low to form over the next few sessions.
Tomorrow;
Watch for wave (ii) blue to continue lower in a three wave pattern as suggested.
Wave ‘b’ of (ii) should complete below par,
and then wave ‘c’ will fall again into the target area.
The low at 0.9535 must now hold for this bullish pattern to remain valid.
GBPUSD
GBPUSD 1hr.
GBPUSD 4hr.

GBPUSD daily.
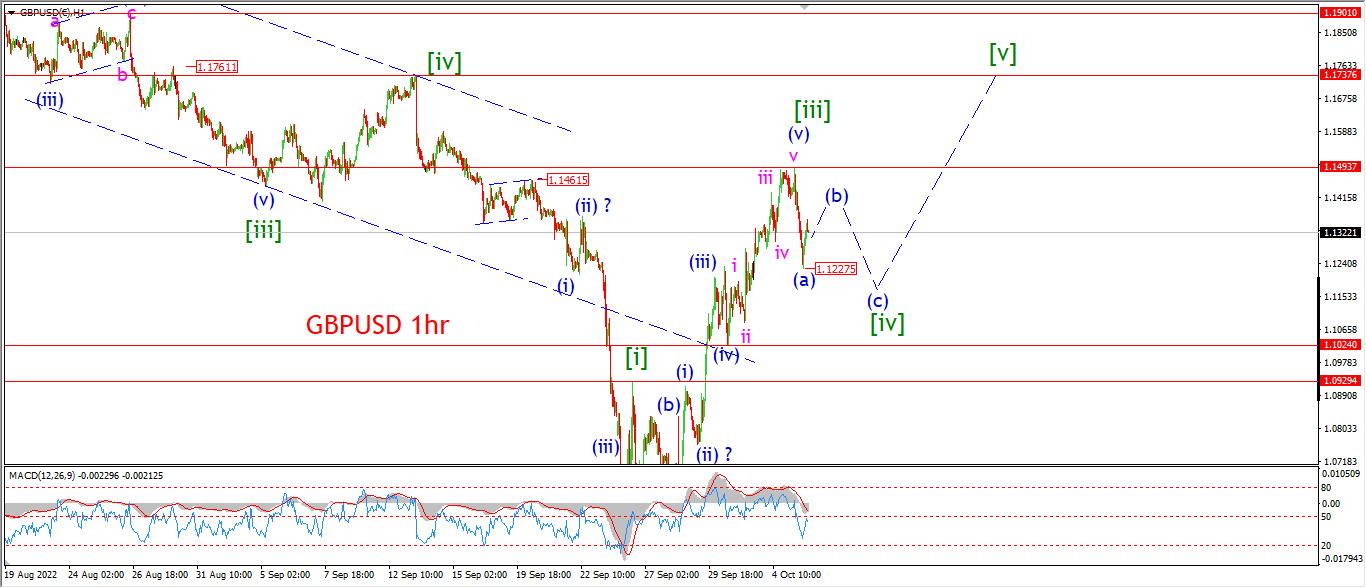
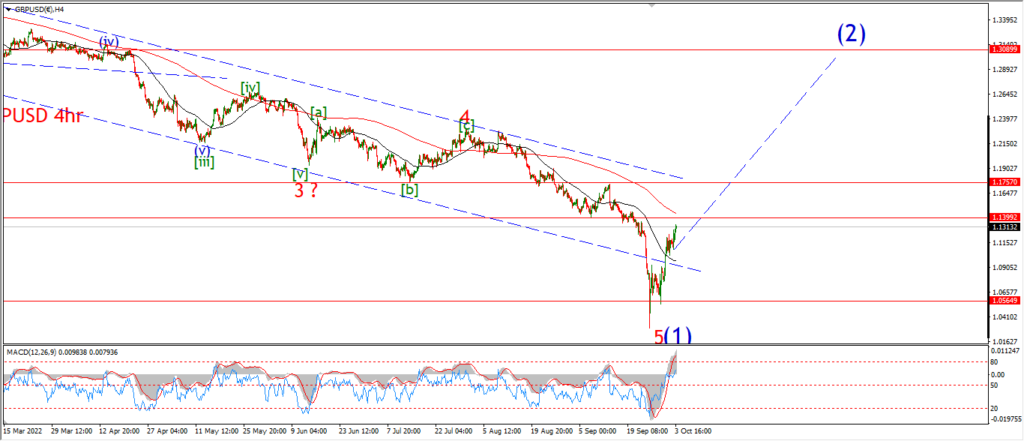
We have a correction decline now in play in cable also tonight.
Wave (a) of [iv] has fallen enough to call that complete now.
The price has bounced off the session low at 1.1275 this evening so wave (b) is likely underway as shown.
Wave [iv] must complete at least a three wave pattern to complete.
And wave [iv] must complete above 1.0929 at the wave [i] high.
We will see if wave [v] has enough time to begin before the end of this week.
Tomorrow;
Watch for wave (b) of [iv] to complete below 1.1493 and then turn lower into wave (c).
The minimum target for wave (c) to hit lies at the wave (a) low of 1.1227.
USDJPY.
USDJPY 1hr.
USDJPY 4hr.

USDJPY daily.
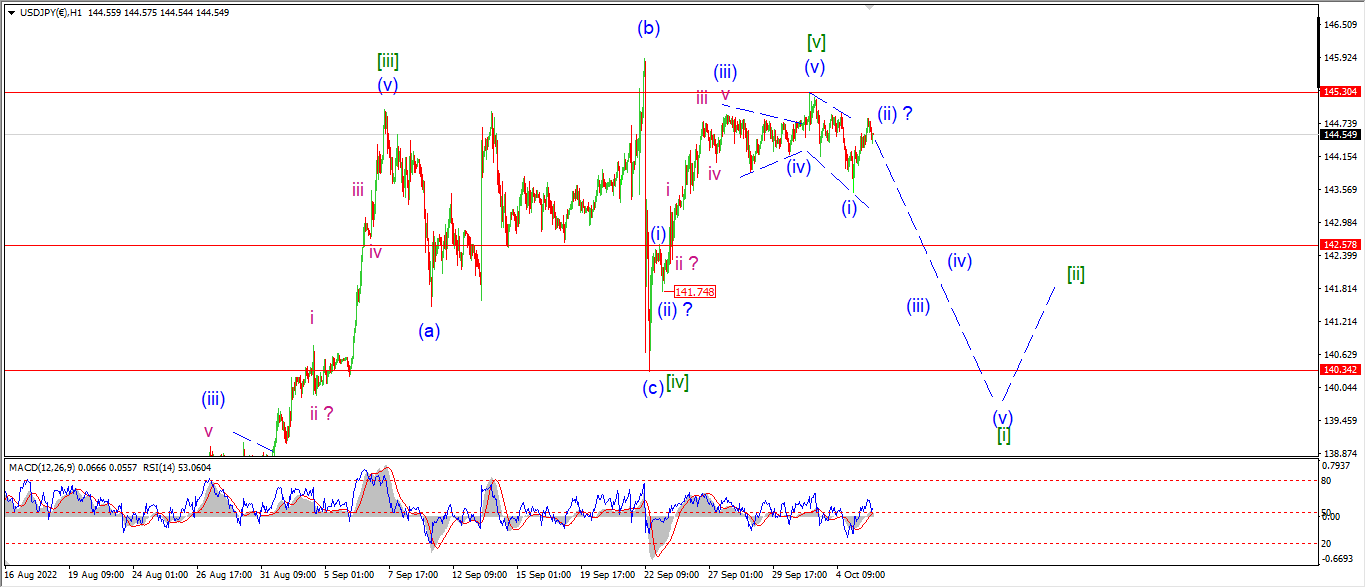
USDJPY has not turned lower in any significant way off the recent top yet.
But I am looking at the action over the last few sessions,
and there is a possibility that wave (i) down traced out a leading wedge pattern lower.
The wave [v] high at 145.30 must hold for this pattern to remain valid.
Apart from that possible count,
this is a waiting game here to see what way the market breaks.
Tomorrow;
Watch for wave (ii) to hold below 145.30.
And wave (iii) of [i] to turn lower again in an impulsive manner.
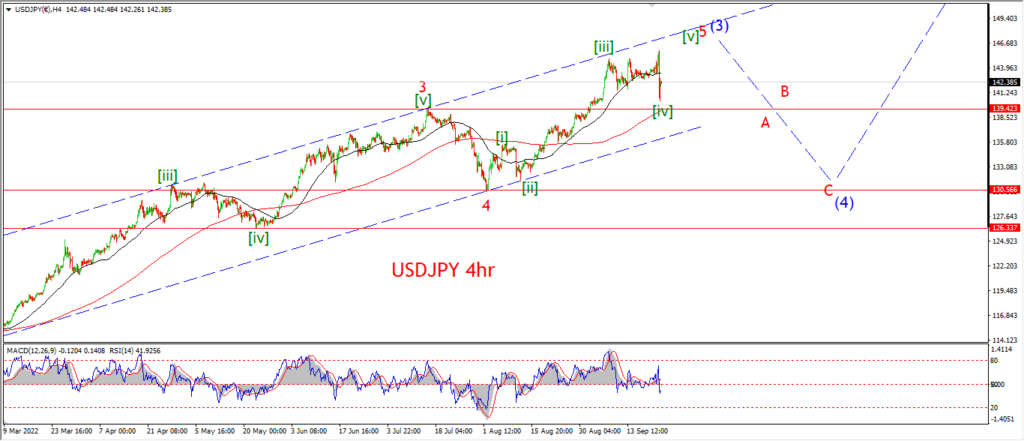
A break of the wave (i) high at 142.57 will favor the idea that a top is in place for wave [v] of ‘5’ of (3).
DOW JONES.
DOW 1hr.
DOW 4hr
DOW daily.
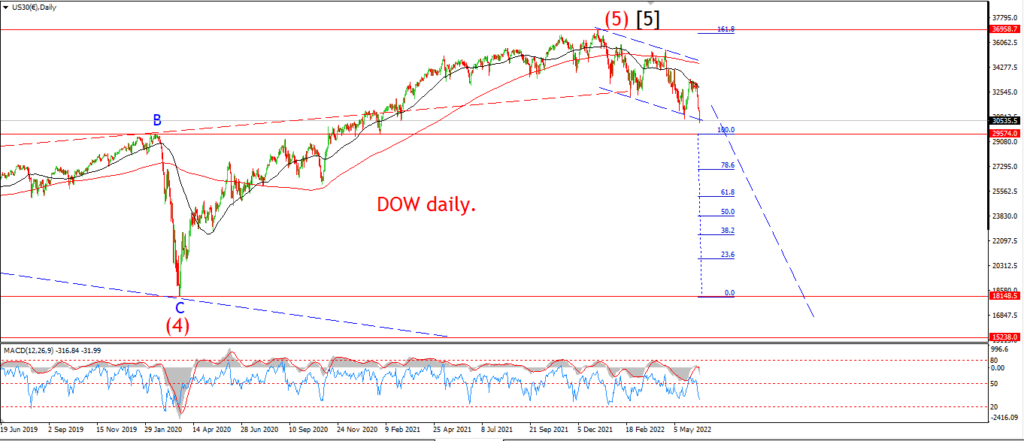
I know that I have been warning of impending doom in my nightly updates and the weekend videos for some time now.
Sounding the alarm about a third wave acceleration lower to to deliver a knockout blow to the financial markets and economy.
It seems like I am crying wolf at this point,
even though the market continues to push to new lower lows each month,
the big knockout punch has not arrived yet!
But the story does not end there.
Lets just pick apart the recent decline to see of we are on track for a big drop in terms of the wave count.
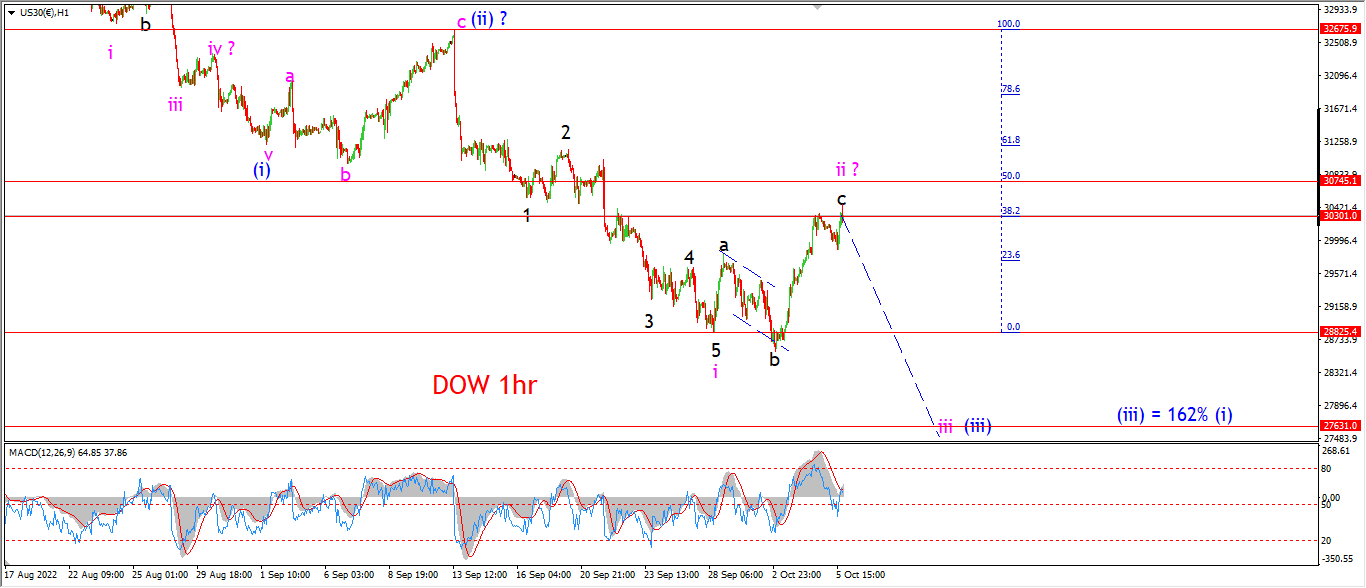
Wave ‘i’ pink has a perfect five wave internal structure.
Wave’s ‘1,3,5’ all have nice impulsive internal structures,
and waves ‘2,4’ are perfect corrections.
Overall this is a textbook five wave impulsive decline.
Now the reversal higher in wave ‘ii’ over the last week;
Wave ‘a’ can be viewed as either three or five as the action is tight and I can’t tell.
But the drop into wave ‘b’ to a new low is again a perfect three wave pattern.
So wave ‘ii’ is now classified as an expanded flat correction.
Wave ‘c’ should trace out five waves up to break the wave ‘a’ high at a minimum.
And this is where we stand right now.
The pattern is as good as it gets in terms of a bearish impulse wave.
A solid 5,3 decline and a lower high now completing.
All that is left to happen is for wave ‘iii’ to begin with another drop.
A rally over the last few days has really lit up the imagination of the market!
And of course the headlines now suggest there is more in the tank for the rally and the maybe even the chance of a lasting bottom.
So the immediate fear has been cleared from the system now.
I cannot say that wave ‘iii’ is going to begin tomorrow,
but I will say that the pattern is as good as complete here for wave ‘i’ and ‘ii’.
and if I am correct,
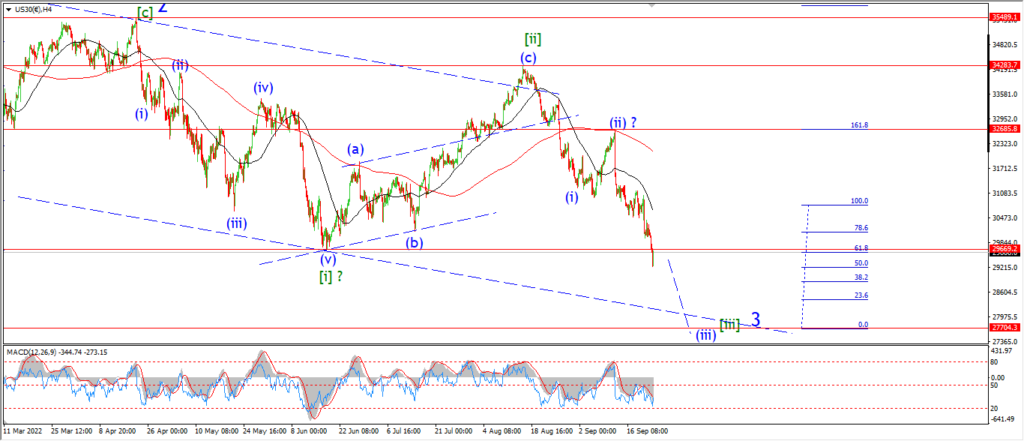
then wave ‘iii’ of (iii) is the next logical step in this pattern.
Tomorrow;
Watch for wave ‘ii’ to show signs of a top and reversal.
The market has already hit the 38.2 % Fib line
GOLD
GOLD 1hr.
GOLD 4hr.

GOLD daily.
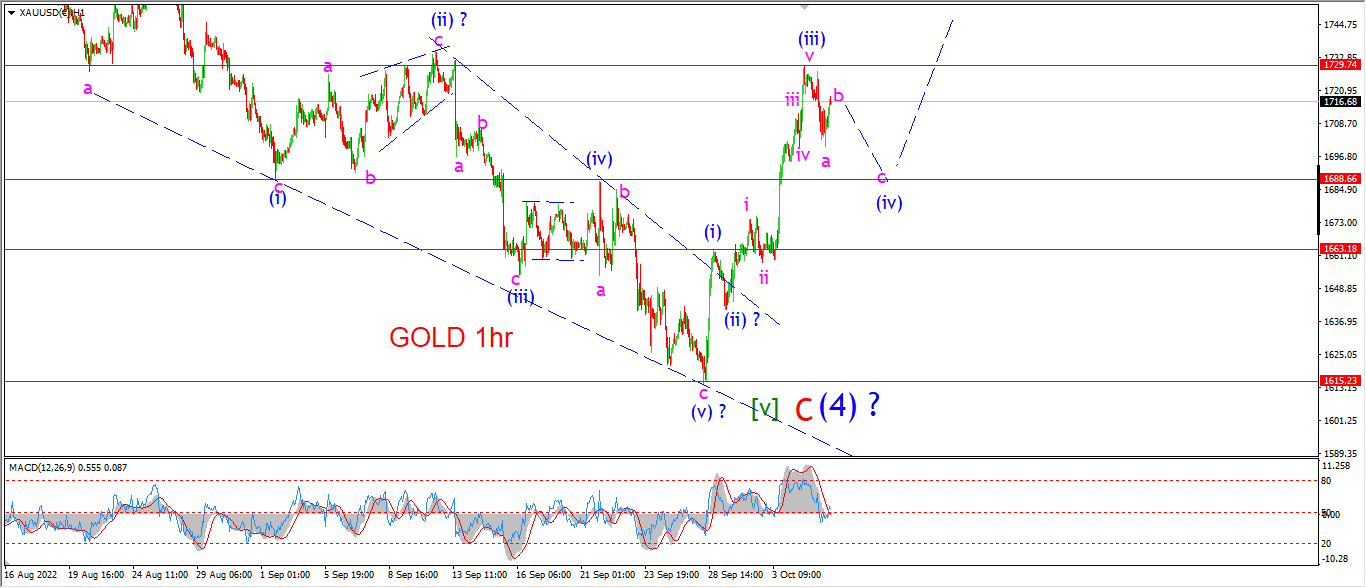
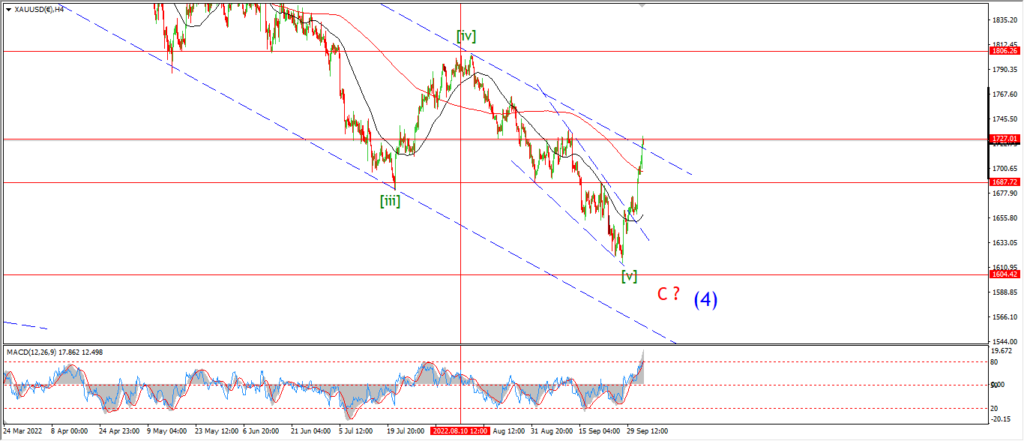
Gold has come off the boil today and I am counting this as the initial step down into wave (iv) blue.
Wave’s ‘a’ and ‘b’ of (iv) may already be complete as I write.
The price is sitting at a lower high now,
and wave ‘c’ should fall again towards 1690 again to complete three waves down and set up for a rally into wave (v) before the end of the week.
The cut off for this bullish count lies at 1663 at the wave (i) high.
If that level breaks,
then I will have to reconsider this bullish count again as wave (iv) should not break the wave (i) high.
Tomorrow;
Watch for wave ‘c’ of (iv) to turn lower again and complete near 1690 again.
That action should set us up for a rally into wave (v) of [i] beginning on Friday.
CRUDE OIL.
CRUDE OIL 1hr.
CRUDE OIL 4hr.
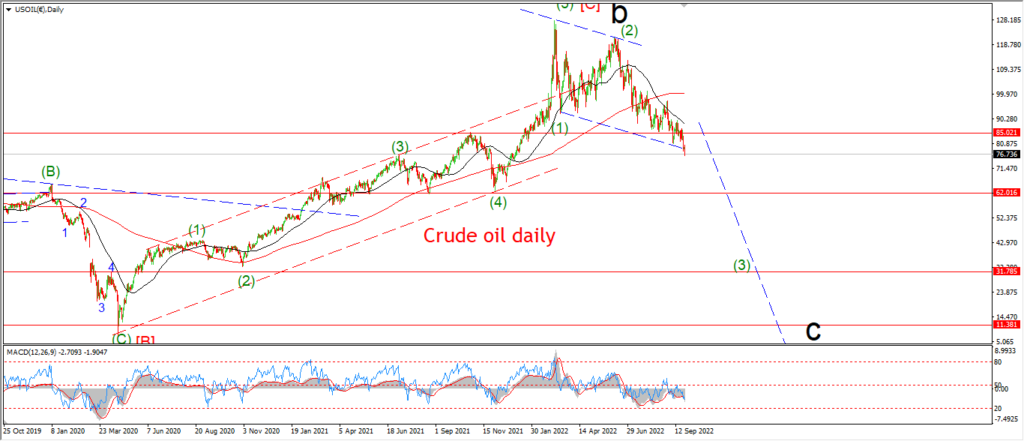
CRUDE OIL daily.
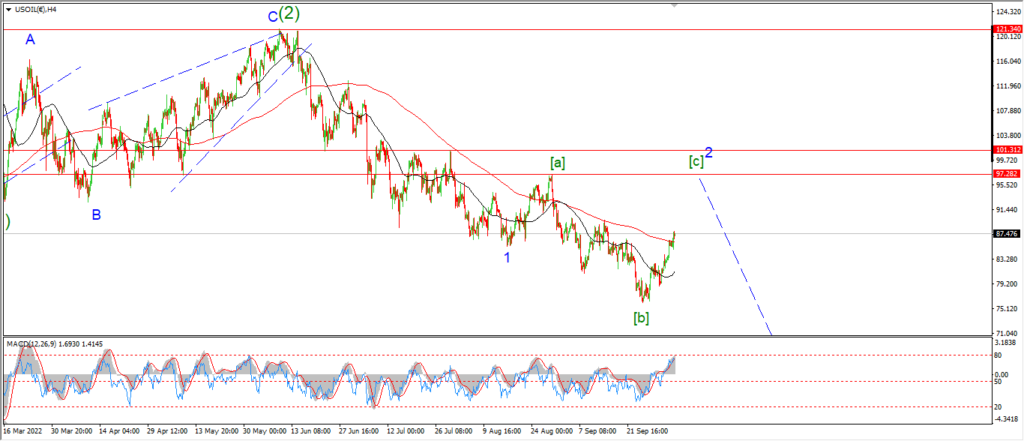
I am looking at a few options for the wave count in crude after the action today.
The overall picture does not change much,
but I am switching to a larger correction in wave [ii] on the hourly chart.
First;
I have shown the alternate count for wave ‘1’ and ‘2’ blue on the 4hr chart tonight.
this involves an expanded flat correction in wave ‘2’ now ongoing.
The rally off the recent low is viewed as wave [c] of ‘2’,
and this rally in wave [c] should complete with a break of the wave [a] high at 97.30.
Keep in mind this is the alternate count at the moment.
So I will continue to focus on the main count until that becomes un workable.
The rally today has ruled out last nights count.
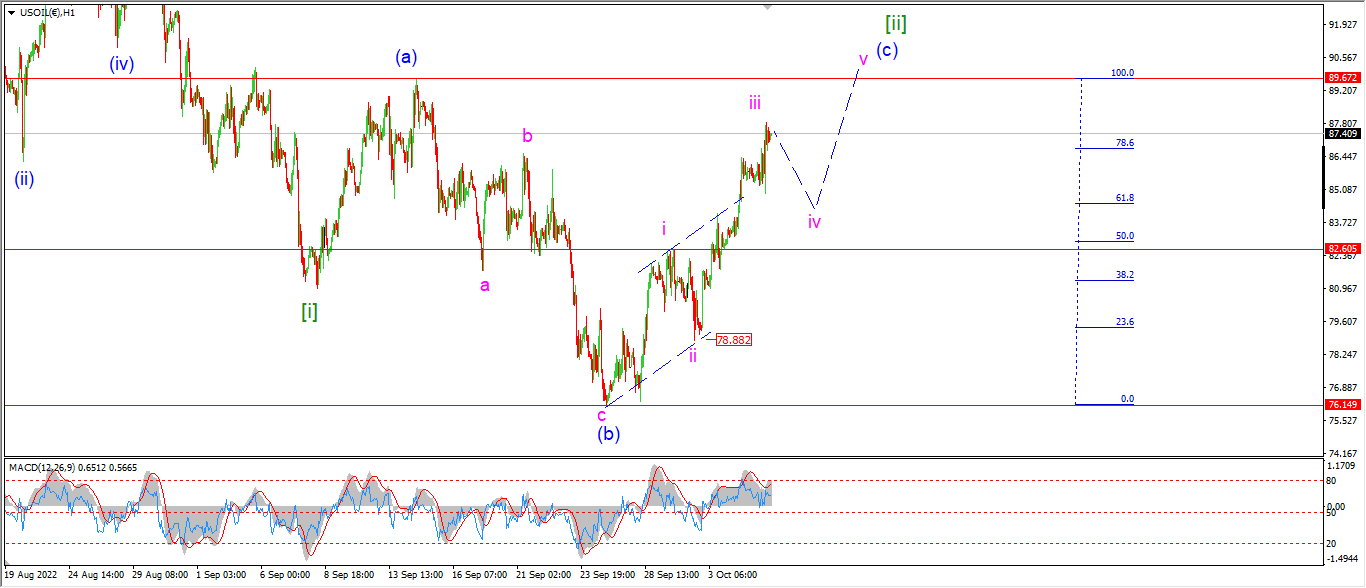
Today I am looking at a possible wave (c) of [ii] rally underway.
Wave (c) is expected to hit the 89.70 area to complete this correction.
And wave [iii] down should then begin next week.
Tomorrow;
Watch for wave ‘iv’ of (c) to fall again and hold above the wave ‘i’ high at 82.60.
A break of that wave ‘i’ high will flip the odds back in favor of the more bearish count I showed last night.
S&P 500.
S&P 500 1hr
S&P 500 4hr
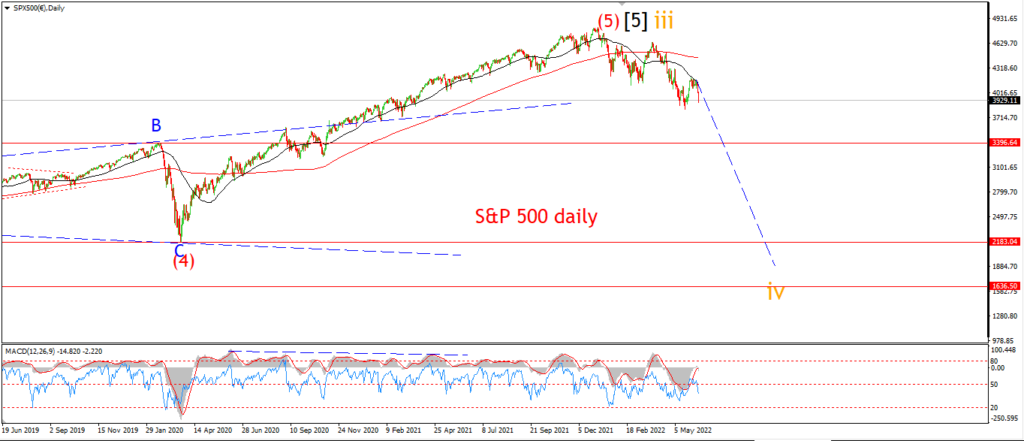
S&P 500 daily.
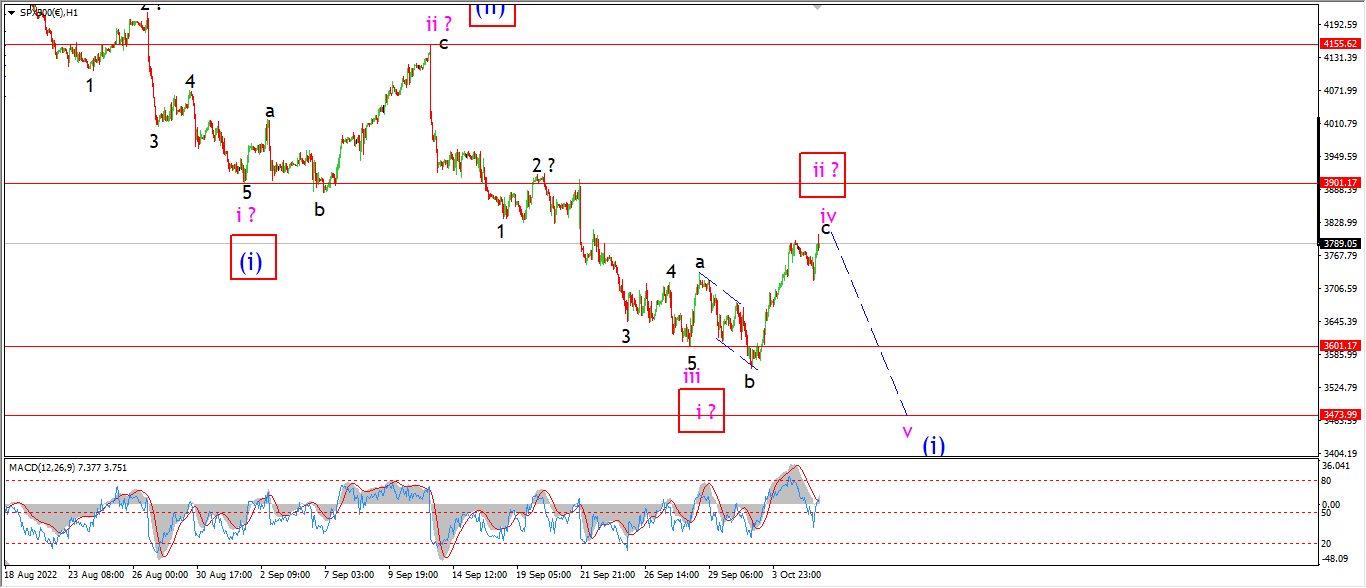
The wave count in the S&P is holding tonight even after a very slight new high in wave ‘c’ this evening.
This wave count will hold unless we see a break above the wave ‘i’ low at 3901 again.
The pattern for wave ‘iv’ is the same as the operating pattern in wave ‘ii’ in the Dow.
So this expanded flat correction pattern is complete here as far as I can see.
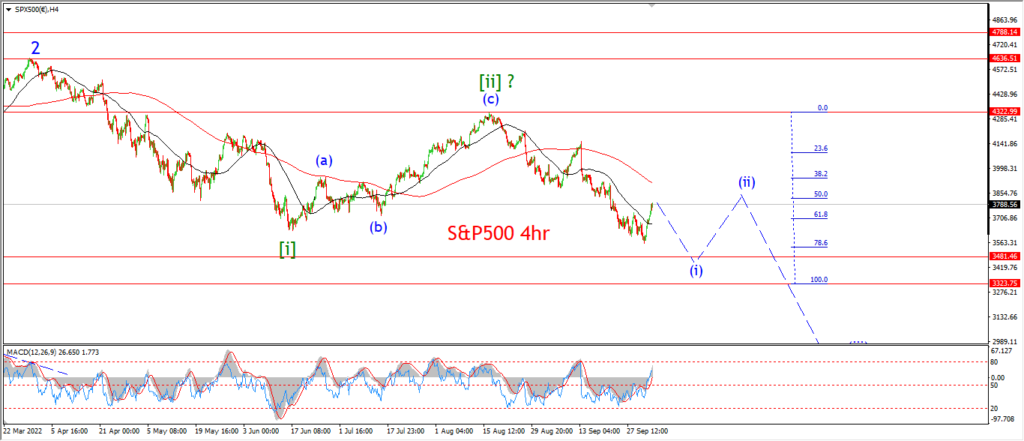
The next step for this pattern is wave ‘v’ down to take the market lower again to break 3500.
That will complete five waves down in wave (i),
and wave (ii) will be set to correct higher again later in the month.
If the market starts to plunge sooner than that,
then wave (iii) of [iii] down will already have begin.
And the count will change to match the Dow again.
I have shown this count in red on the hourly chart.
Tomorrow;
Watch for wave ‘iv’ of (i) to top out and then reverse back below 3700 to signal that wave ‘v’ has begun.
SILVER.
SILVER 1hr
SILVER 4hr.
SILVER daily.
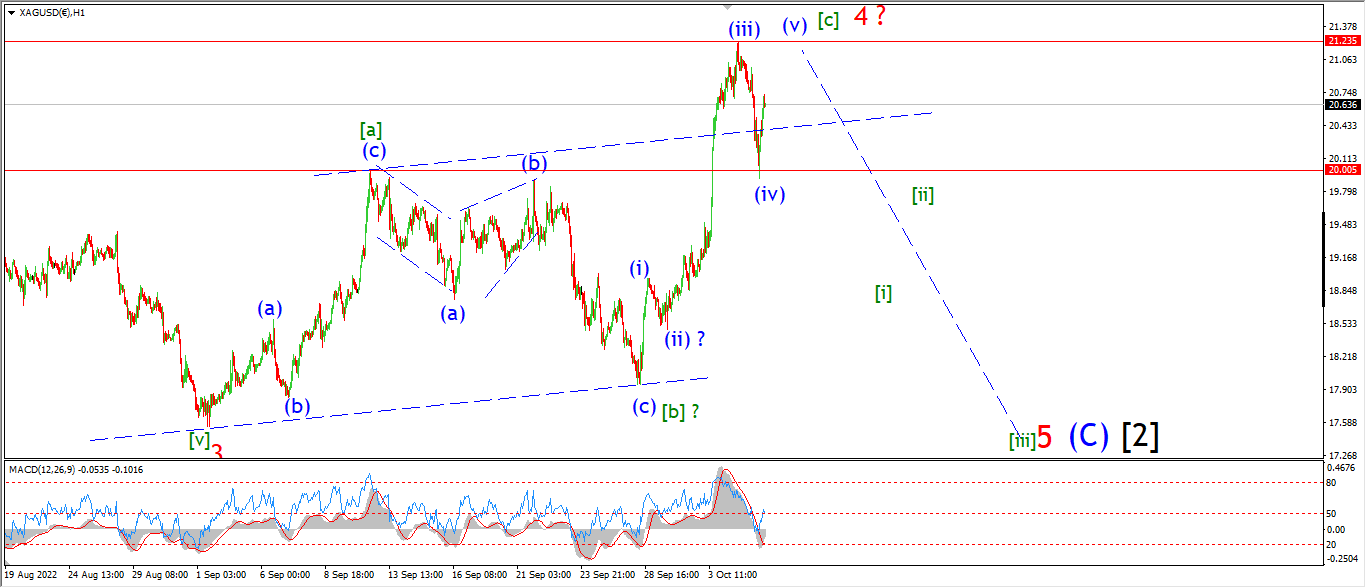
Silver fell hard this morning and that drop was big enough to consider wave (iv) already complete at the lows.
The rebound off the lows is pointing to that idea also.
Wave (iv) found support at the precious wave [a] high.
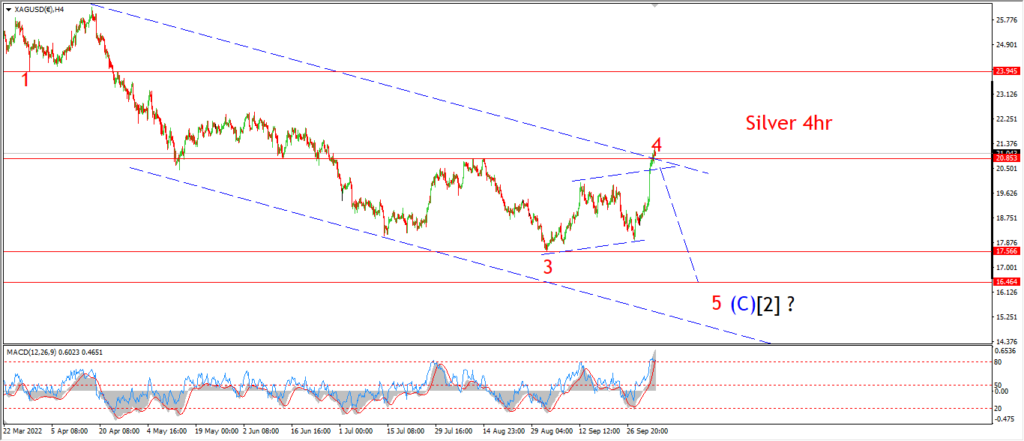
and wave (v) of [c] of ‘4’ should now push higher to break the wave (ii) top at 21.23 to complete this correction in wave ‘4’ again.
Silver is going to reach a very vulnerable point over the next few sessions as wave [c] completes.
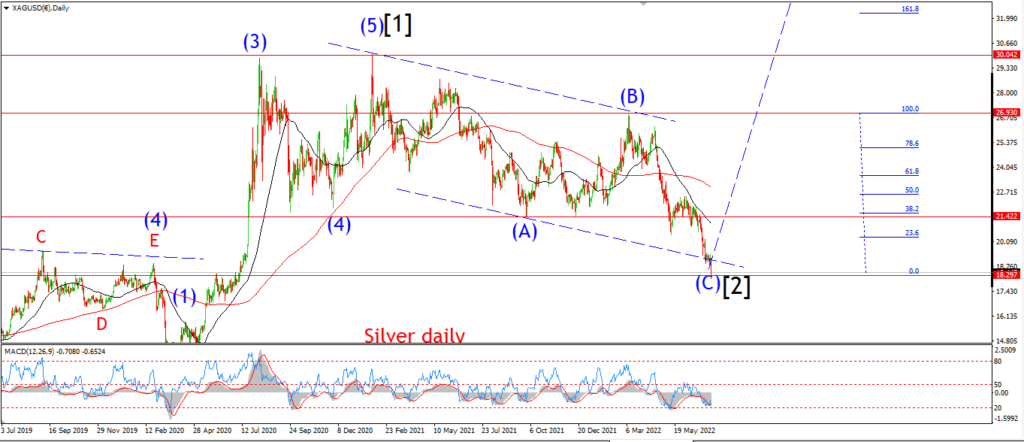
So I would not be surprised at all if we see a very sharp reversal begin next week into wave ‘5’ of (C) of [2].
Tomorrow;
Watch for wave (v) blue to continue higher and break 21.23 over the coming few sessions.
I will be watching for a big reversal pattern to begin next week into wave [i] of ‘5’.
BITCOIN
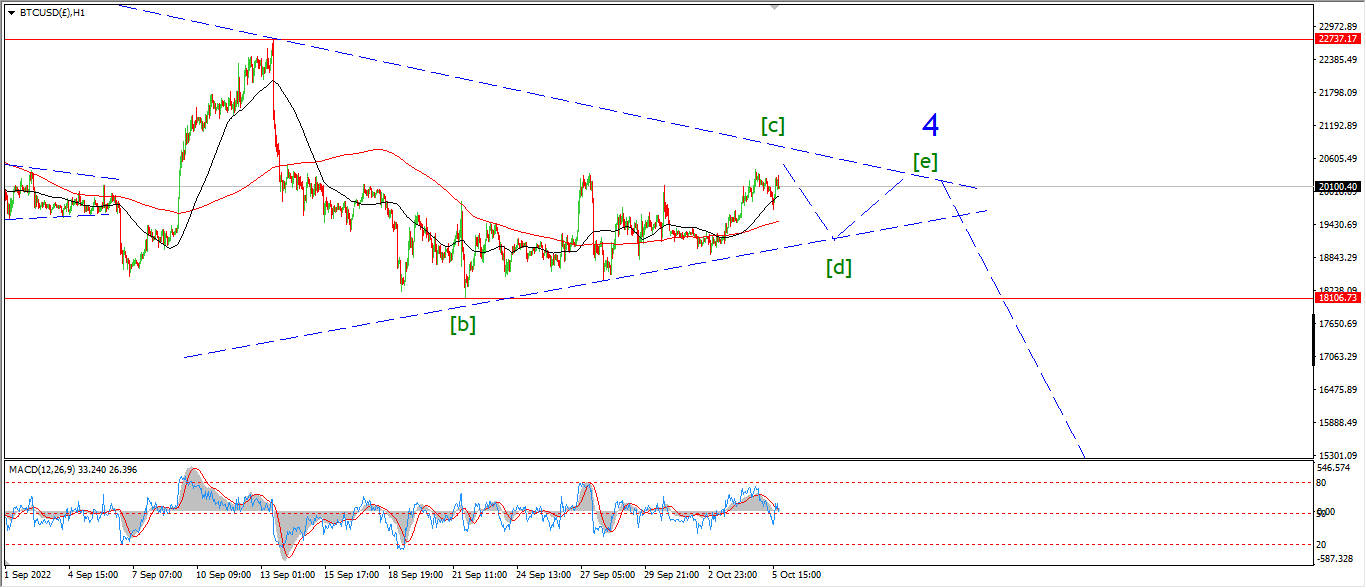
BITCOIN 1hr.
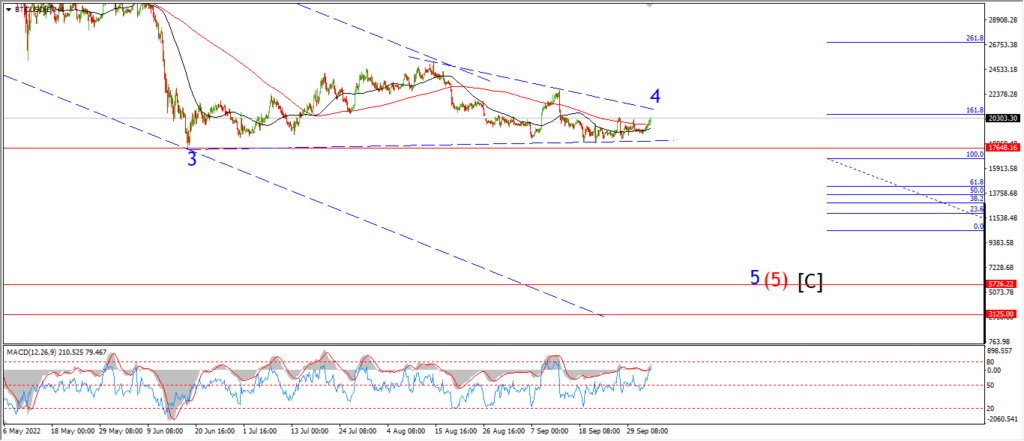
BITCOIN 4hr.

BITCOIN daily.
….
FTSE 100.
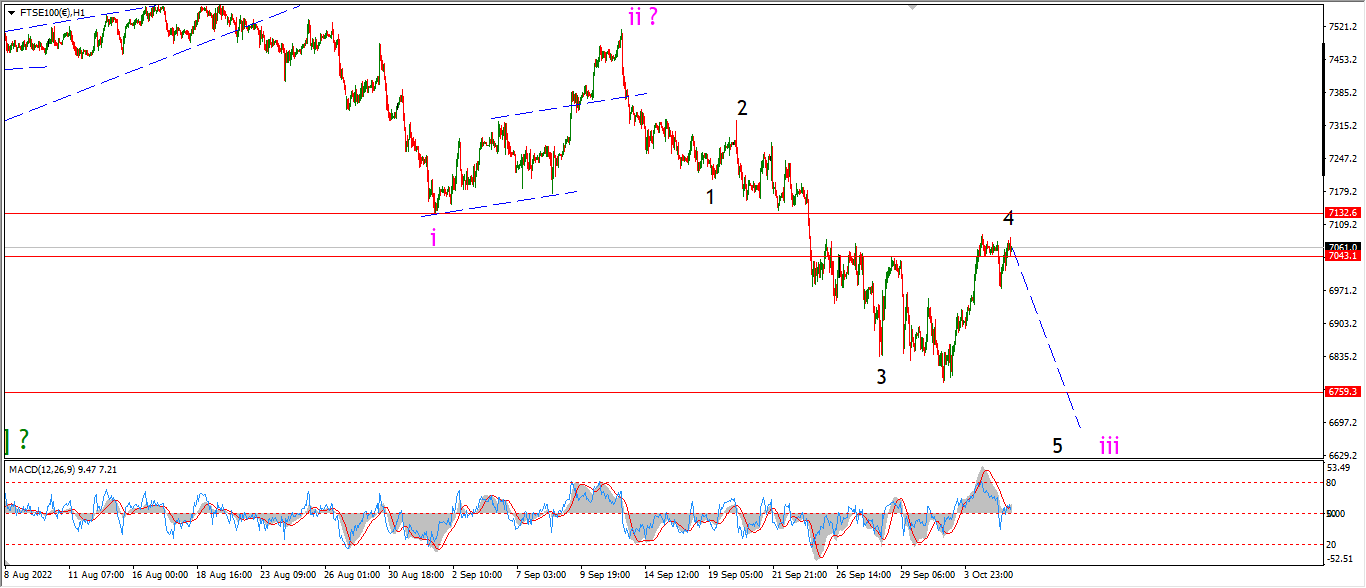
FTSE 100 1hr.
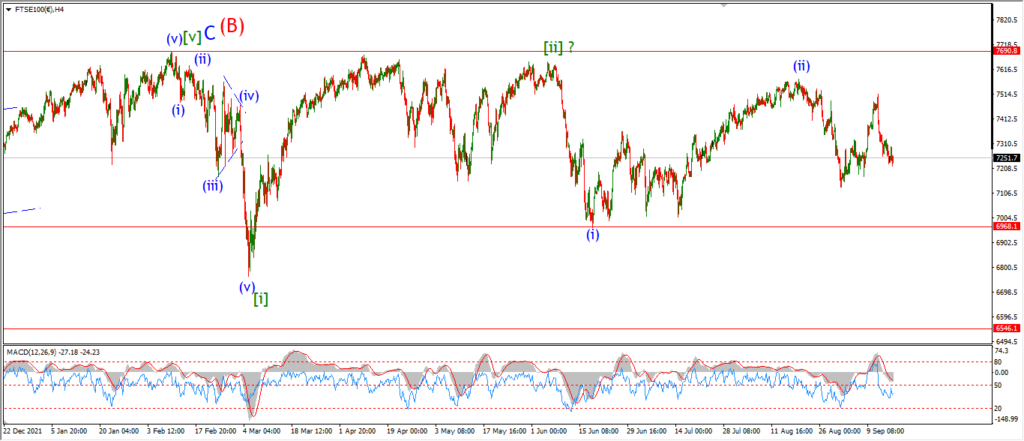
FTSE 100 4hr.

FTSE 100 daily.
….
DAX.
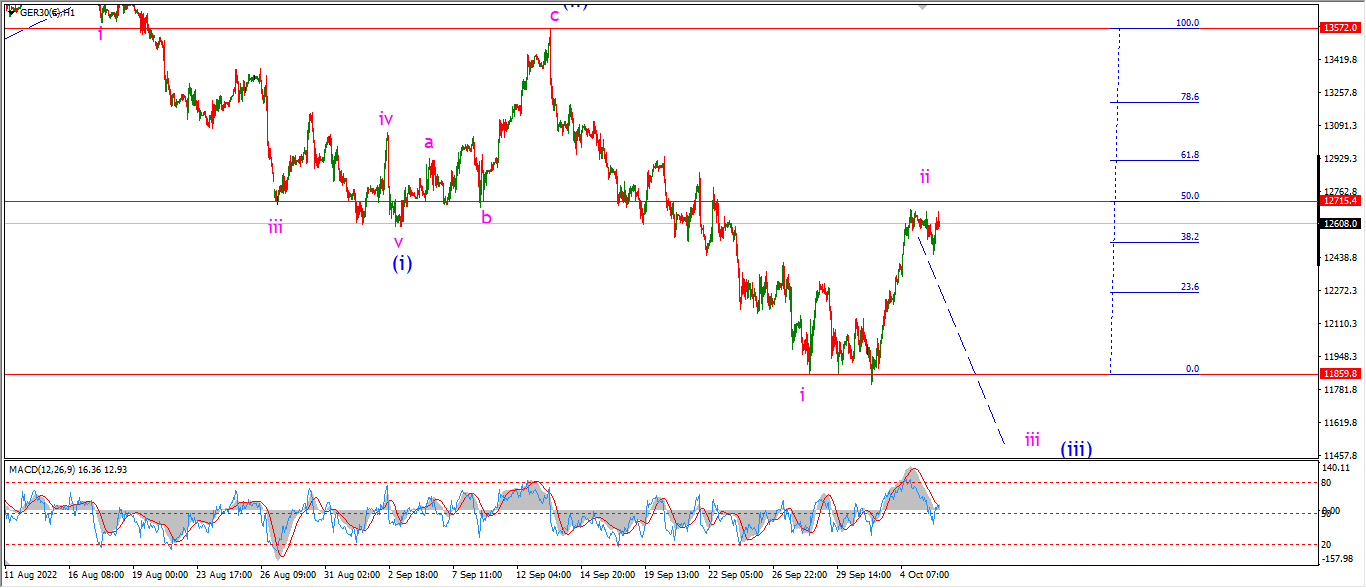
DAX 1hr
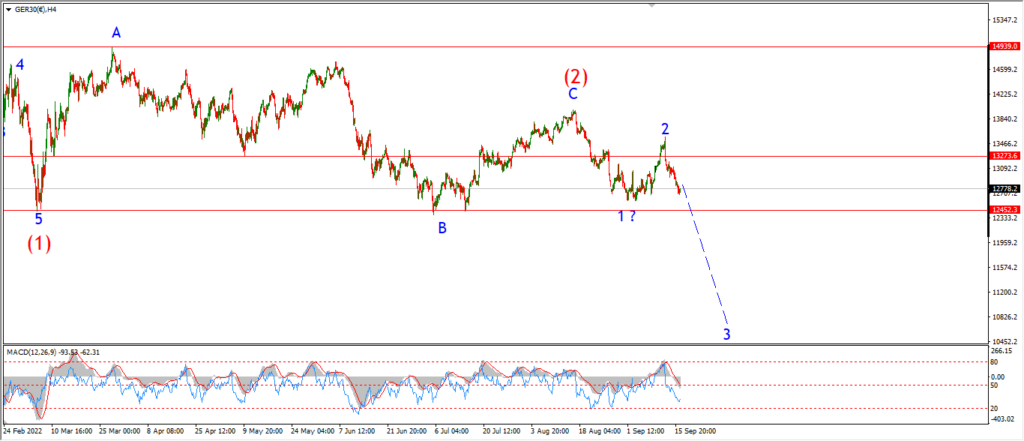
DAX 4hr

DAX daily.
….
NASDAQ 100.
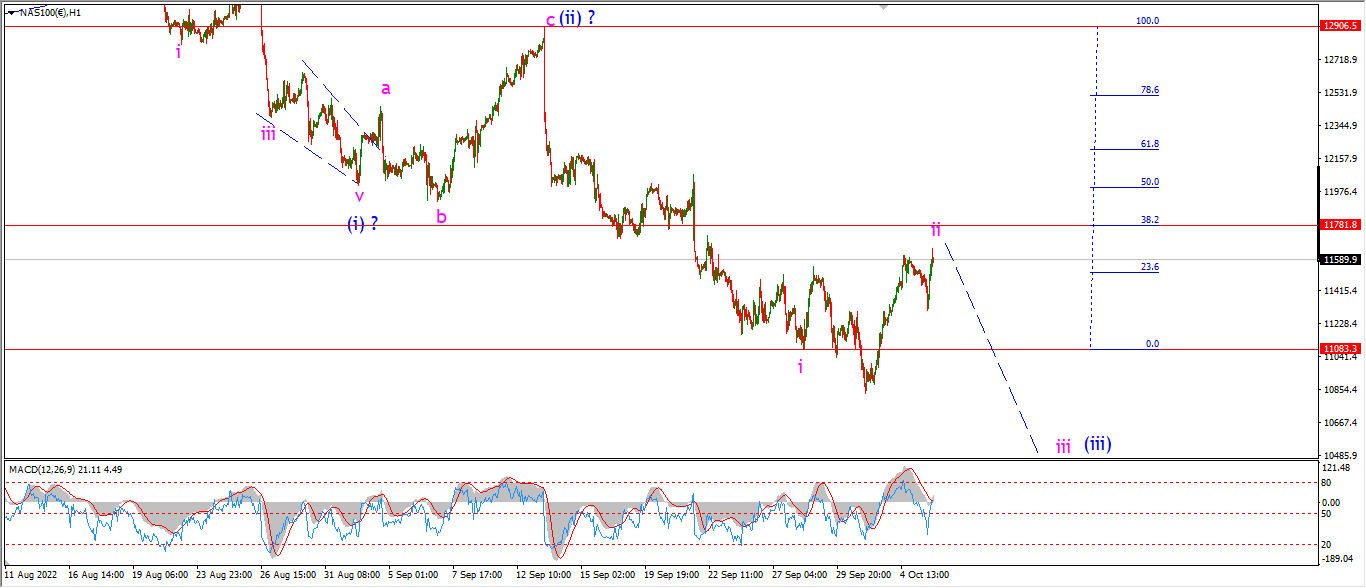
NASDAQ 1hr
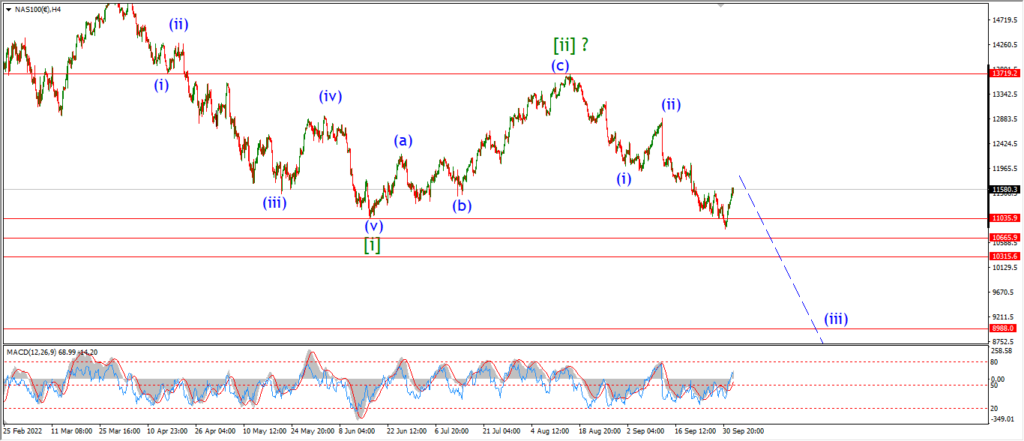
NASDAQ 4hr.
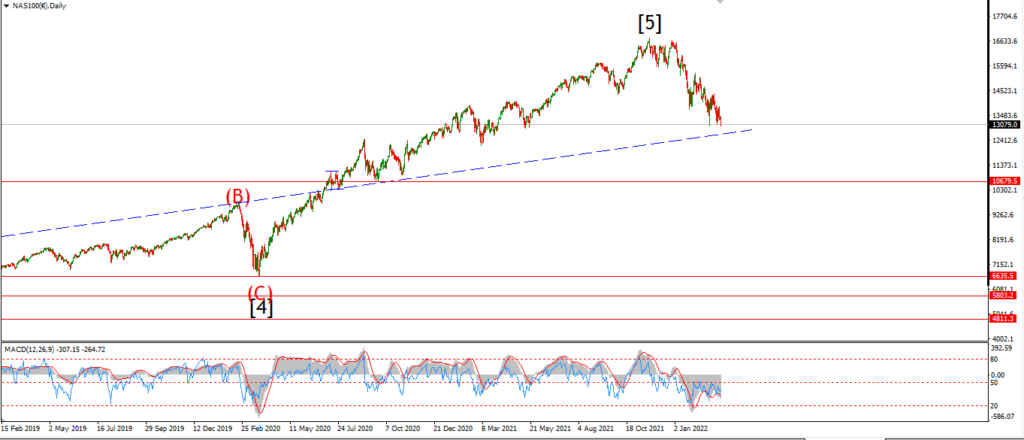
NASDAQ daily.
….