
Good evening to you folks.
God’s blessings to you all tonight.
EURUSD.
EURUSD 1hr.
EURUSD 4hr.

EURUSD daily.
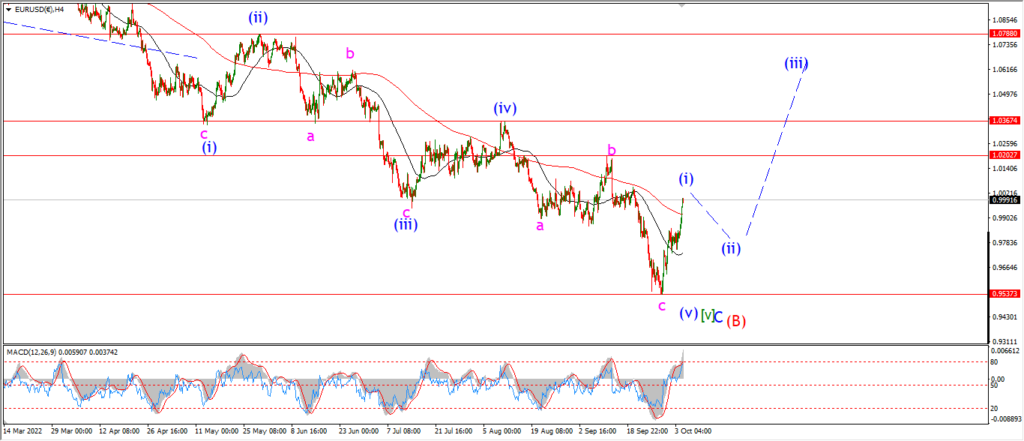
I will start on the 4hr chart.
EURUSD has done enough in this rally to consider the recent low as a completed wave (B) in red.
The action off the low extended again today and now the pattern is better viewed as a five wave rally rahter than a three wave correction.
If the low is now in for wave (B) red as I am suggesting
then we can now turn our attention to the initial impulse pattern to begin wave (C).
The potential targets for wave (C) start at about 1.18 if this is going to be a large correction higher,
and can go as high as 1.25 if this will actually complete an expanded flat correction in wave (C) of [B] as per the main count.
Tomorrow;
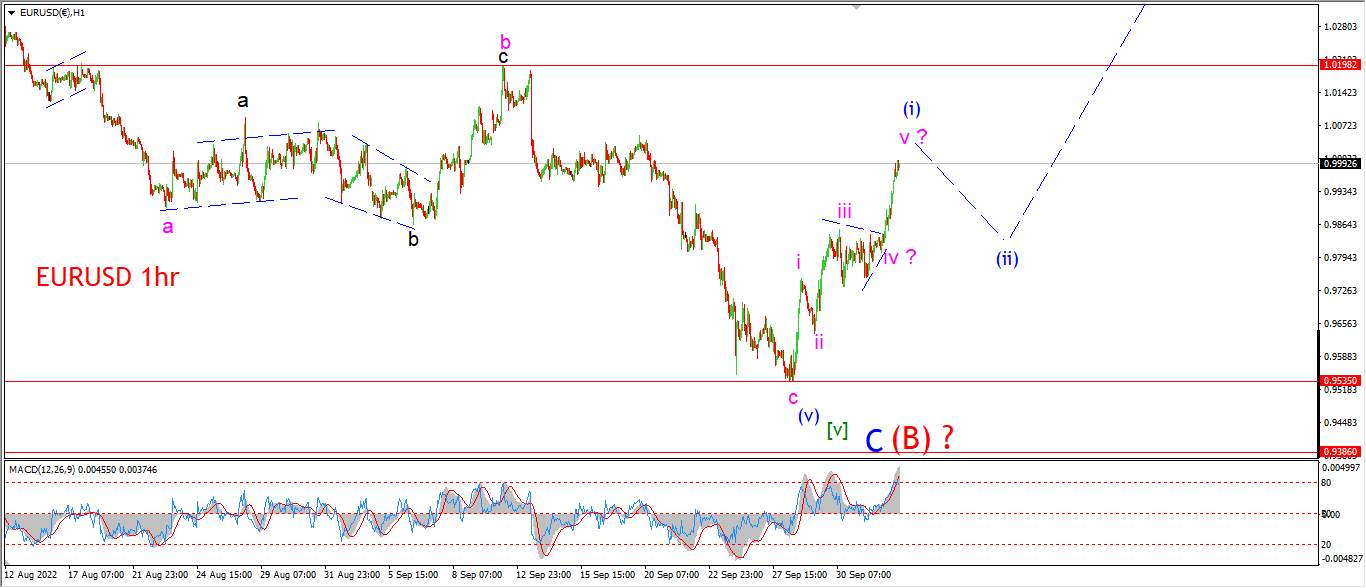
EURUSD has not broken any upside resistance level yet,
the first resistance lies at 1.0198.
I have labelled this rally off the low as complete as wave (i).
I am going to look for a bullish higher low in wave (ii) over the coming days.
watch for a correction to begin into wave ‘a’ of (ii) tomorrow.
GBPUSD
GBPUSD 1hr.
GBPUSD 4hr.

GBPUSD daily.
The action in cable has forced a rethink of the pattern also tonight.
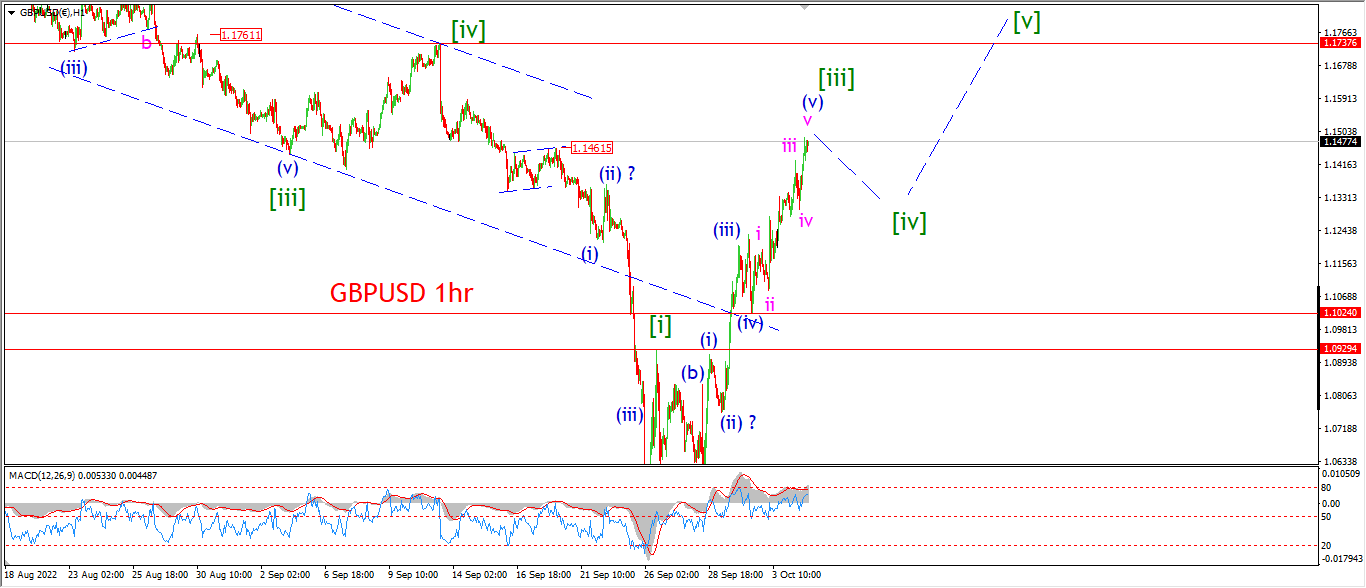
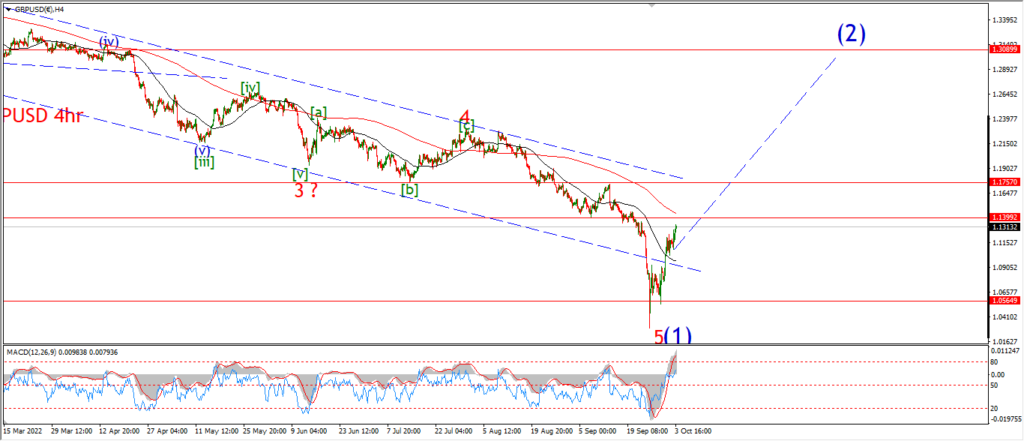
I am looking at todays extended rally as wave (v) of [iii].
And in this scenario we should see a correction begin into wave [iv] over the coming days as shown.
This correction in wave [iv] must hold above 1.0929 at the wave [i] high.
And wave [v] will then carry higher again to break above 1.1700.
Tomorrow;
Watch for wave [iii] to show sign of a top very soon.
The internal pattern in wave [iii] is complete.
And wave [iv] is expected to begin tomorrow which should fall in three waves to the 1.14 area.
USDJPY.
USDJPY 1hr.
USDJPY 4hr.

USDJPY daily.
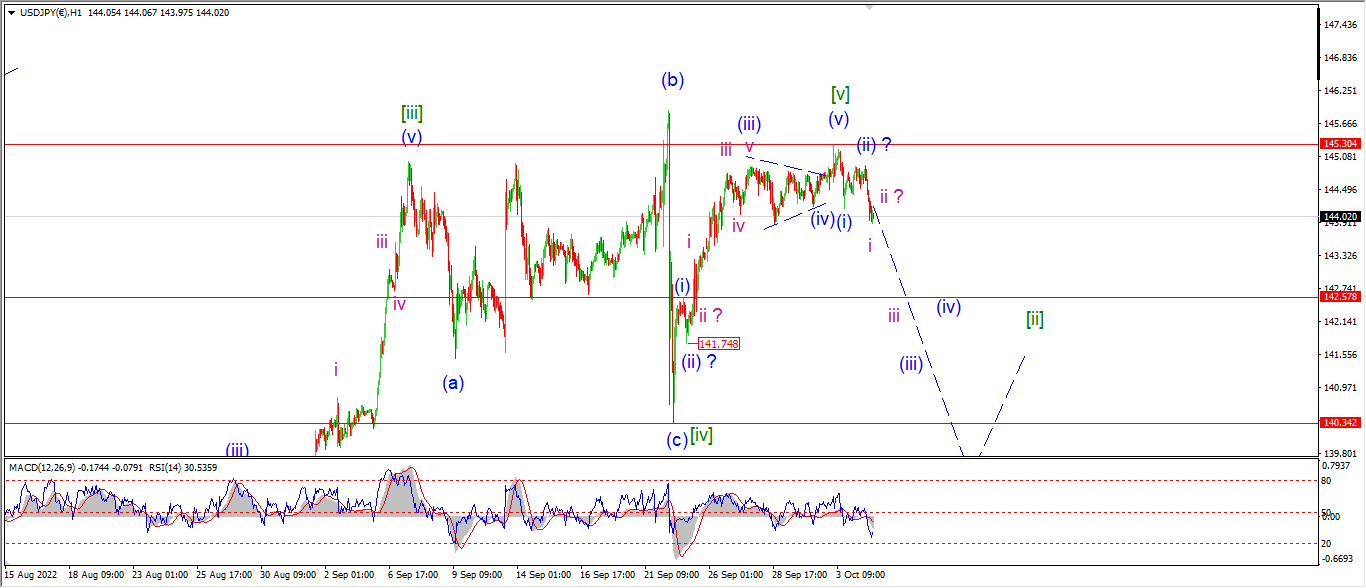
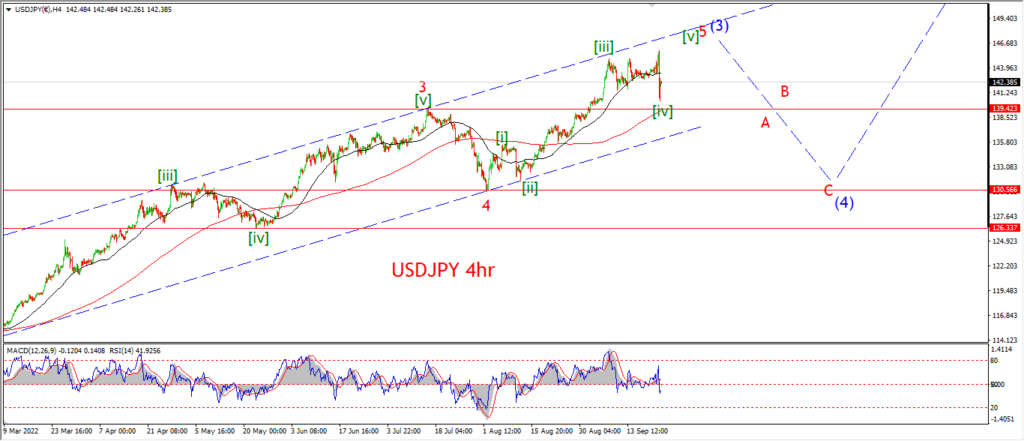
So far USDJPY has only fallen in three waves off the top at 145.30.
I am not completely convinced by the short term count to be honest,
but I do think it is worth considering that at least a medium term top is now in place here.
I do need much more downside action to confirm the top is in place,
but if we do see a break of that wave (i) high at 142.57 again,
I think that will tip the balance in favor of a continued decline over the weeks to come.
Tomorrow;
Watch for wave (iii) of [i] to trace out five waves down as shown.
Watch for a break of 142.57 as suggested.
DOW JONES.
DOW 1hr.
DOW 4hr
DOW daily.
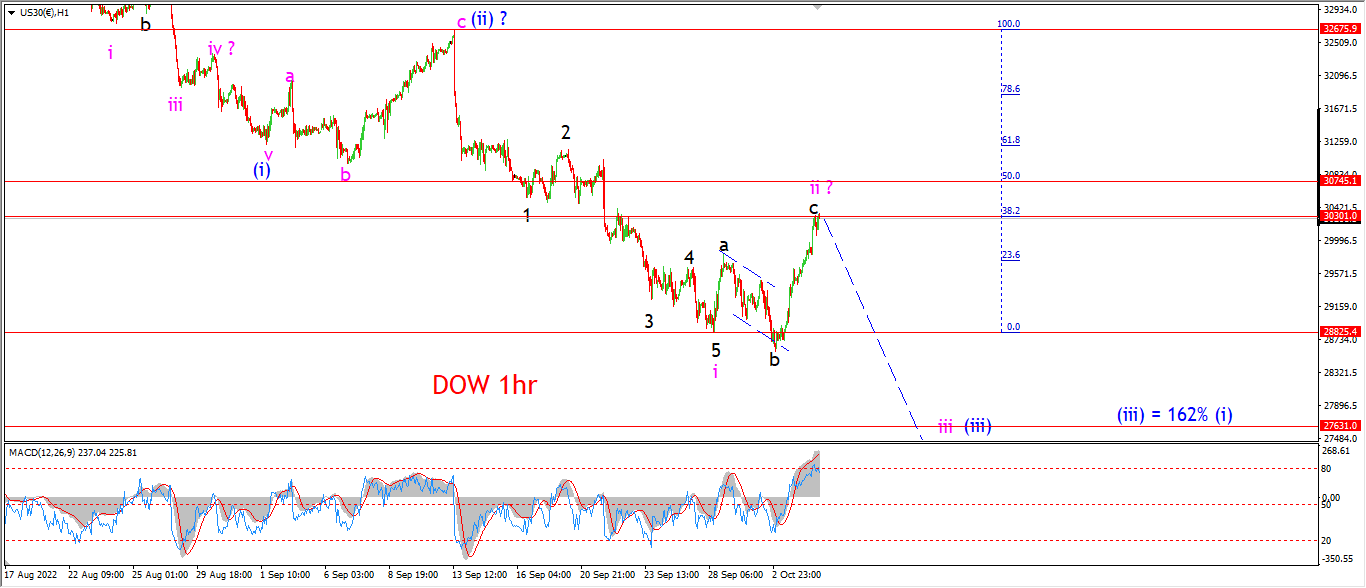
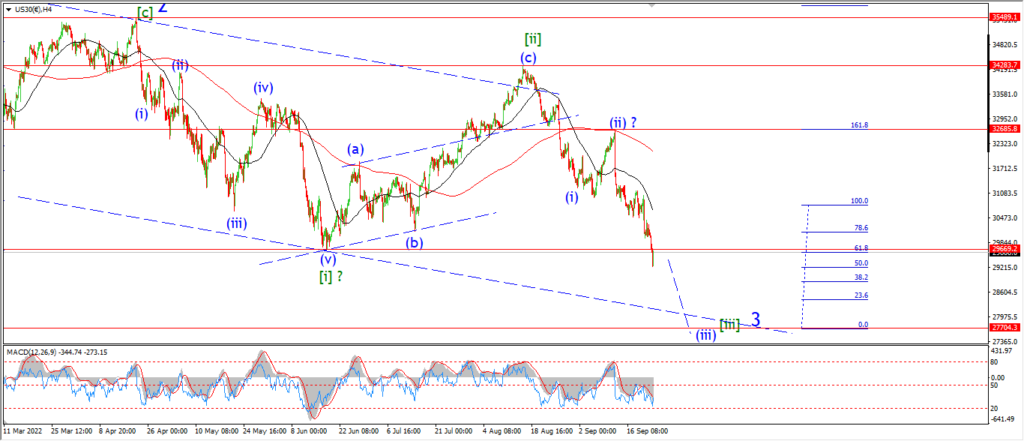
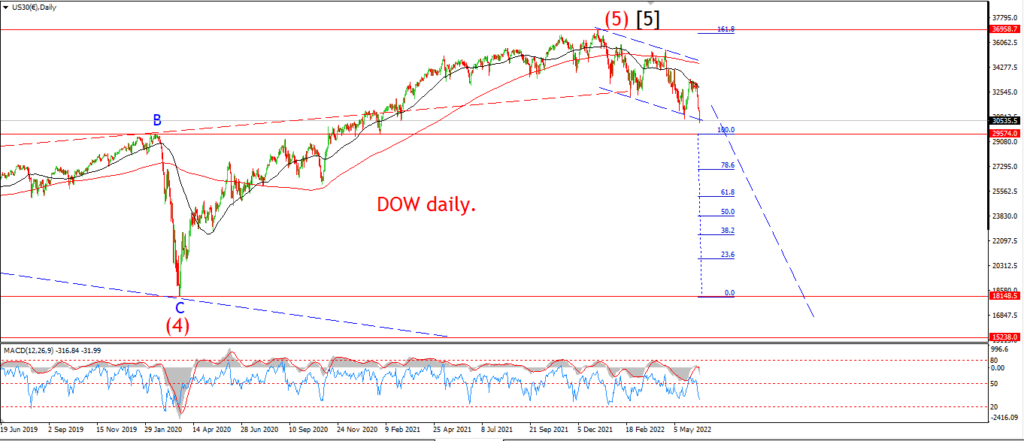
Last nights wave count has not been invalidated just yet,
but the market came so close to it today that I think it is time to reconsider what is happening in this rally.
I do still believe this is a rally in a wave ‘c’ of a correction.
But the correction is now wave ‘ii’ of (iii),
rather than the internal correction within wave ‘iii’ that I was looking at last night.
This count does allow for this rally to continue higher to complete,
but I will just have to see how much more momentum wave ‘c’ has left in it.
I suspect not much,
but we will see soon enough.
The rally into wave ‘ii’ has already hit the 38% Fib retracement of wave ‘i’ today.
And that is the first area where you might expect a second wave to complete.
I have marked the 50% level at 30745 also.
So I would like to see this rally lose steam very soon and reverse in that target area over the coming days.
Tomorrow;
Watch for wave ‘c’ of ‘ii’ to top out and reverse beginning tomorrow.
Wave ‘iii’ cannot be confirmed until we see a break to a new low.
But a small lower high off wave ‘ii’ should signal that a turn lower is beginning.
GOLD
GOLD 1hr.
GOLD 4hr.

GOLD daily.
Ok,
Gold has now done enough to bring me out of my skepticism and look at the possibility of a turn around in the making here.
I cant confirm this count as it is way too early.
But we may be on the verge of that BIG rally into wave (5) that I have long been waiting for.
Start on the daily chart;
Wave ‘C’ of (4) has broken the lower trend channel line to create a throw over,
and now spiked out of that new low back into the trend channel again.
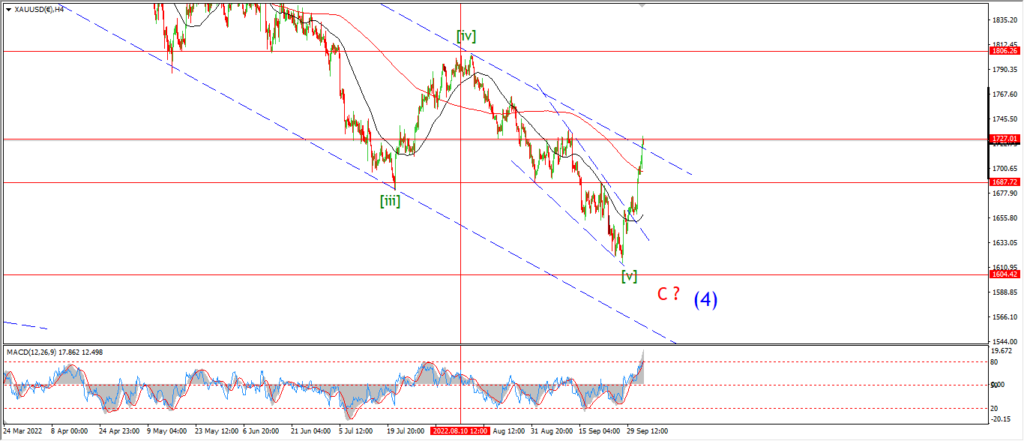
The 4hr chart;
Wave [v] of ‘C’ has possibly completed an ending diagonal wedge into the recent low.
The ending diagonal pattern is a terminal pattern,
and so that is another indication of a reversal in the making.
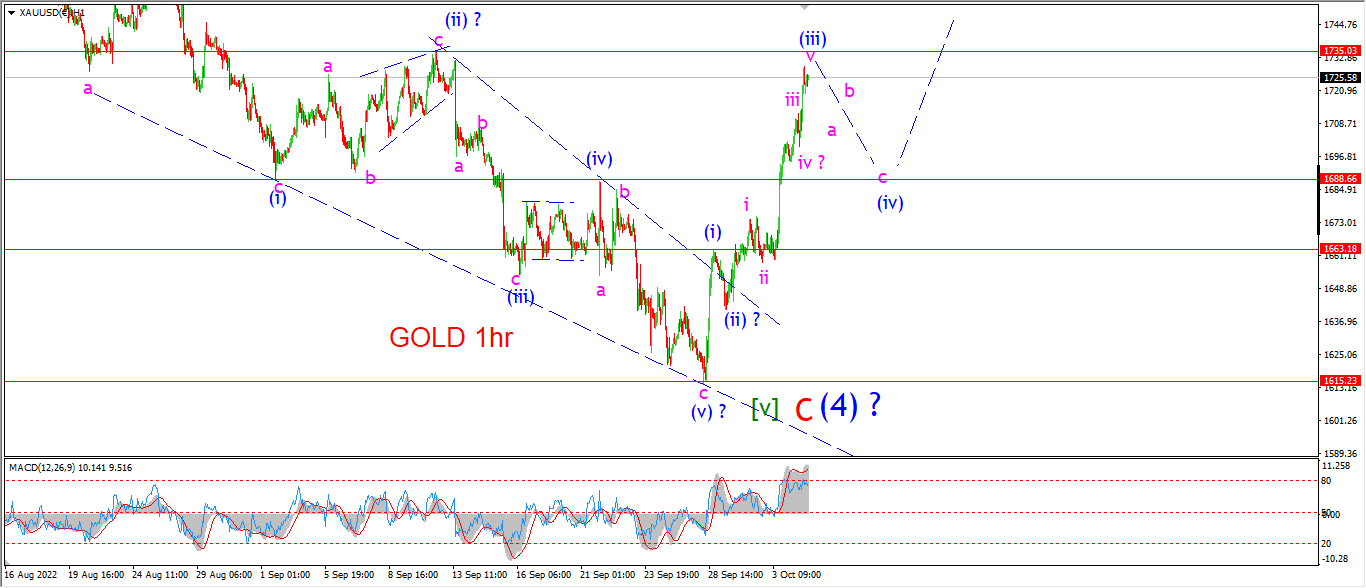
On the hourly chart you can see a developing five wave pattern higher off that 1615 low.
I can count a completed wave (i), (ii) and (iii) at todays highs.
The pattern calls for a correction into wave (iv) over the coming days.
And wave (iv) should hold above the wave (i) high at 1663.
A break of that high might call into question this renewed bullish pattern.
Tomorrow;
Watch for wave (iii) to top out by the end of the session tomorrow,
and then wave ‘a’ of (iv) should fall into 1710 again to signal wave (iv) is underway.
CRUDE OIL.
CRUDE OIL 1hr.
CRUDE OIL 4hr.
CRUDE OIL daily.
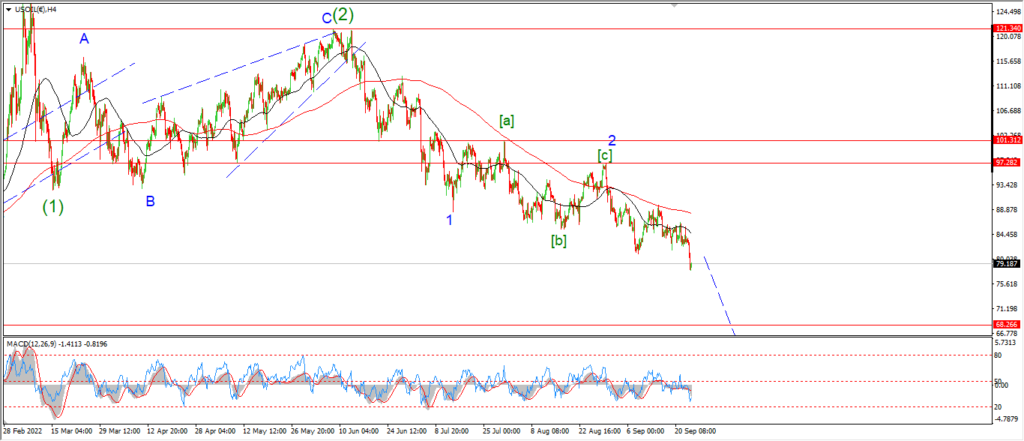
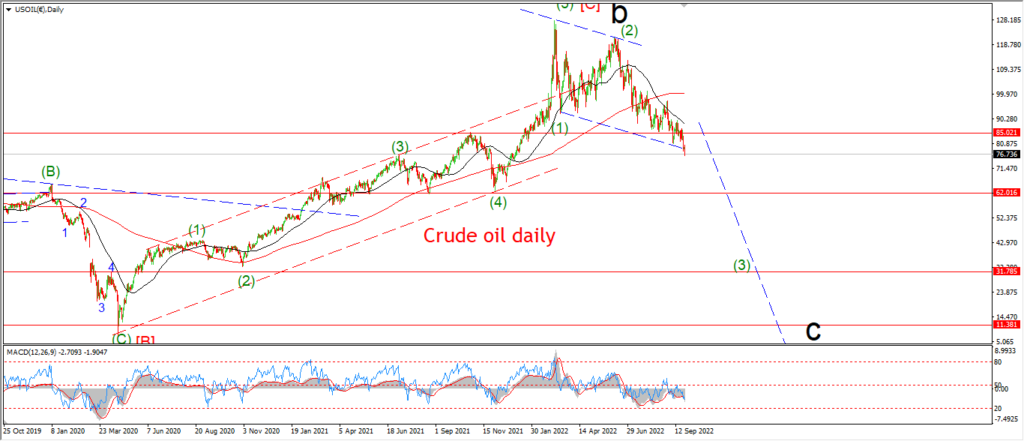
Crude oil has experienced a respite rally this week also along with much of the markets really.
This pattern has been pushed for sure,
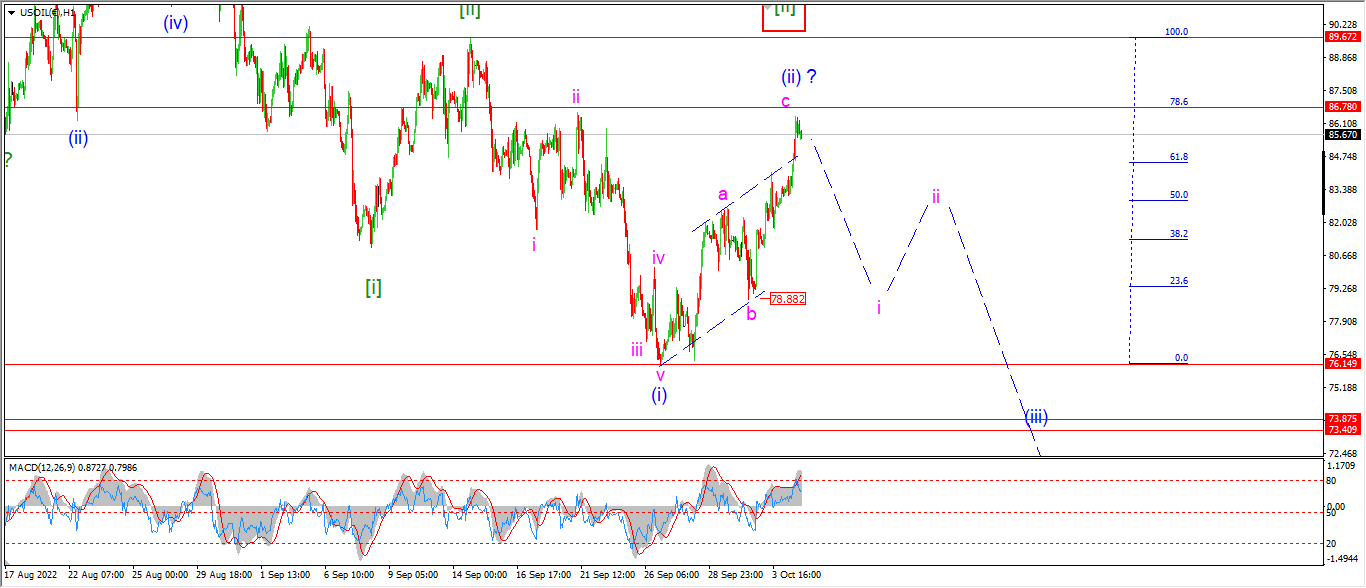
but in the case of crude I am not changing my take on the corrective nature of this action.
Wave ‘c’ has broken out above the upper trend line today.
the price has stopped short of breaking the 78.6% retracement level so far,
maybe we will see a challenge of that level before a turn lower happens into wave (iii).
we will know early tomorrow.
Tomorrow;
Watch for wave ‘c’ to top out and put an end to this relief rally.
Wave ‘i’ of (iii) should break the 78.88 low to signal wave (iii) has begun.
S&P 500.
S&P 500 1hr
S&P 500 4hr
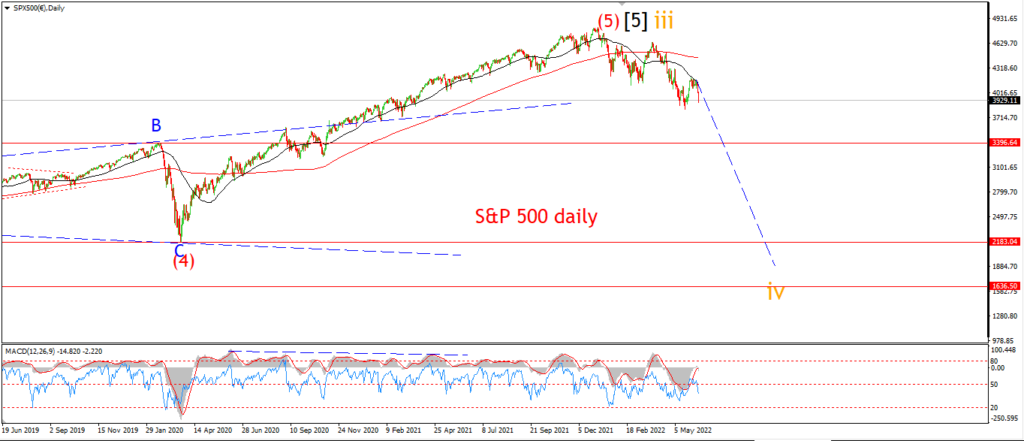
S&P 500 daily.
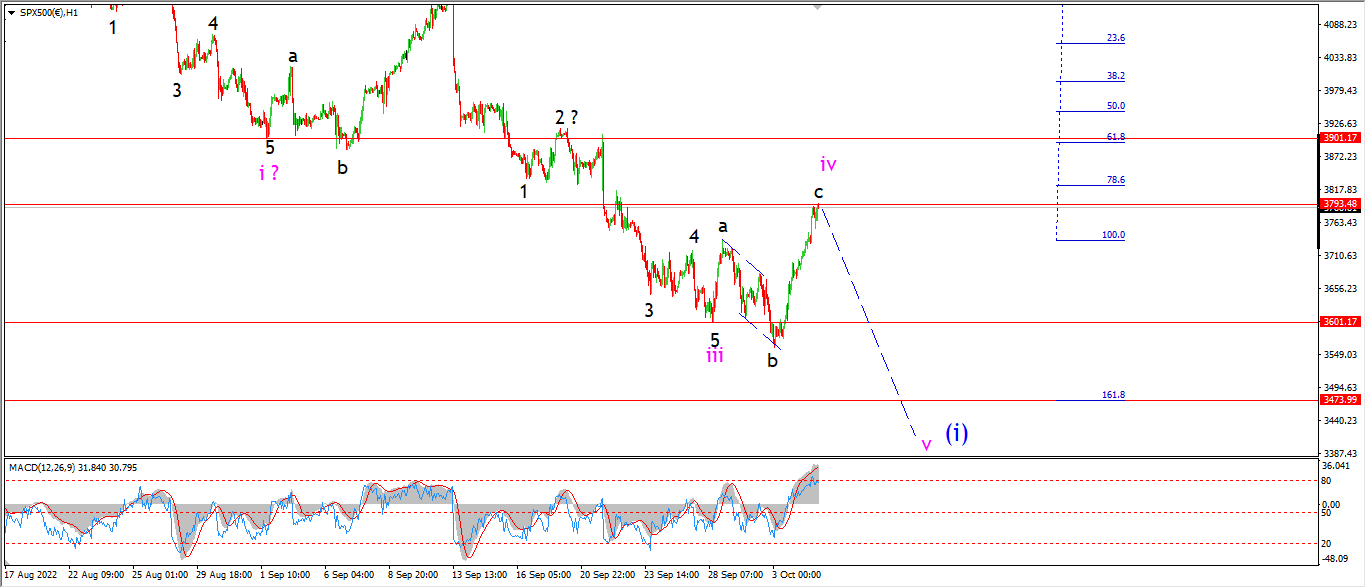
I am changing out the count in the S&P also this evening
as this rally has posed the same problem as in the DOW.
The rally over the last two days is just a little too large to stick with last nights count.
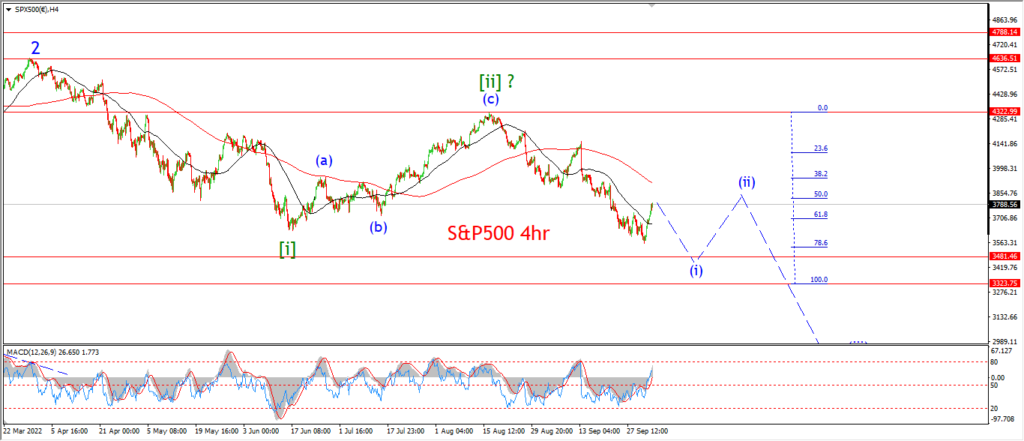
and now I am looking at the possibility of a wave ‘iv’ correction higher within wave (i) down.
Wave (i) blue is the beginning of wave [iii] green.
And if this count is correct,
then main acceleration phase lower will come in wave (iii) of [iii].
The larger pattern on the 4hr and daily chart shows the count in context.
And if we do see another drop in wave ‘v’ of (i) this week,
that will complete wave (i) and open the pattern up for another correction in wave (ii).
The main alternate count I can see here is shown on the daily chart.
And that will allow for a larger rally to complete wave ‘2’ off the all time high.
I do not favor this count at all,
but I cant rule it out either.
The sooner the market declines into wave ‘v’ the better as it will reduce the probability of that bigger alternate.
Tomorrow;
watch for this wave ‘iv’ correction to complete as an expanded flat correction.
Wave ‘v’ down should begin with a small lower high near 3700.
Wave ‘v’ of (i) should fall to a new low below 3500 if this count is correct.
SILVER.
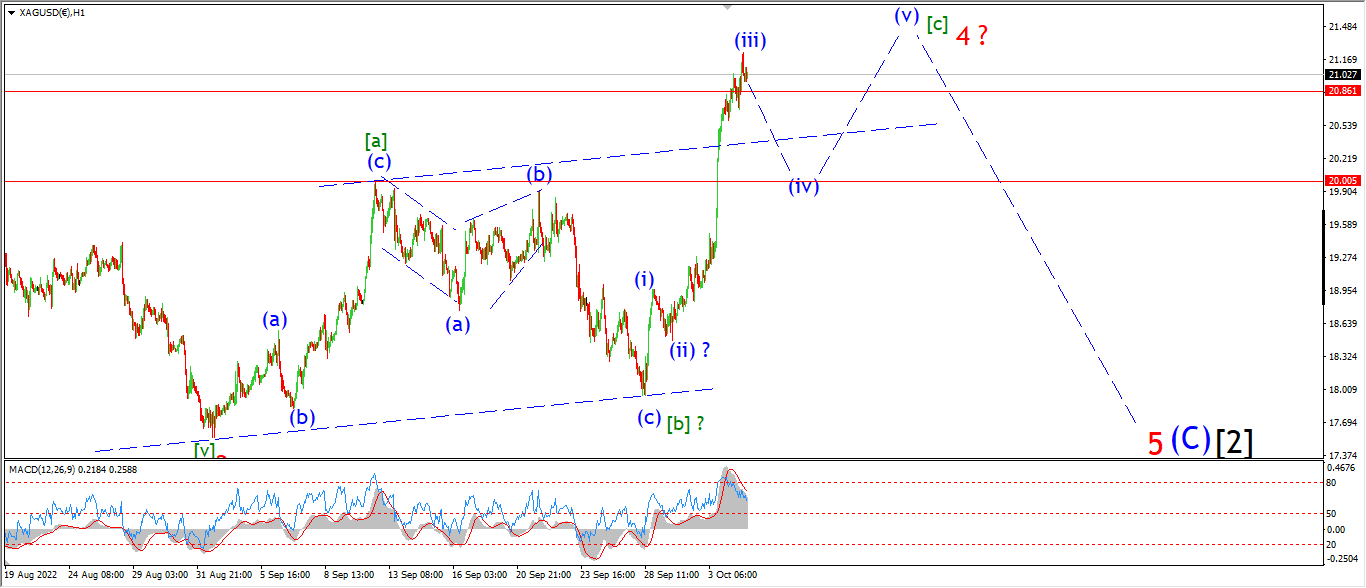
SILVER 1hr
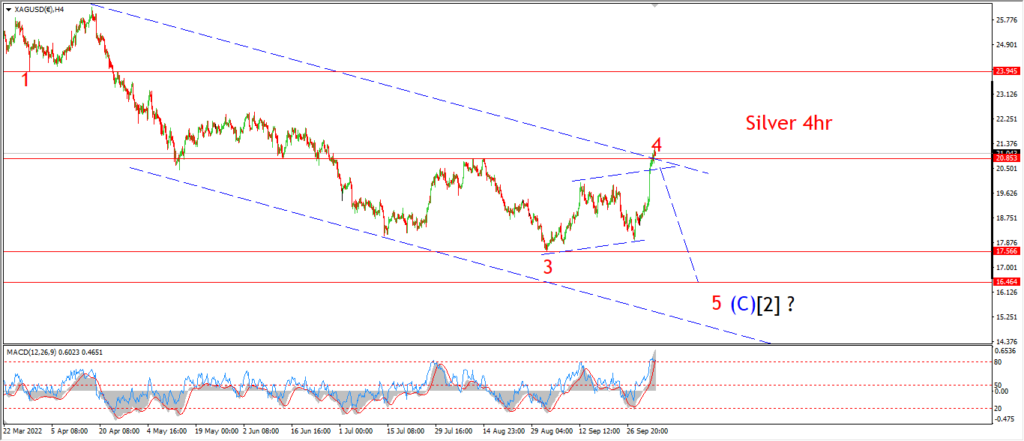
SILVER 4hr.
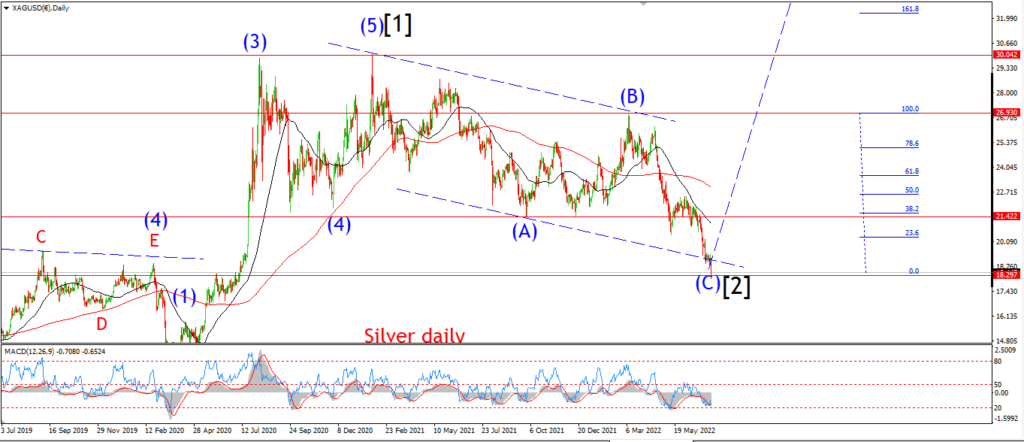
SILVER daily.
Silver is just along for the ride here as far as I can see.
I do not see the same bullish wave count that is developing in gold now.
The action over the last few weeks just fits this flat correction pattern too well to ignore it.
Momentum on the 4hr chart as topped out at a ten month high after that sharp covering rally we have seen this week.
And now I do think the reversal will come into wave ‘5’ as you might expect with a signal like that.
The hourly count has not changed this evening.
wave (iii) seems to be topping out now,
and we will be able to confirm wave (iv) is underway if we see a drop back into the 20.00 handle again.
This pattern has gone too far to fast this week.
And the reversal into wave ‘5’ down will wipe that out completely when it gets going next week most likely.
Tomorrow;
Watch for wave (iv) to begin and fall correctively in a three wave pattern towards the 20.00 area for the rest of the week.
BITCOIN
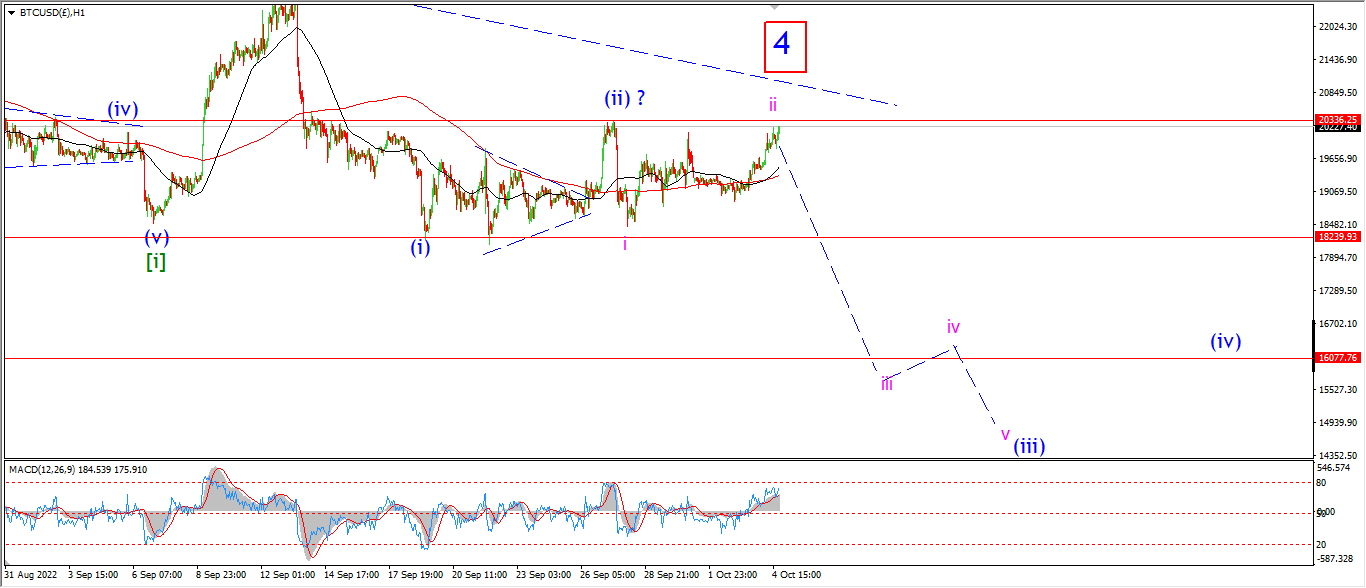
BITCOIN 1hr.
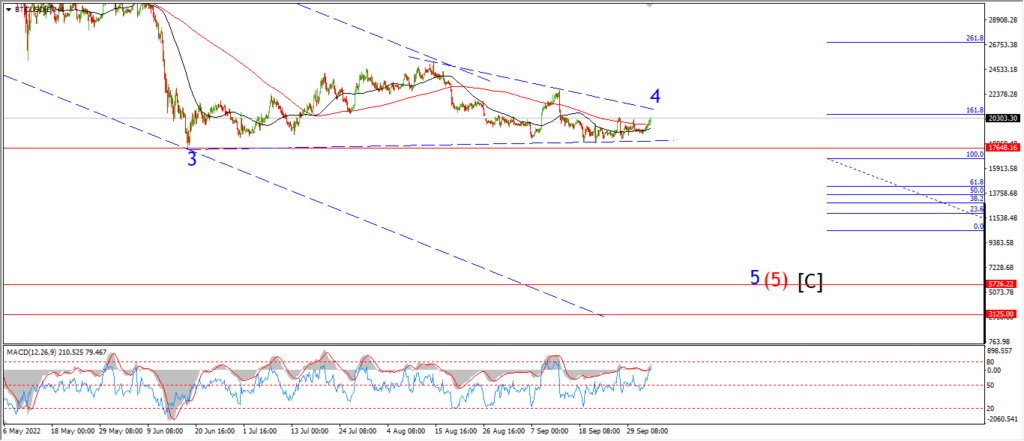
BITCOIN 4hr.

BITCOIN daily.
….
FTSE 100.
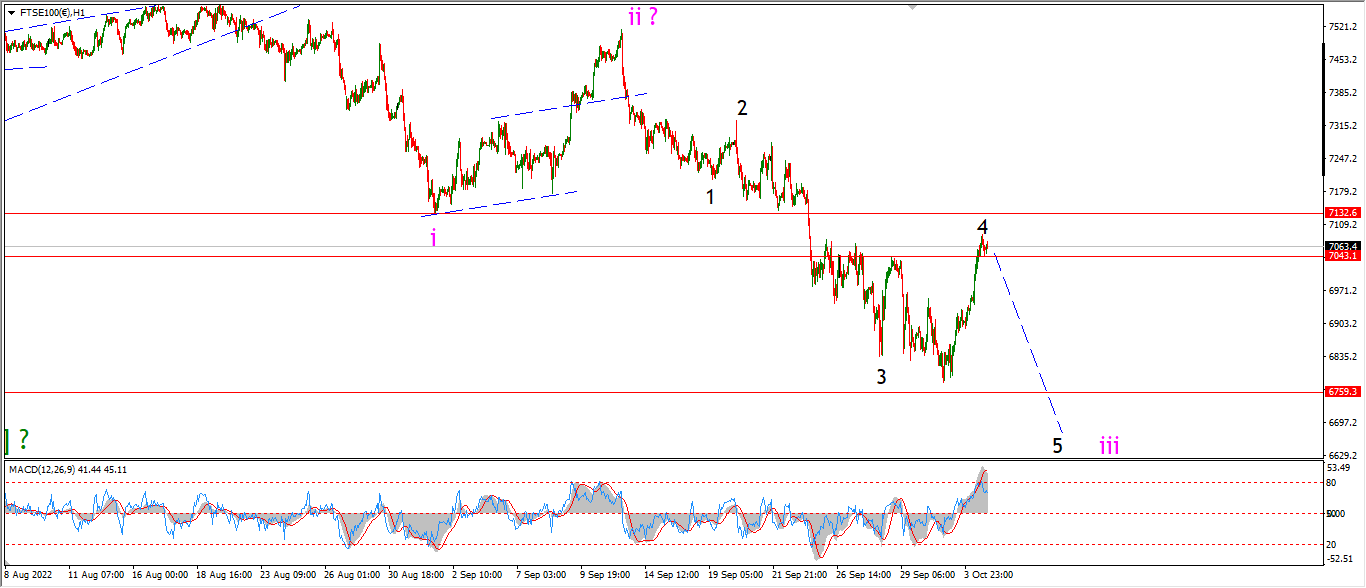
FTSE 100 1hr.
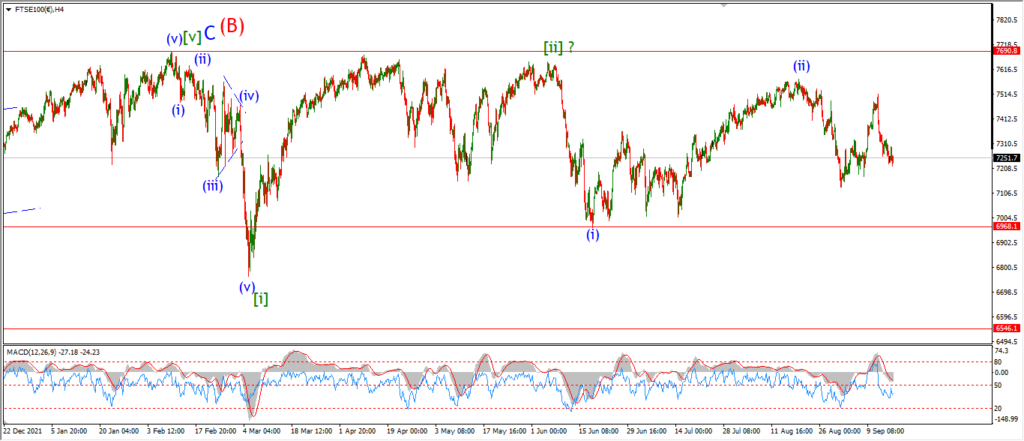
FTSE 100 4hr.

FTSE 100 daily.
….
DAX.
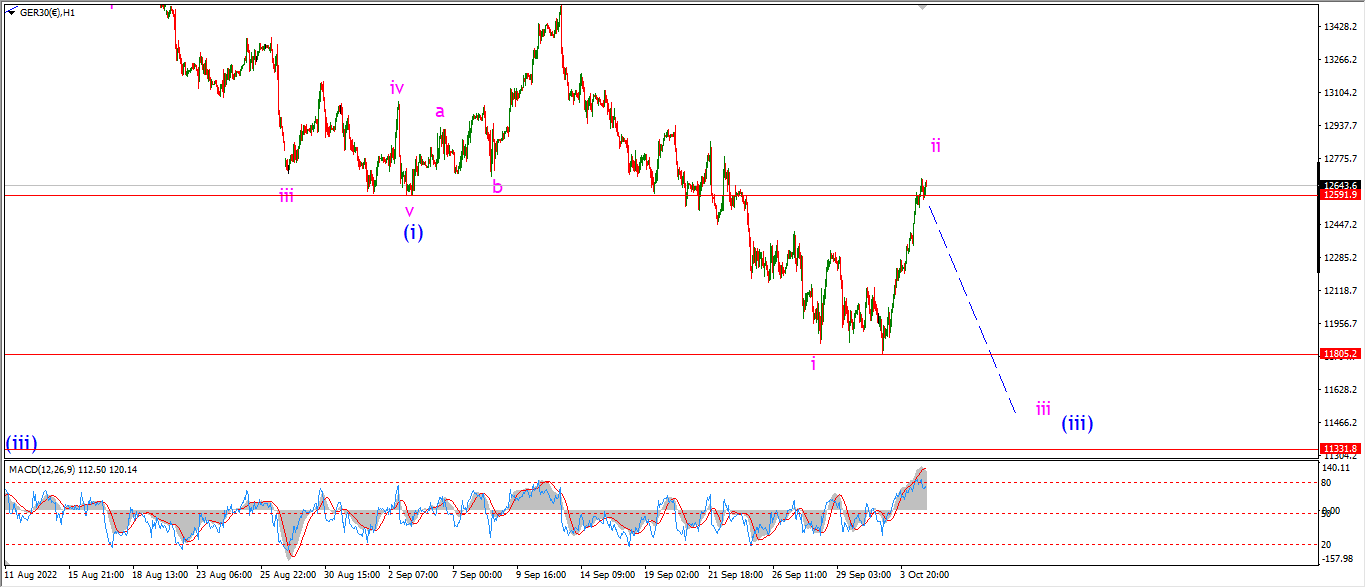
DAX 1hr
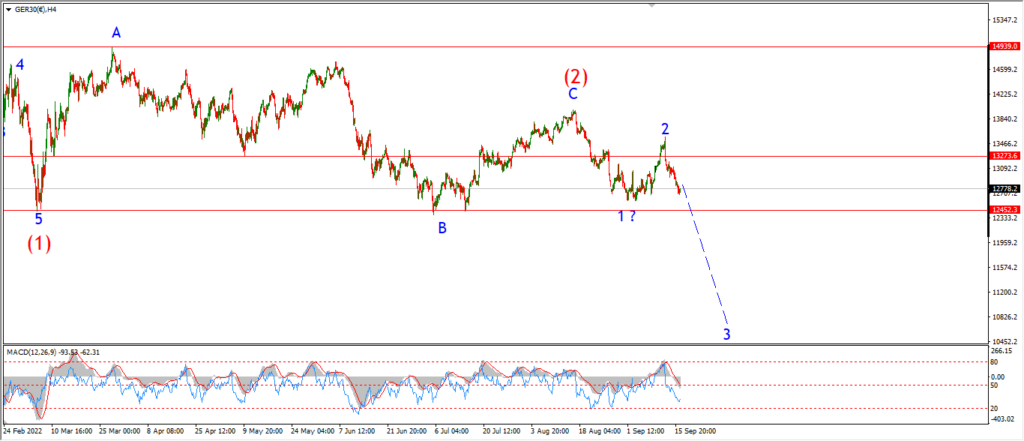
DAX 4hr

DAX daily.
….
NASDAQ 100.
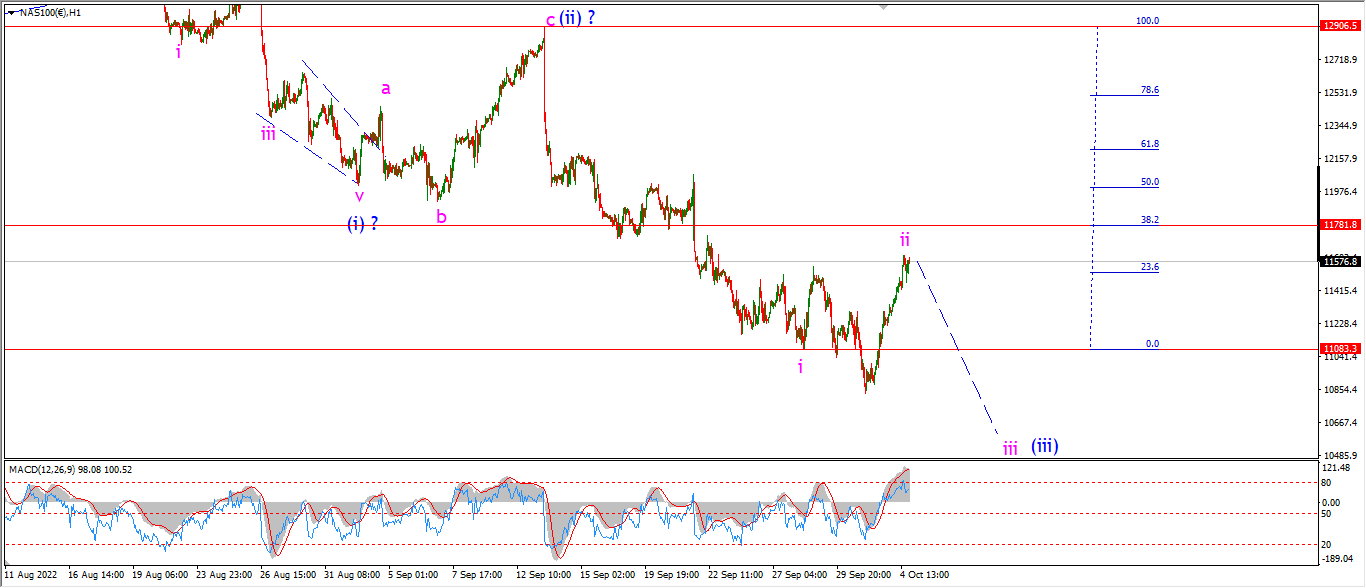
NASDAQ 1hr
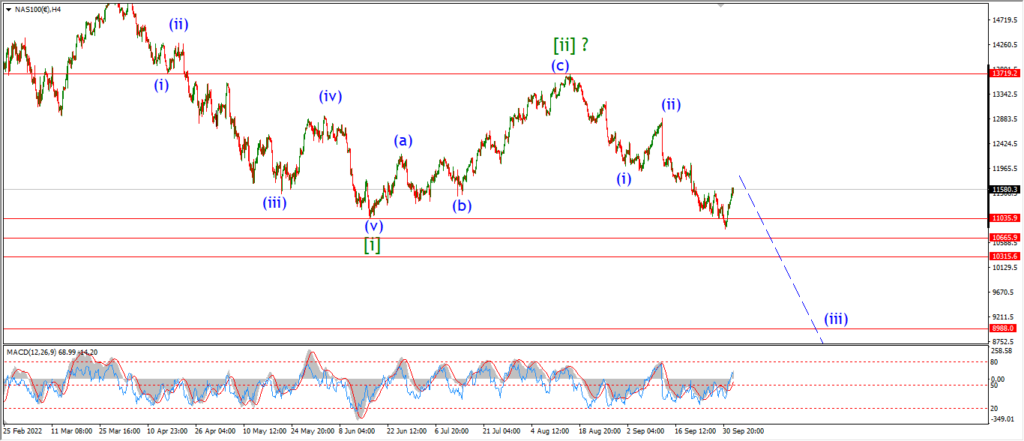
NASDAQ 4hr.
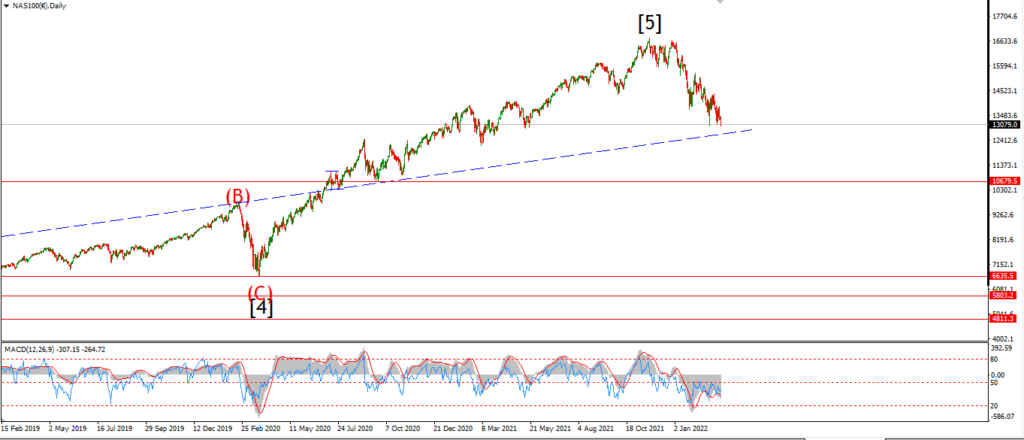
NASDAQ daily.
….