
Good evening to you folks.
God’s blessings to you all tonight.
Home Prices Crash At Fastest Pace Since Lehman Bankruptcy
EURUSD.
EURUSD 1hr.
EURUSD 4hr.

EURUSD daily.
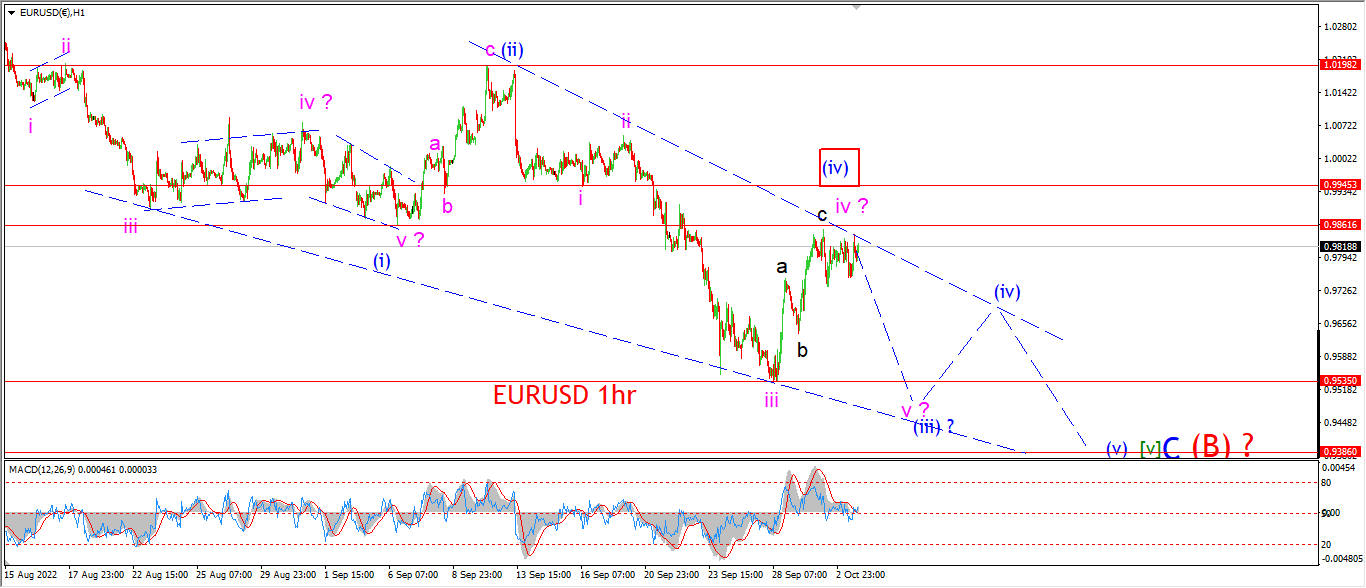
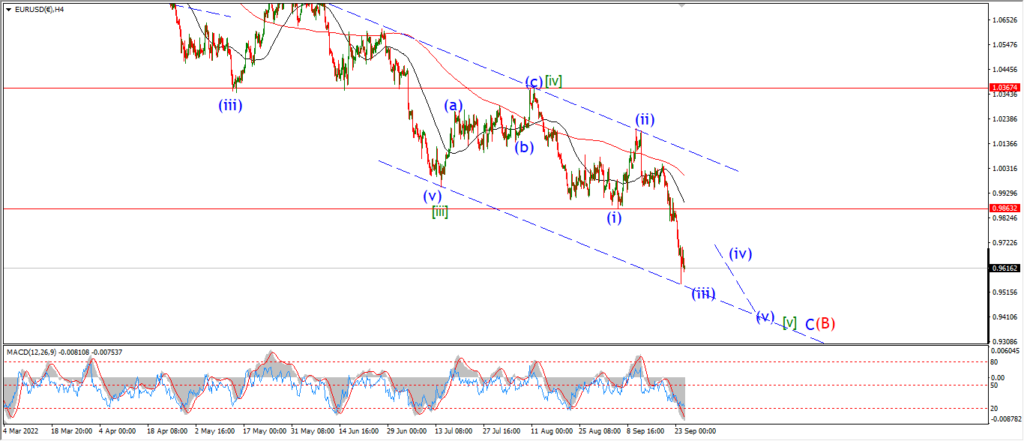
I am beginning to think that the final leg down in wave [v] that I am trying to track here has been tracing out an ending diagonal pattern without me catching it.
Take a look at the 4hr chart and see this possibility unfolding.
If this is the case,
then we may even have the final low now in place pretty soon in wave (v) of [v].
We will see haw this develops this week.
A break of 0.9861 and then a three wave decline again will favor that count for wave [v].
Tomorrow;
As for the main count.
We have not seen anything to rule this count out completely yet.
the price is holding below the initial resistance at 0.9861.
So I will allow another few sessions to see which way this pattern falls in the short term.
Watch for wave ‘v’ of (iii) to fall again and break 0.9535.
GBPUSD
GBPUSD 1hr.
GBPUSD 4hr.

GBPUSD daily.
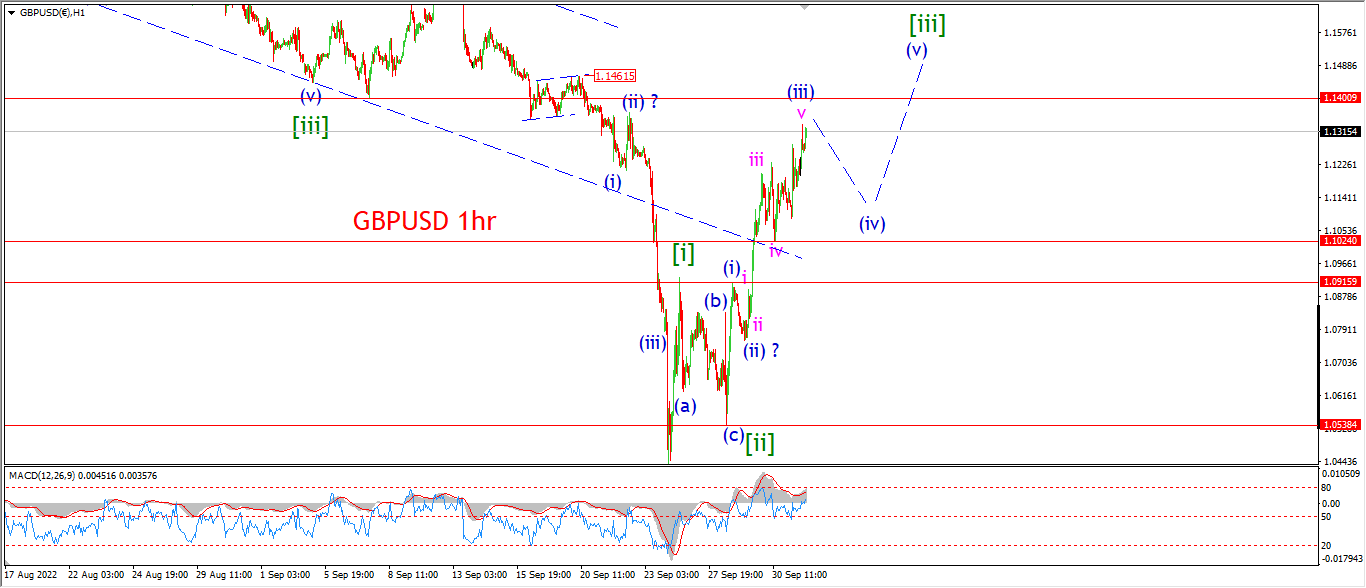
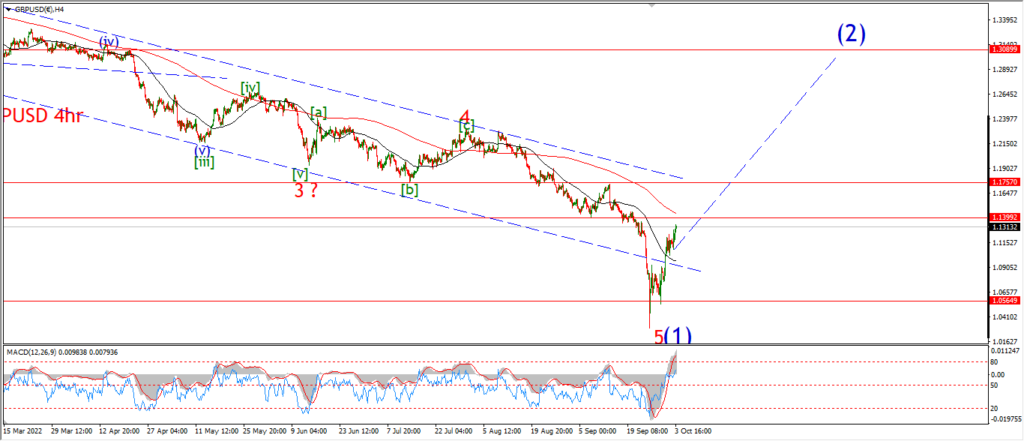
The top for wave (iii) was suggested in the area of 1.1400,
and todays top came close enough to that target to look for a turn into wave (iv) to begin.
The action in cable today is quite overlapping and with that there is a possibility of a top now in place for wave (iii).
In this case wave ‘v’ of (iii) has traced out an ending diagonal.
and now wave (iv) should fall back in a corrective pattern to the previous wave ‘iv’ range at 1.1100 over the next few days.
Wave (iv) must not break the wave (i) high at 1.00915 for this count to remain valid.
Tomorrow;
Watch for wave (iii) to top out early tomorrow and then a drop back below 1.1200 again will signal wave (iv) is underway.
USDJPY.
USDJPY 1hr.
USDJPY 4hr.

USDJPY daily.
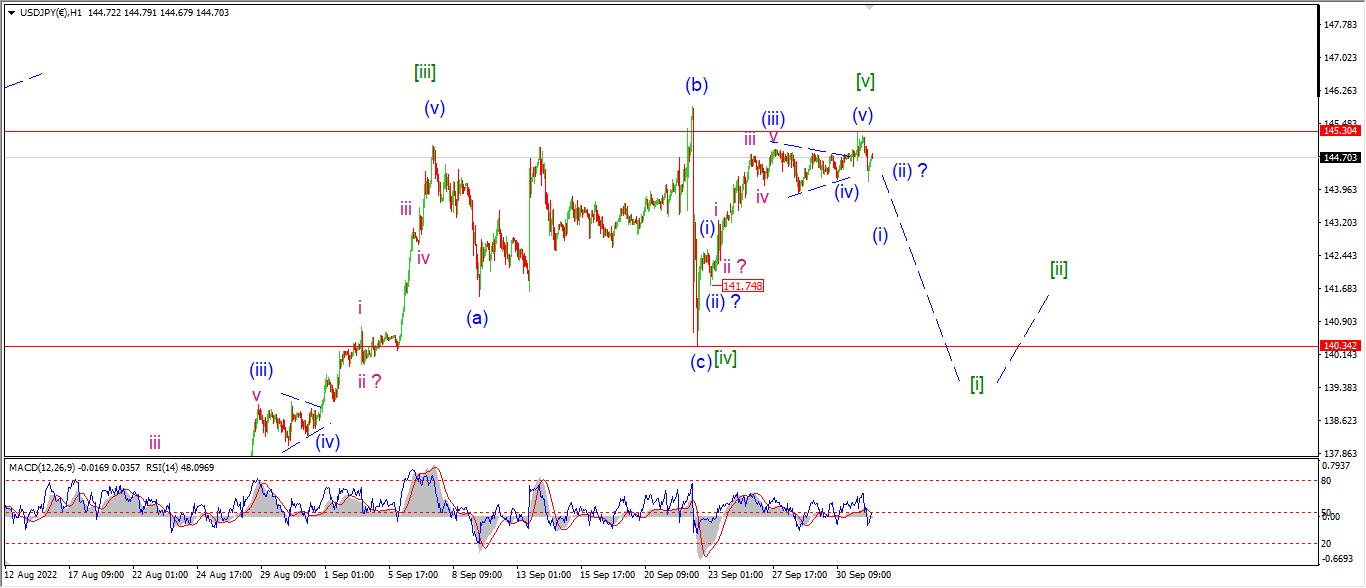
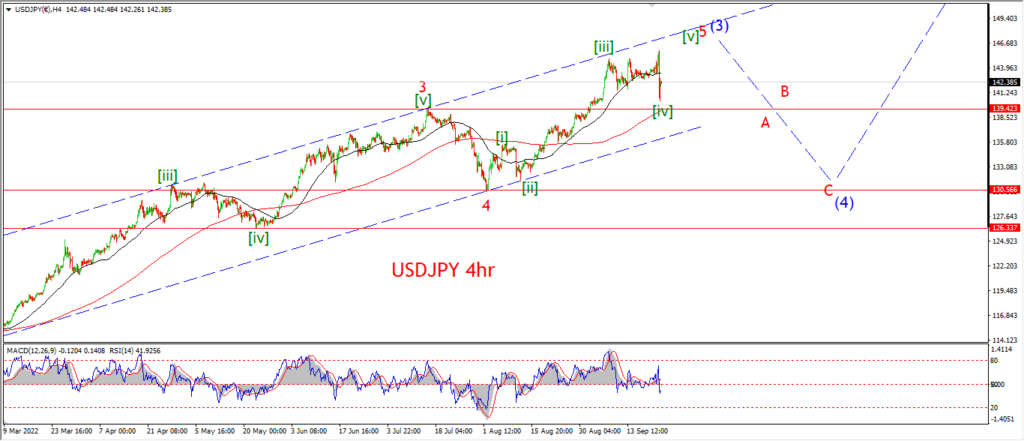
I am looking at the possibility that USDJPY is actually now topping out tonight.
The pattern in wave [v] did actually reach a slight new high early today,
and now we see a rejection and fall back into the corrective range again.
The pattern is valid for wave [v],
because we have a new high above the wave [iii] top in place.
and it is not actually necessary that wave [v] actually break that wave (b) top.
This is not very common for sure,
but it is an acceptable anomaly we can say!
Tomorrow;
So,
where to from here?
Well if the top is now forming we need to see a five wave decline to actually confirm that idea.
The obvious first target is at 140.34 at the wave [iv] low.
Lets see if the price can drop impulsively from here and break that wave [iv] low by the end of the week.
Watch for a corrective lower high in wave (i) and (ii) to form by Midweek.
DOW JONES.
DOW 1hr.
DOW 4hr
DOW daily.
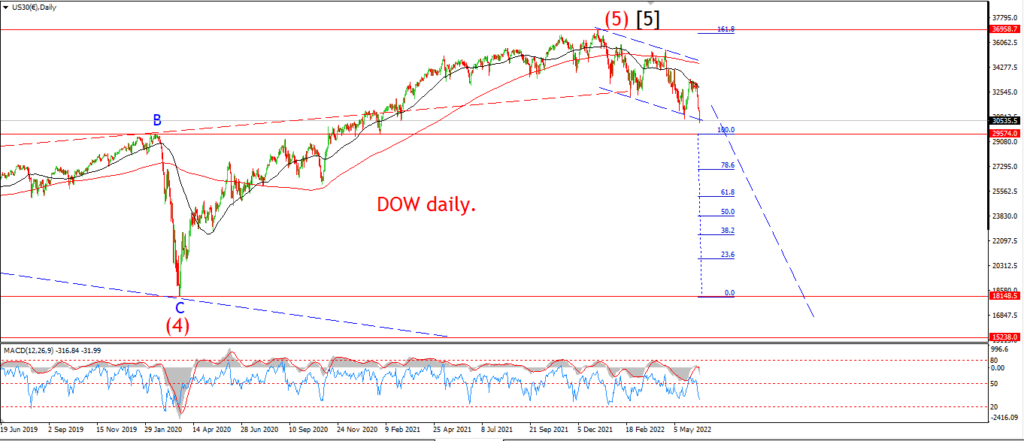
Its a comeback Monday today,
and now I suppose the world and its mother will all turn bullish.
and you can expect the headlines to appear on cnbc asking – ‘is the low now in for stocks’………
You know my answer already.
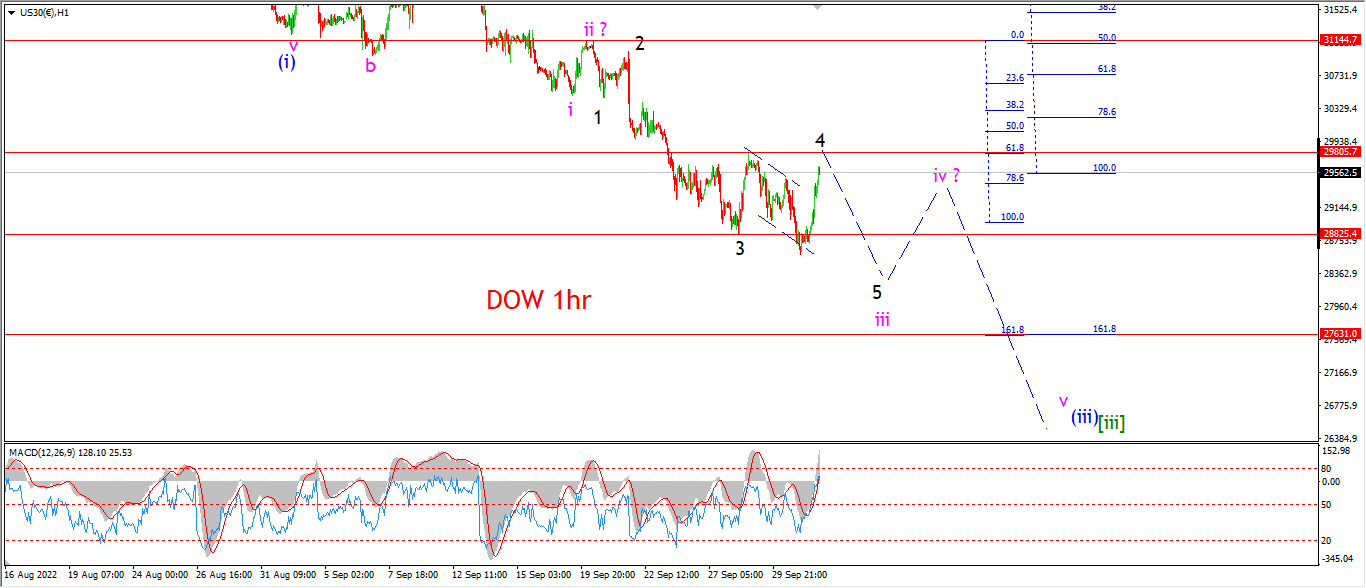
I am looking at the short term count a little different tonight though.
And this involves a possible expanded flat correction in wave ‘4’ of ‘iii’.
The main reason for the new count is that clear three wave decline into Fridays lows hinting at the corrective nature of the action.
The correction in wave ‘4’ should finish with a pop above 29800 at the previous high.
And then a sharp decline should begin into wave ‘5’ of ‘iii’ by midweek.
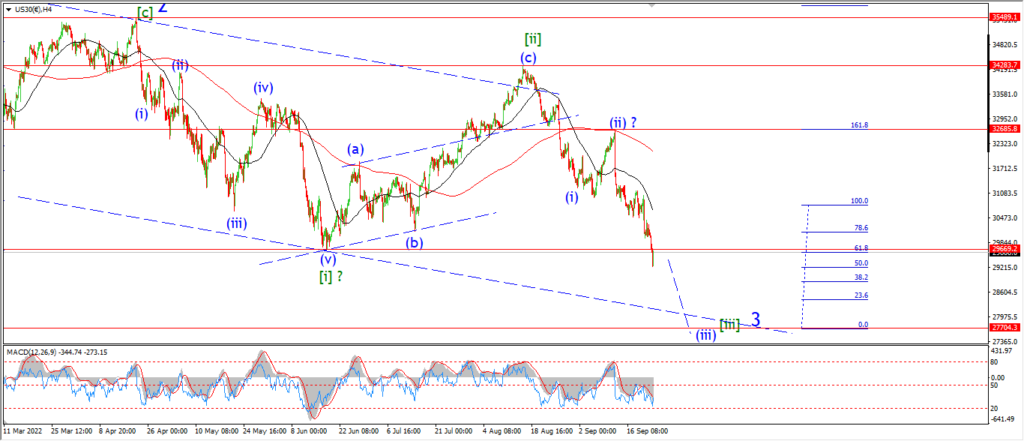
If the current count is correct here,
then we are looking at a choppy week ahead as the market declines to complete wave ‘iii’,
and then rallies into a correction in wave ‘iv’.
There is a reasonable chance that we will see a flat trade this week overall if this pattern works out for wave ‘iii’ and ‘iv’.
Tomorrow;
Watch for wave ‘4’ to complete early tomorrow with a break of 29800.
Then a drop back to a new low in wave ‘5’ should begin by tomorrow evening.
GOLD
GOLD 1hr.
GOLD 4hr.
GOLD daily.
I hate it when gold rallies along with the stock market,
it really stinks of ‘buy everything’ relief bounce to be honest.
The bounce usually passes,
and gold will get hammered again along with the rest of the risk asset complex.
That’s my pessimistic outlook in a nutshell for you!
As for the count.
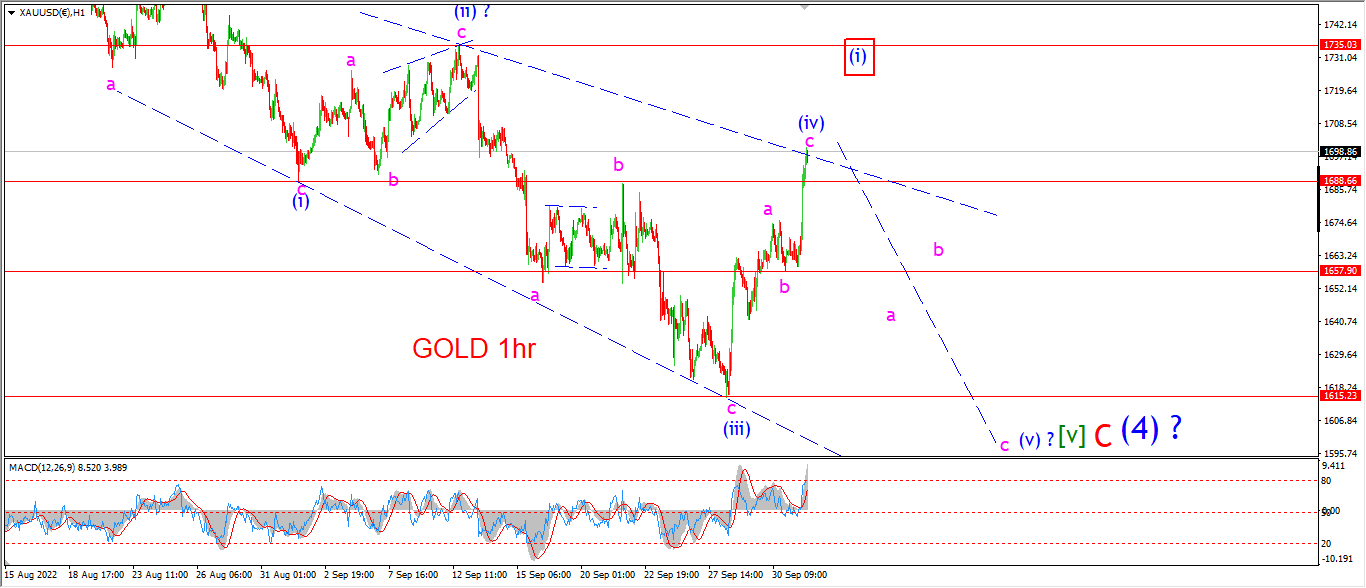
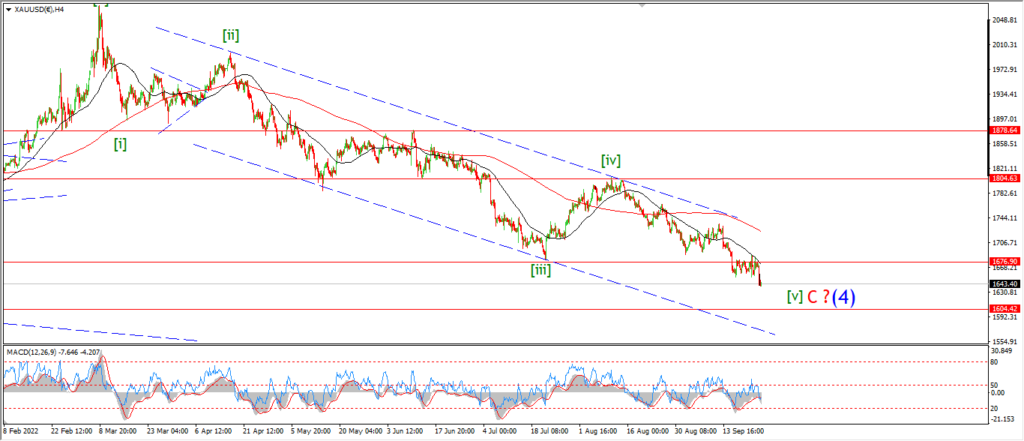
The rally over the last few days can still be viewed as a correction higher in wave (iv) of [v].
once complete,
wave (v) should again fall in three waves as shown.
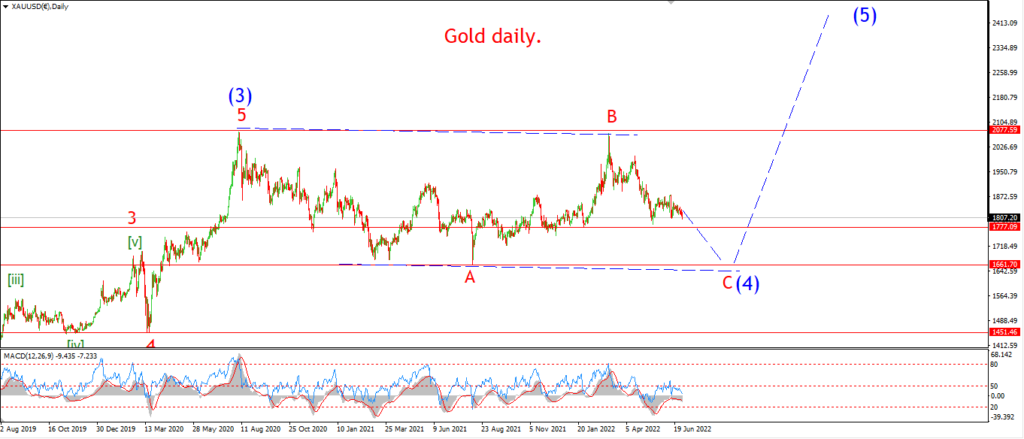
and then a new low will be reached for this whole corrective saga in wave ‘C’ of (4) below 1600 it seems.
Now I do believe we are close to the end of this correction for sure.
But as far as the short term pattern is concerned,
we need one more low to complete wave [v].
Tomorrow;
Lets see of a top will form in wave (iv) of [v].
A drop back below 1657 again will signal wave (v) of [v] is underway.
CRUDE OIL.
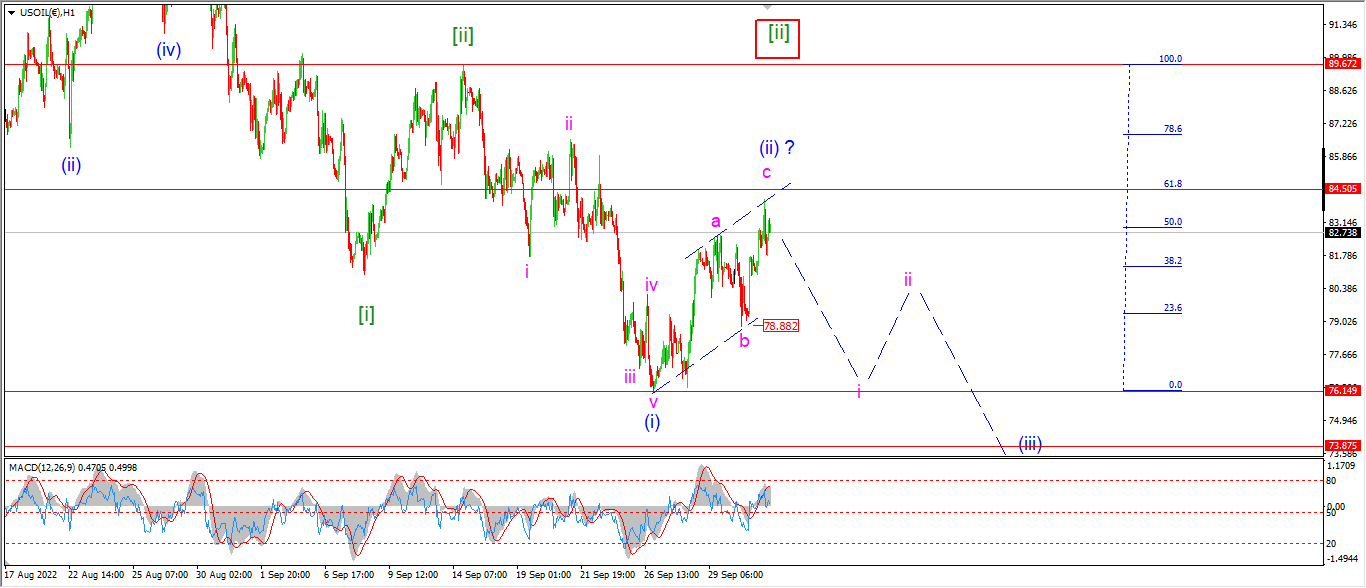
CRUDE OIL 1hr.
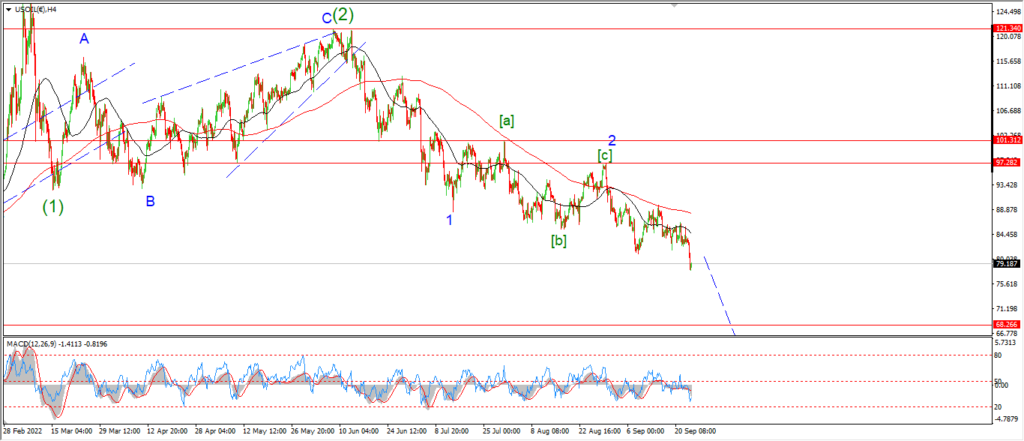
CRUDE OIL 4hr.
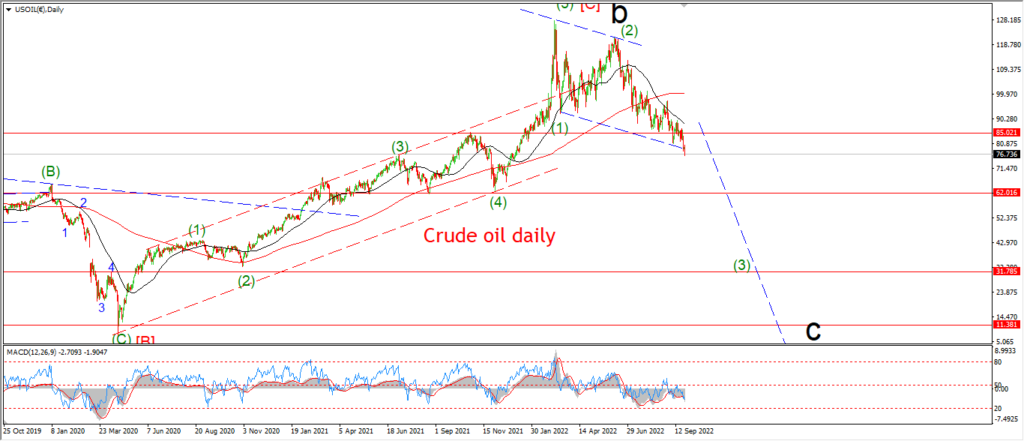
CRUDE OIL daily.
After another bounce today,
the correction in wave (ii) has now managed to reach towards the 62% retracement level of wave (i).
The price has so far failed below that level at 84.50.
But there is no clear decline in place either to show that wave ‘i’ of (iii) is underway yet.
My best guess is that wave (iii) is coming this week.
But I will wait for an impulsive decline again in wave ‘i’ of (iii) before getting too excited.
Tomorrow;
We still have a three wave pattern higher in place for wave (ii) here,
so the short term risk is still all to the downside I suspect.
Watch for wave ‘i’ of (iii) to fall back below the 78.88 low at wave ‘b’ again to signal the price is turning down into wave (iii).
S&P 500.
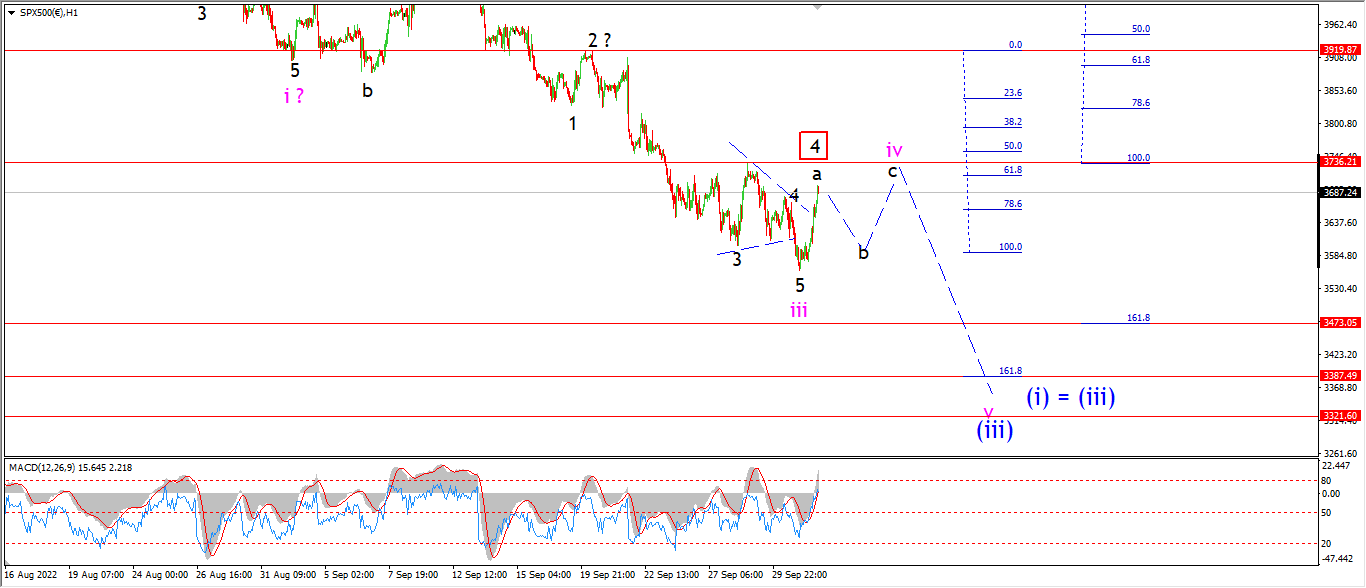
S&P 500 1hr
S&P 500 4hr
S&P 500 daily.
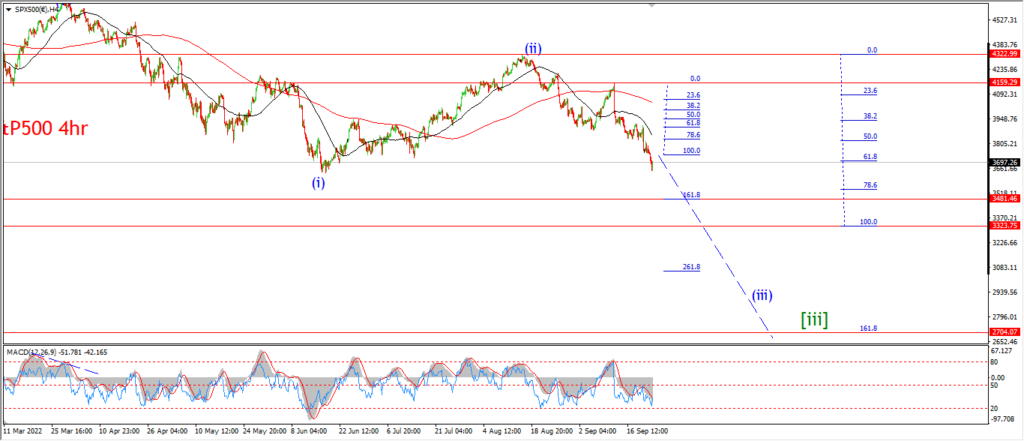
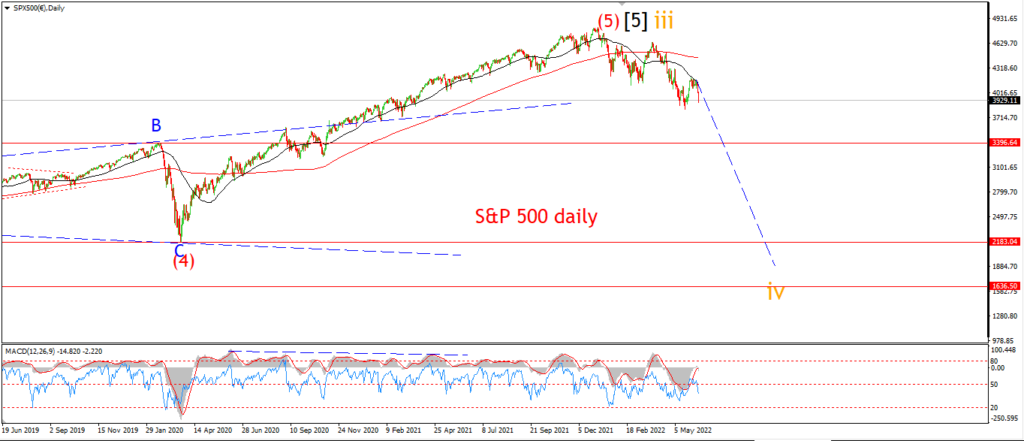
The count for the S&P is in a similar leveling off period now.
I am taking a slightly different view on things here than the Dow.
The recent low is viewed as wave ‘iii’ now complete,
and this rally is wave ‘iv’ now underway.
The correction in wave ‘iv’ should be a sideways ranging pattern if I am correct.
But I will just have to wait and see how it develops.
This correction should yield to a further decline into wave ‘v’ of (iii) by the end of the week.
And wave ‘v’ is expected to hit the 3320 level to complete,
this is where wave (iii) reaches 162% of wave (i).
The alternate count is is in line with the wave count in the Dow.
And in that case,
we can expect the rally to end sooner with a decline in wave ‘5’ of ‘iii’ near 3400 again.
Tomorrow;
Watch for wave ‘iv’ to continue sideways overall for the first half of this week.
Wave ‘b’ of ‘iv’ should fall back to 3600,
followed by a rally in wave ‘c’ towards 3730 again.
SILVER.
SILVER 1hr
SILVER 4hr.
SILVER daily.
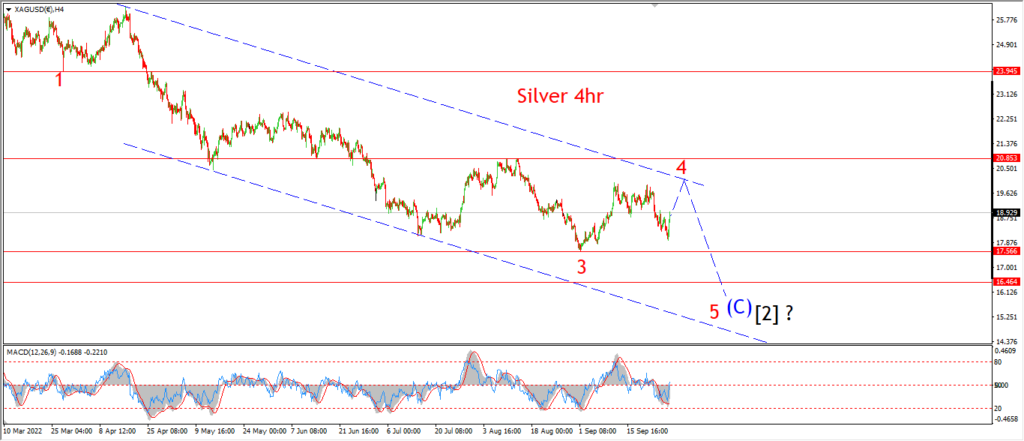
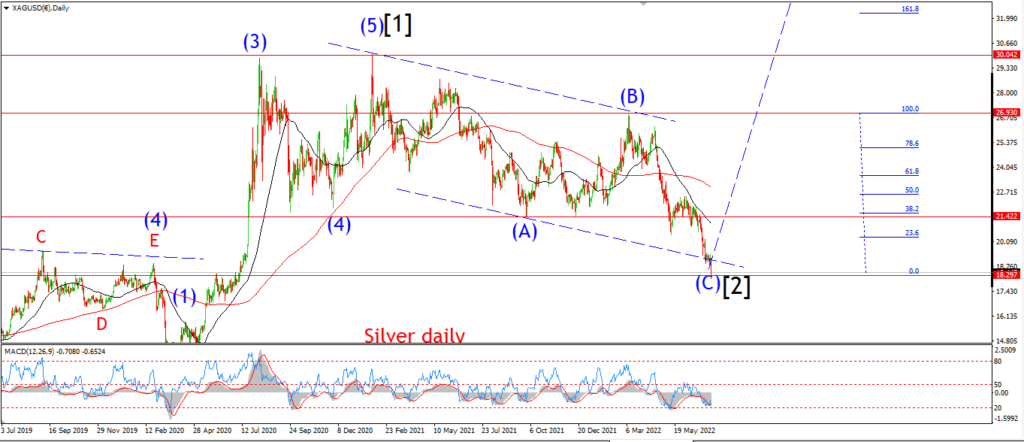
Silver broke out of the main wave count today and confirmed the alternate pattern for wave ‘4’ red.
This is best viewed on the 4hr chart.
And todays rally is viewed as wave [c] of ‘4’.
The price has already hit the upper trend channel line of wave ‘4’ after todays rally.
but the internal pattern of wave [c] has a little more to go before completing its pattern.
In general,
I still expect wave ‘5’ to fall again to a new low below 17.00 to complete the much larger correction in wave (C) of [2].
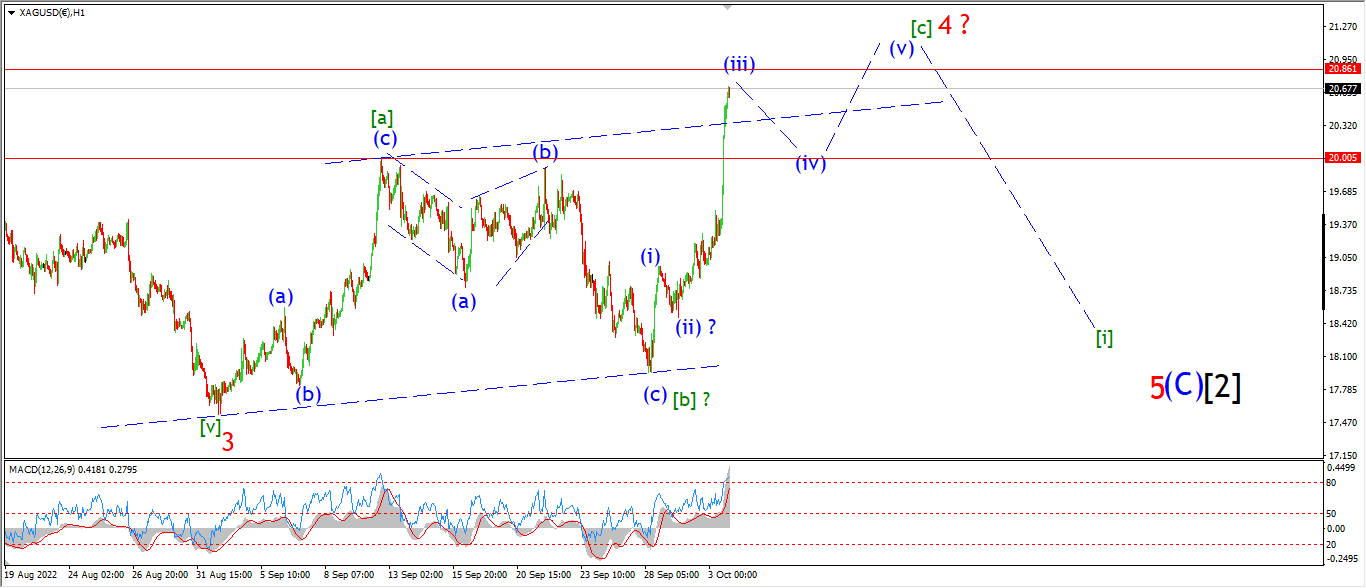
The hourly chart shows the pattern in wave ‘4’ a little clearer.
Todays rally is wave (iii) of [c].
With wave (iv) and (v) left to complete wave [c] and ‘4’.
Tomorrow;
Watch for wave (iv) to fall again in three waves back towards the 20.00 level at the wave [a] high.
Wave (iv) should take at least until Wednesday evening to complete.
BITCOIN
BITCOIN 1hr.
BITCOIN 4hr.

BITCOIN daily.
….
FTSE 100.
FTSE 100 1hr.
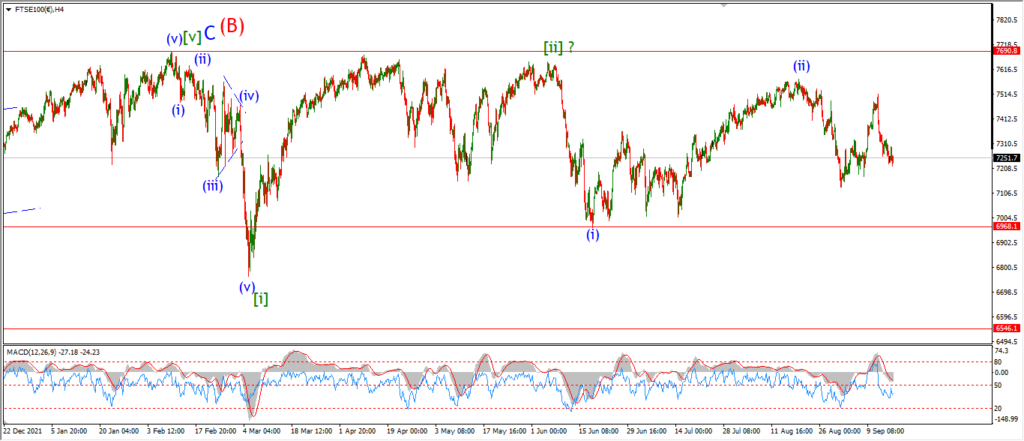
FTSE 100 4hr.

FTSE 100 daily.
….
DAX.
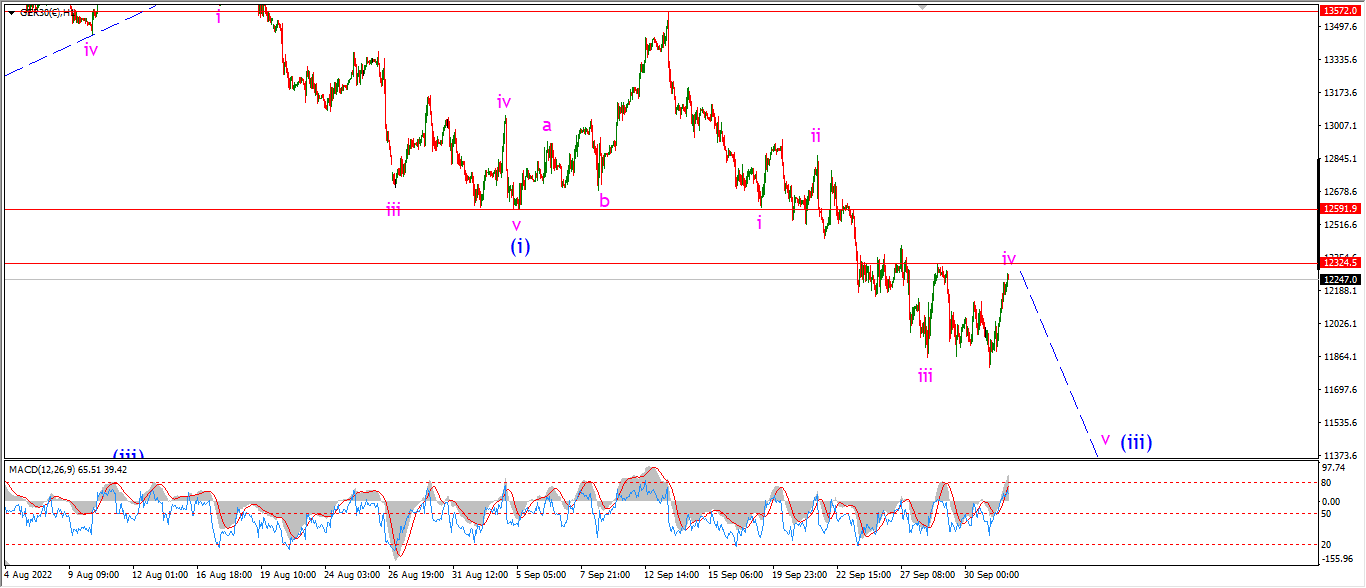
DAX 1hr
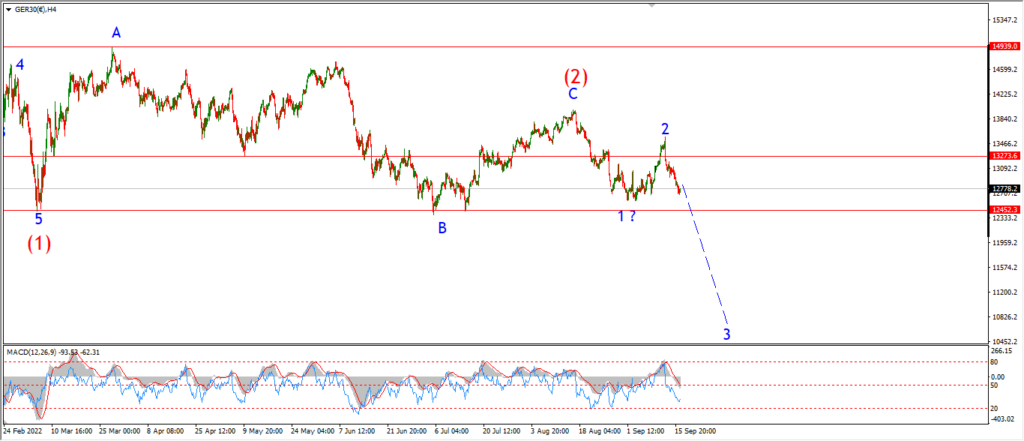
DAX 4hr

DAX daily.
….
NASDAQ 100.
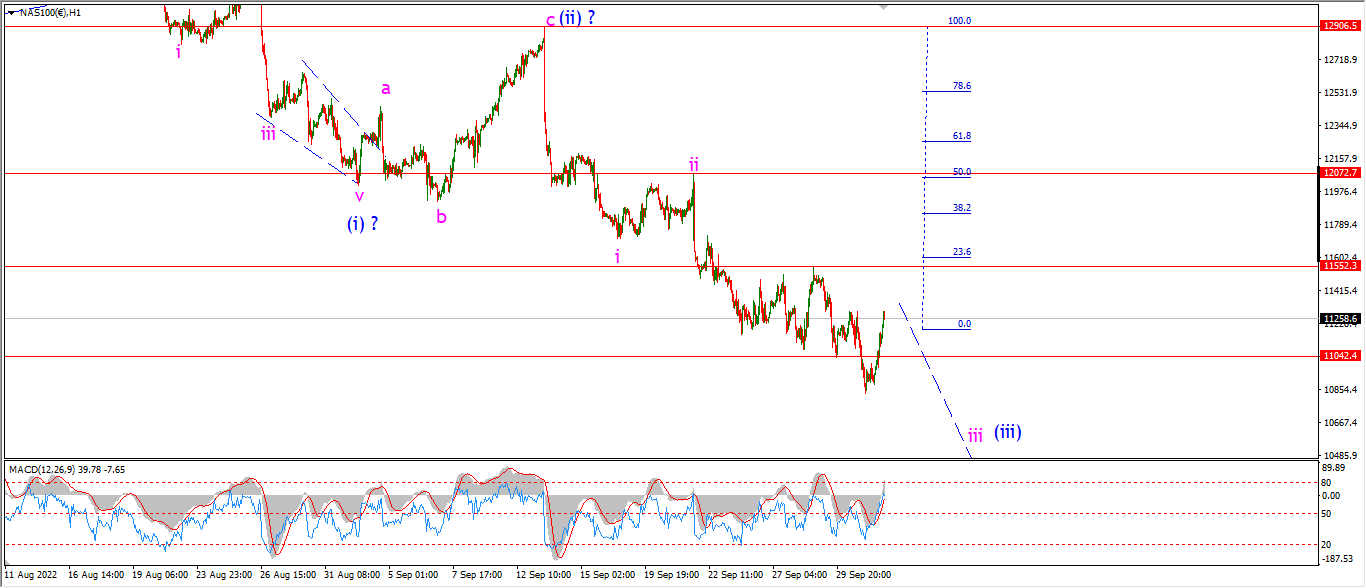
NASDAQ 1hr
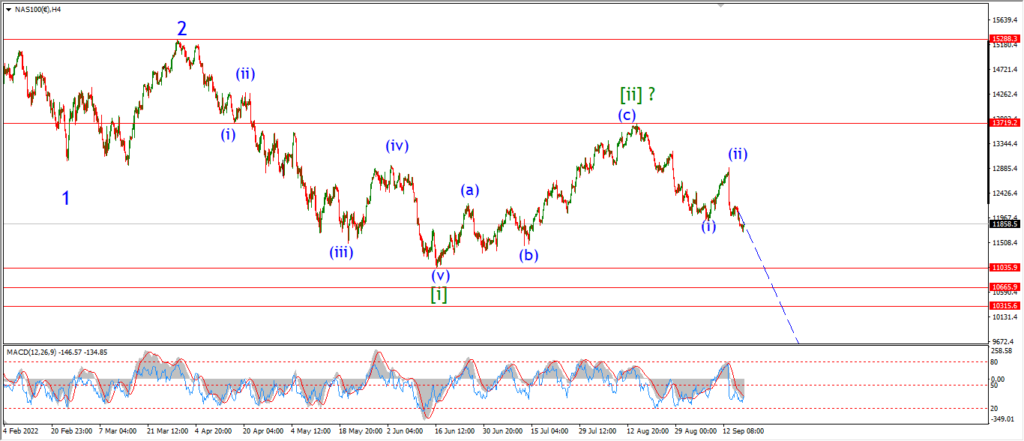
NASDAQ 4hr.
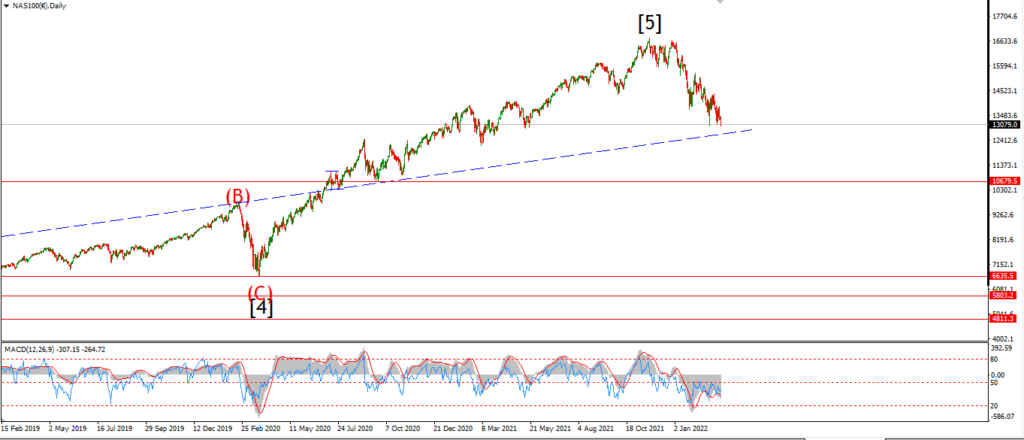
NASDAQ daily.
….