
Good evening lads and ladies,
I pray the Blessings of Messiah Yeshua over you all tonight.
I recorded this chart update this afternoon just to run through the possibilities for the week ahead.
I didn’t get to do the video that I wanted to,
but that’s life!
I will be back later in the week to go a bit deeper in a members only video.
Ok,
down to the charts.
EURUSD.
EURUSD 1hr.
EURUSD 4hr.
EURUSD daily.
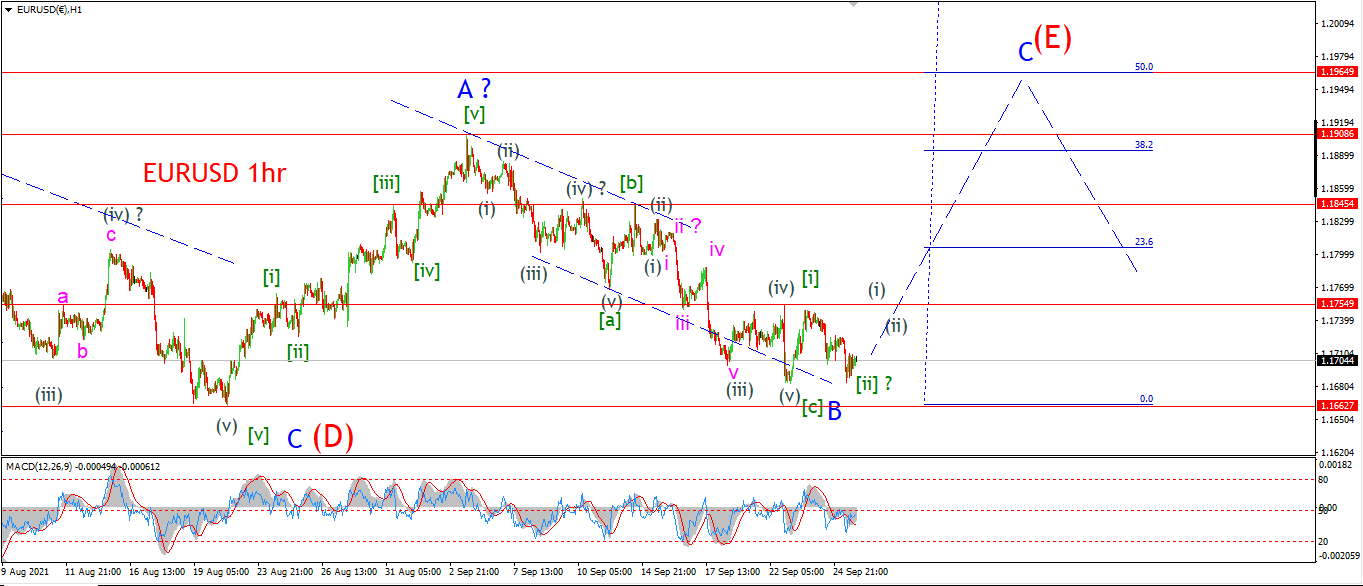
The low of wave ‘B’ is ever so close to breaking today.
{The impulsive pattern off the low labelled as wave [i] and [ii] may not hold tomorrow,
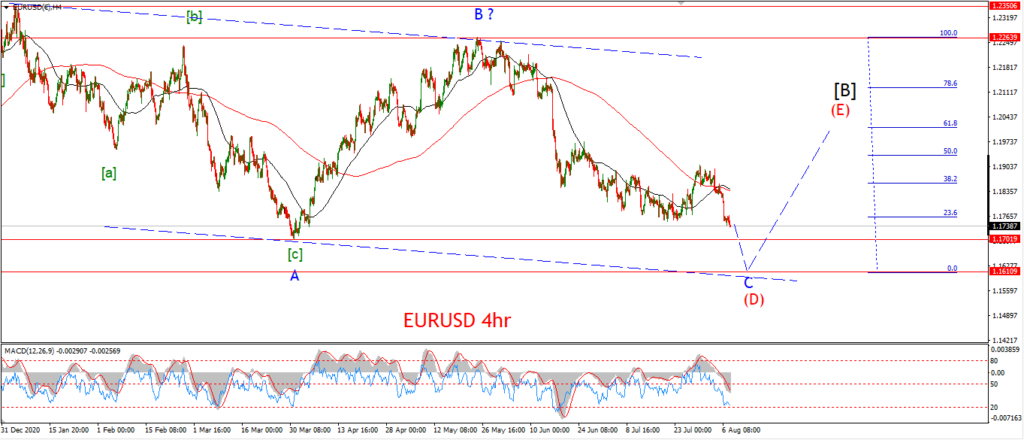
but I do think we will see a rally coming this week given the turn higher in momentum on the 4hr chart.
It is too close to call now for wave ‘B’,
but as long as the price holds above 1.1662 at wave (D),
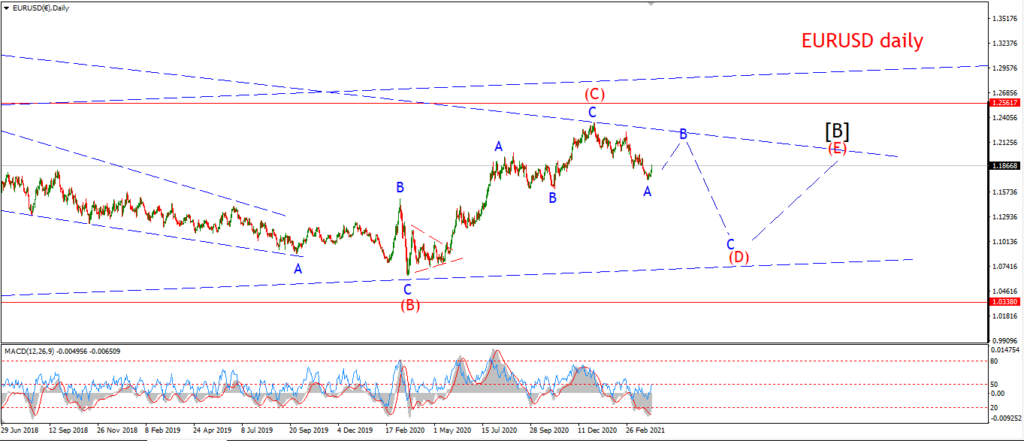
then I think we will see a rally in wave ‘C’ of (E) over the days.
Tomorrow;
Watch for wave ‘B’ to hold above 1.1662.
Wave ‘C’ simply must begin tomorrow and pull away from that invalidation line again.
GBPUSD
GBPUSD 1hr.
GBPUSD 4hr.
GBPUSD daily.
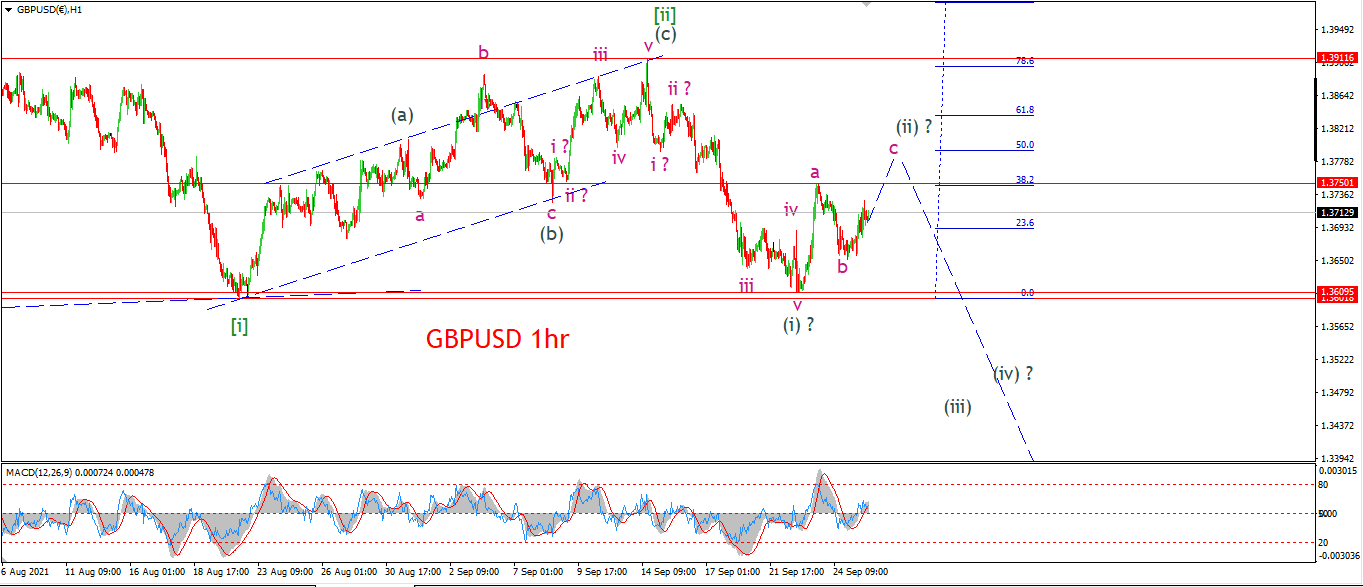
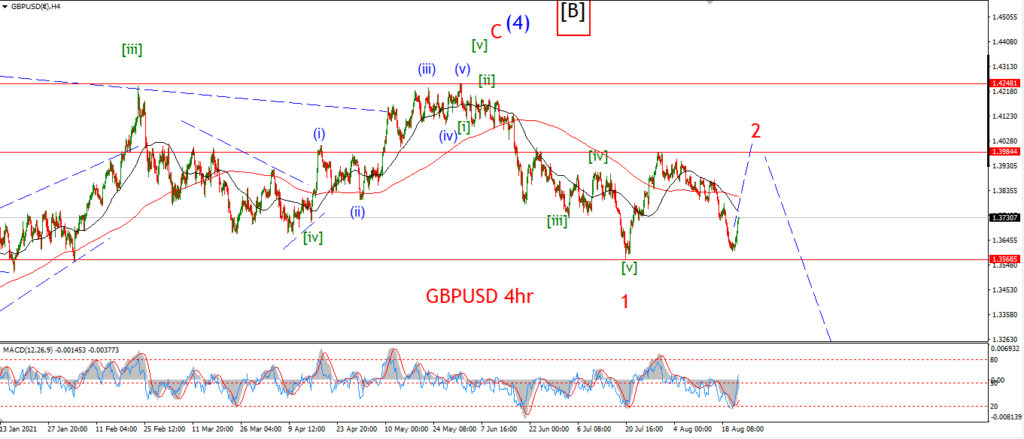
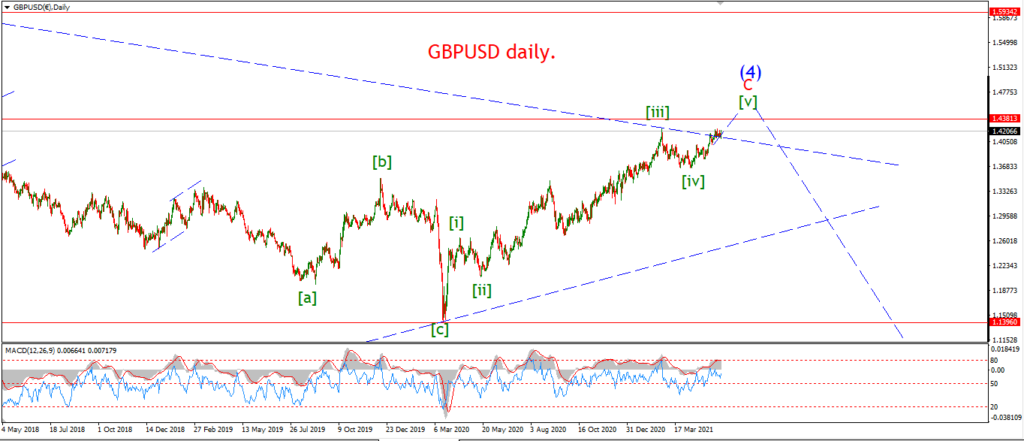
Wave (ii) is making steady progress today as wave ‘c’ climbs higher again.
The minimum target for wave ‘c’ lies at 1.3750 which marks the wave ‘a’ high.
So wave (ii) will complete with a break of that level at least.
Once we have a three wave pattern higher in place.
Then I will look for a reversal lower to begin wave (iii) this week.
Tomorrow;
Watch for wave ‘c’ to break 1.3750 at a minimum.
USDJPY.
USDJPY 1hr.
USDJPY 4hr.
USDJPY daily.
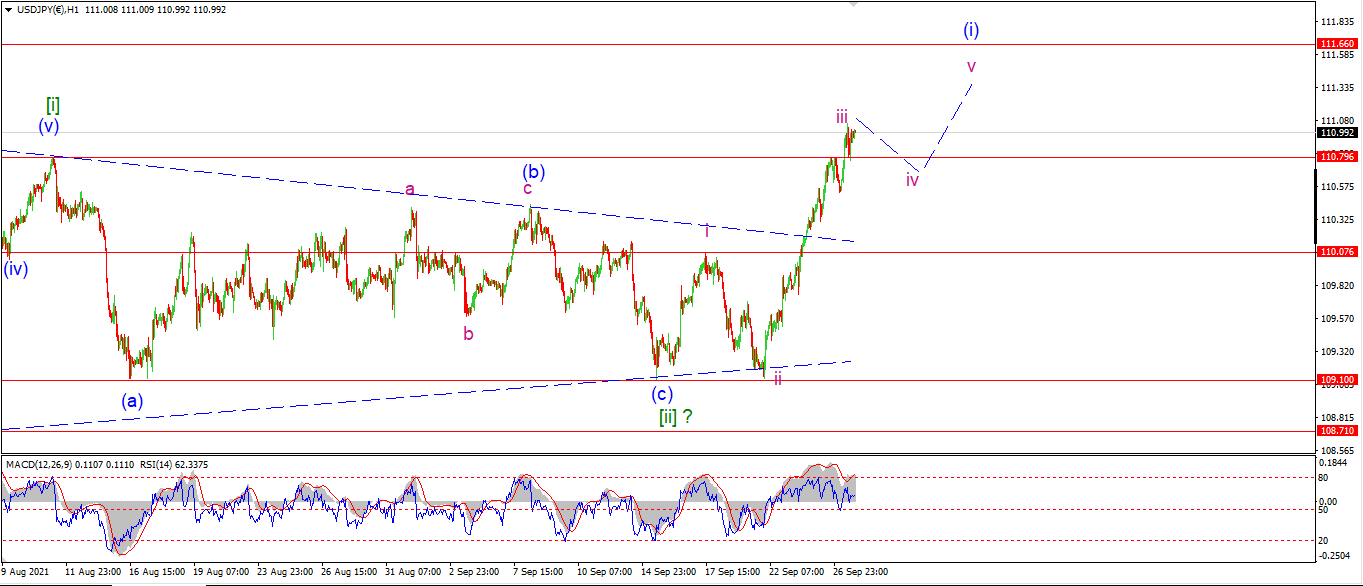
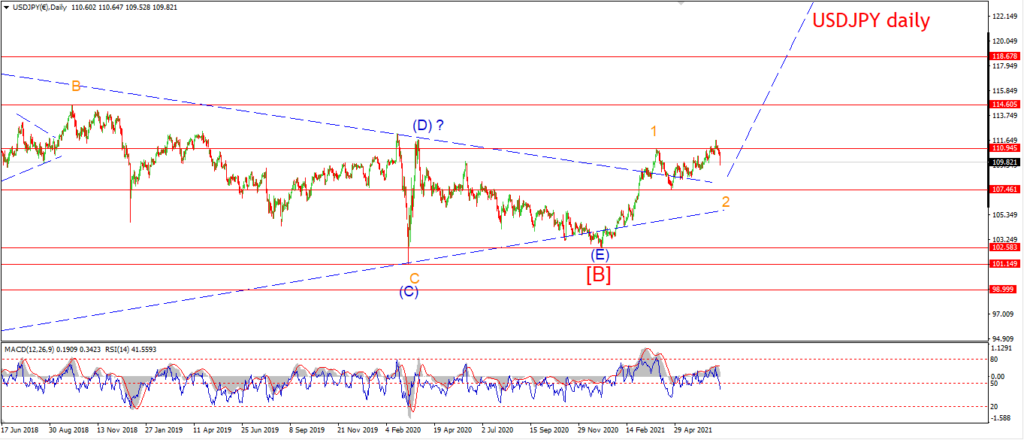
USDJPY is holding the gains made late last week as wave ‘iii’ closes out today.
We should see a consolidation in wave ‘iv’ begin possibly tomorrow,
and that correction in wave ‘iv’ should hold above 110.08 at the wave ‘i’ high.
Wave (i) up should complete a five wave rally this week.
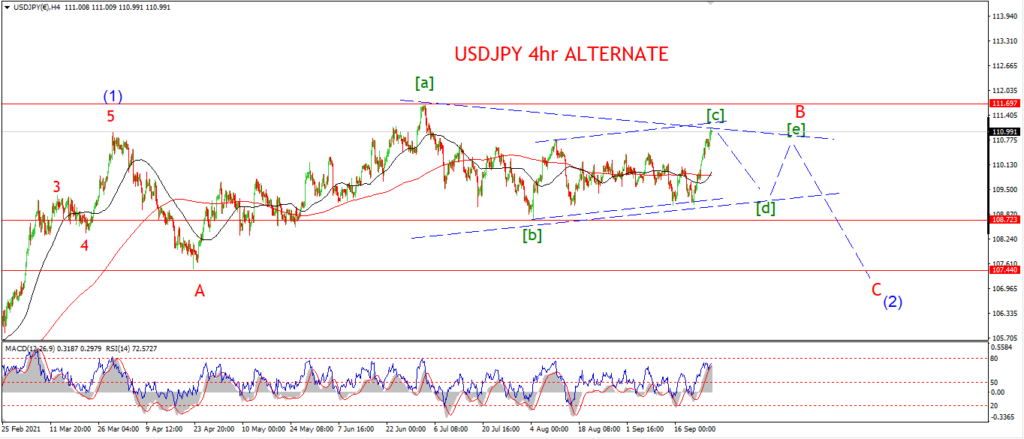
As for the alternate count.
on the 4hr chart you can see a possible triangle still intact as wave ‘B’ of (2).
This current top can be viewed as wave [c] of ‘B’.
If the sideways action continues over the coming few sessions then I will be tempted to switch to this alternate count.
DOW JONES.
DOW 1hr.
DOW 4hr
DOW daily.
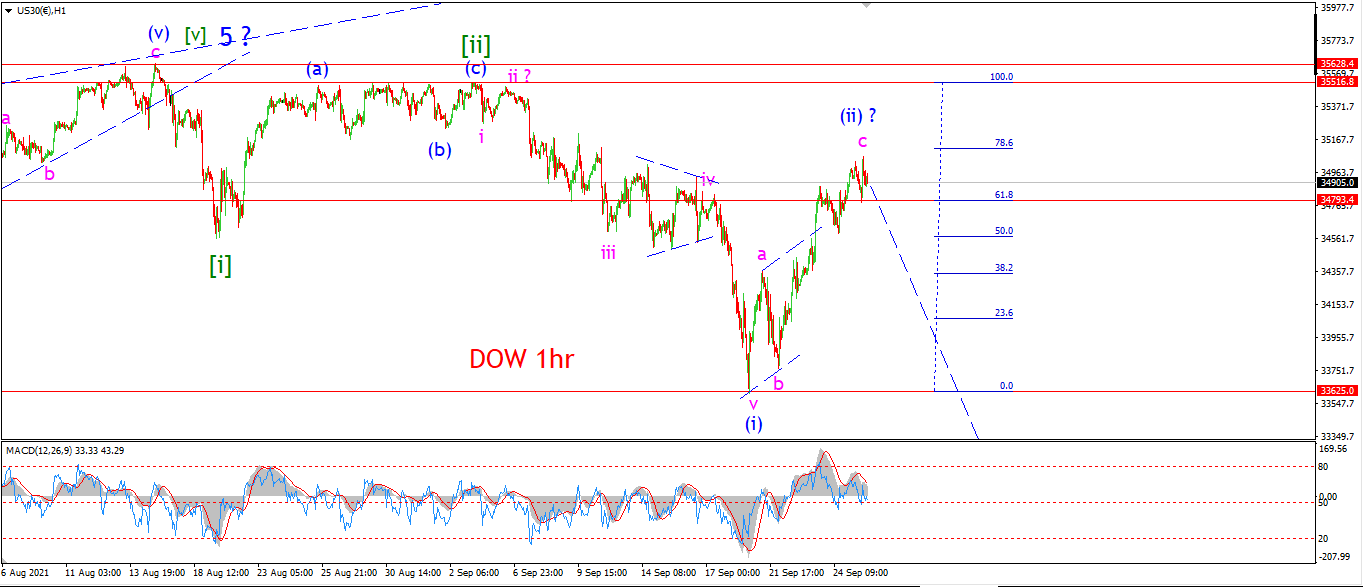
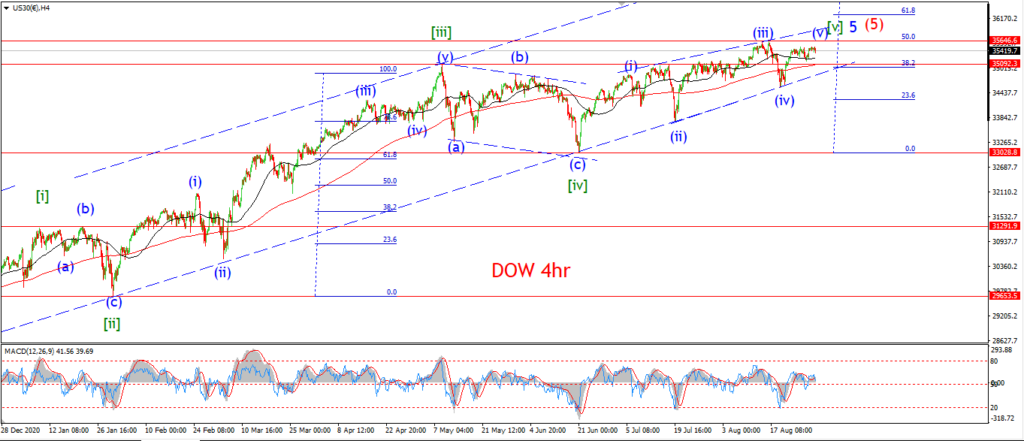
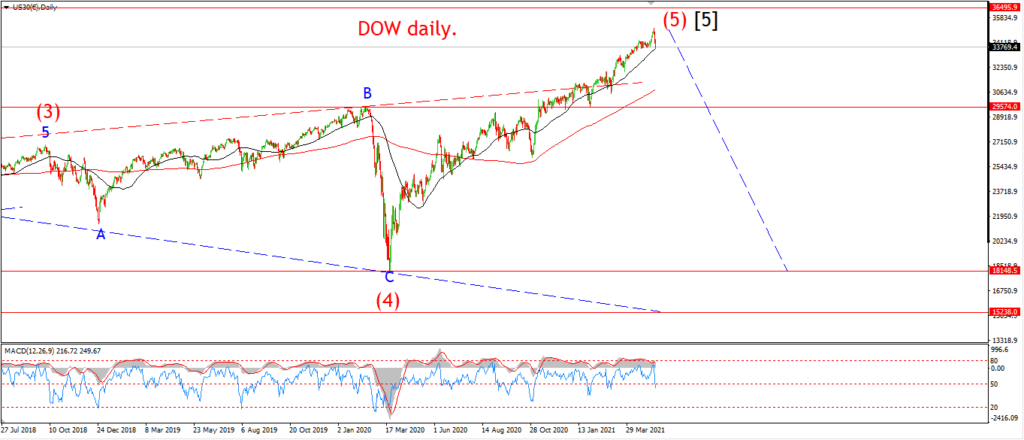
The pattern has not changed today as the market seems to have found at least a temporary high now at the 3500 area.
IF we see an impulsive decline begin this week again,
that will favor this bearish view on the hourly chart.
The invalidate line for this bearish count lies at 35516 at the recent wave [ii] high.
I know that level is a bit too close for comfort here,
And it would be easy to just call this a correction and move on with a rally phase again,
but I cant disregard the bearish potential here either!
So I am going to just let this pattern develop and let the chips fall where they may!
Tomorrow;
Watch for wave (ii) to finally top out and then for an impulsive decline to begin in wave (iii) of [iii].
GOLD
GOLD 1hr.
GOLD 4hr.
GOLD daily.
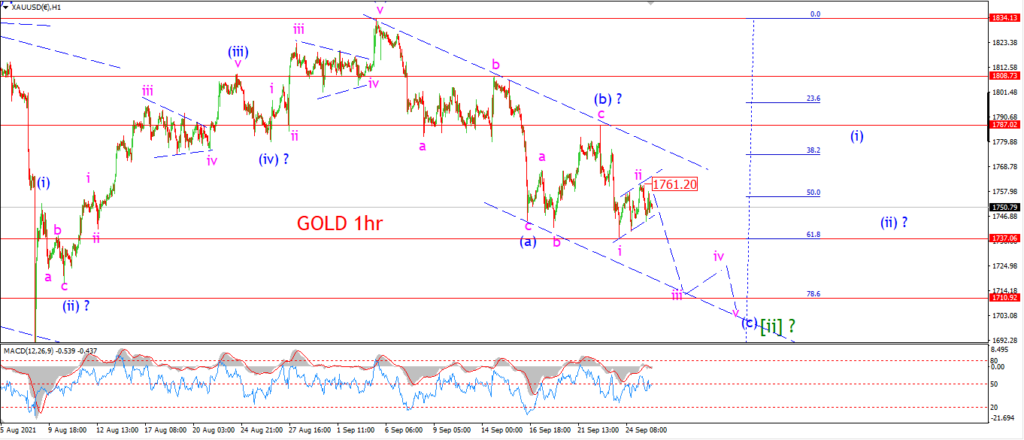
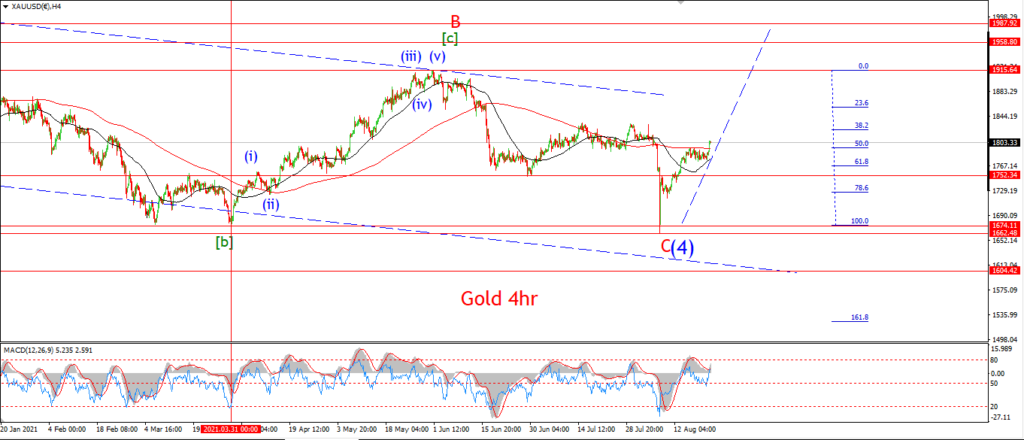
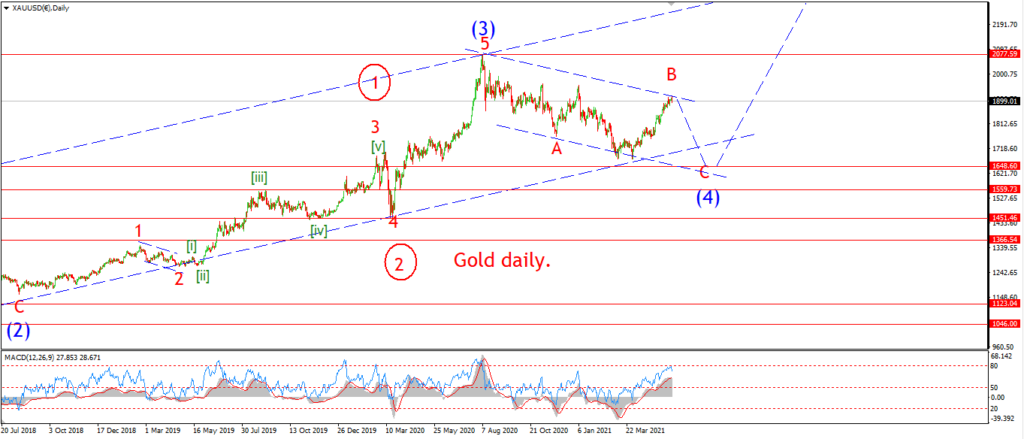
I am looking at the decline in wave (c) a little different now.
The price has traced out a clear three wave correction sideways at todays highs.
And the price fits nicely in a trend channel.
The price also spiked lower off the high of the session again today,
and this action does indicate a possible wave ‘ii’ correction now complete.
The drop again off the high is now viewed as a decline in wave ‘iii’.
this will be confirmed with a break of 1737 again.
Tomorrow;
watch for wave ‘ii’ to hold at 1761.
Wave ‘iii’ down should move sharply lower into the 1710 area again this week.
CRUDE OIL.
CRUDE OIL 1hr.
CRUDE OIL 4hr.
CRUDE OIL daily.
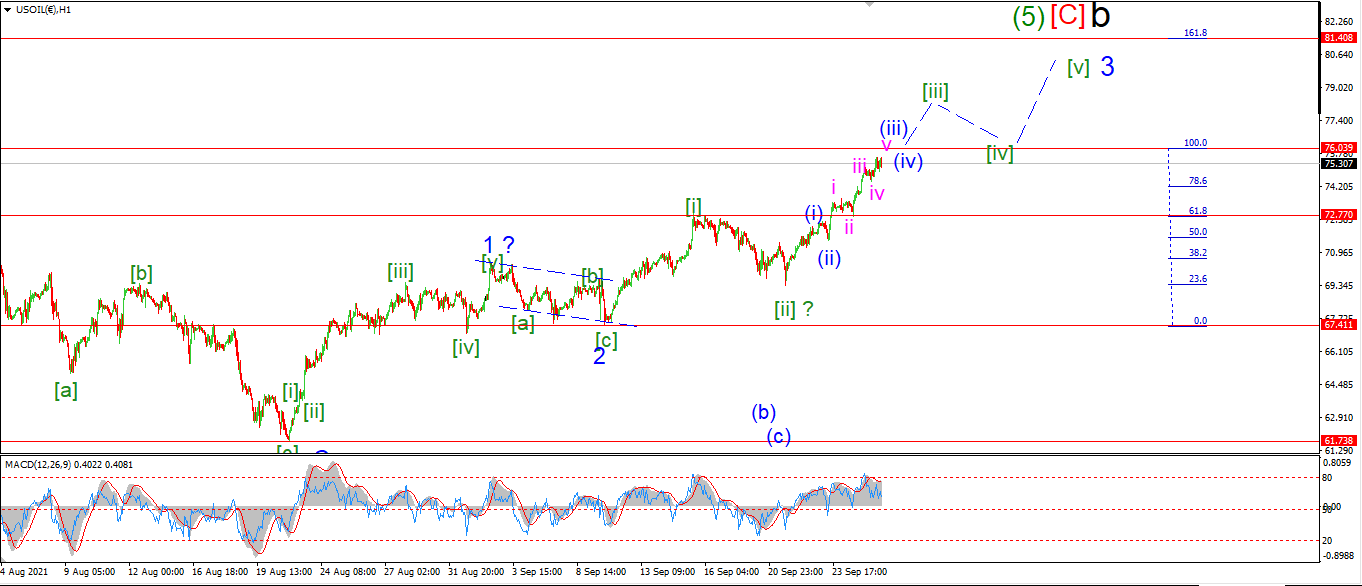
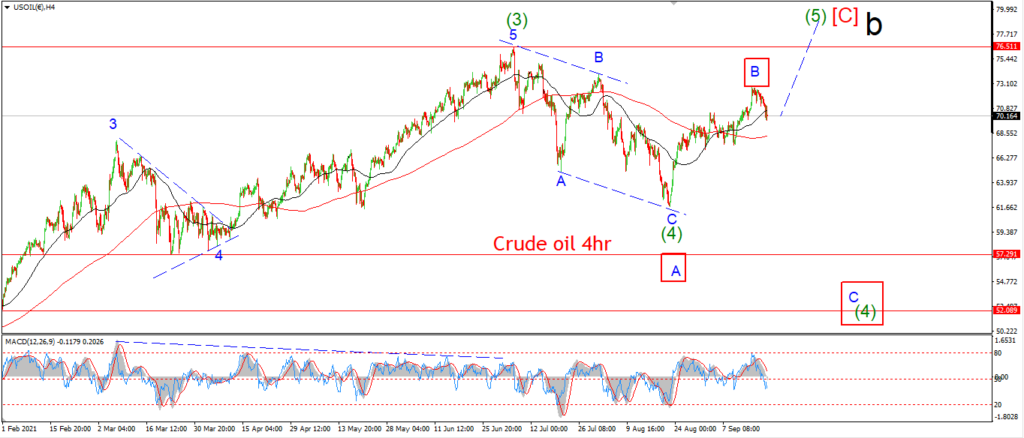
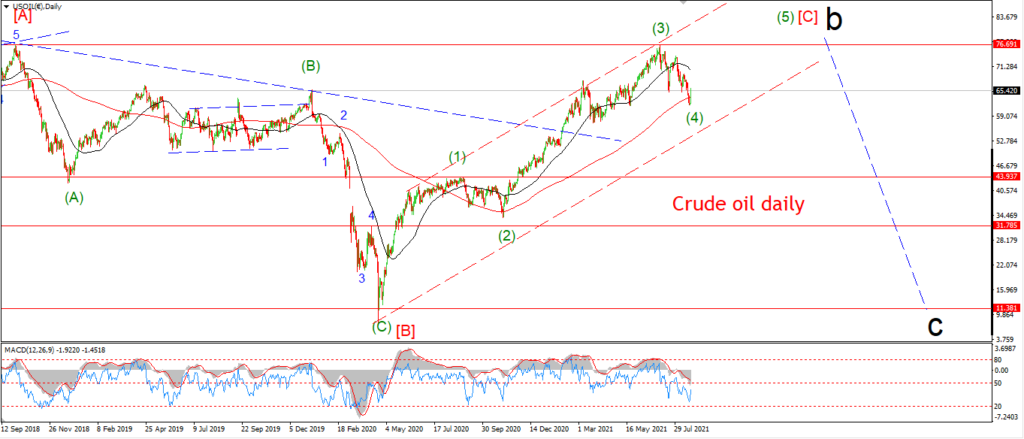
Wave [iii] up is progressing today but I am a little concerned with the range of the action.
I would normally expect a little more variation in how the structure is forming.
Especially in a third of a third scenario as we have here.
You would expect to see sharper moves higher followed by more complex corrective forms.
But I will just have to work with what we have,
rather than complain about what is not!
AS for the targets,
wave ‘3’ is reaching its minimum target level now.
as wave ‘3’ will reach equality with wave ‘1’ at 76.03,
but I think we will see wave [iii] of ‘3’ complete in the 79 area by the end of this week.
Which suggests wave ‘3’ will hit the 81.00 area to complete.
Tomorrow;
Watch for wave [iii] up to continue in a five wave pattern towards 79.00.
The price should hold above 72.77 at wave [i].
S&P 500.
S&P 500 1hr
S&P 500 4hr
S&P 500 daily.
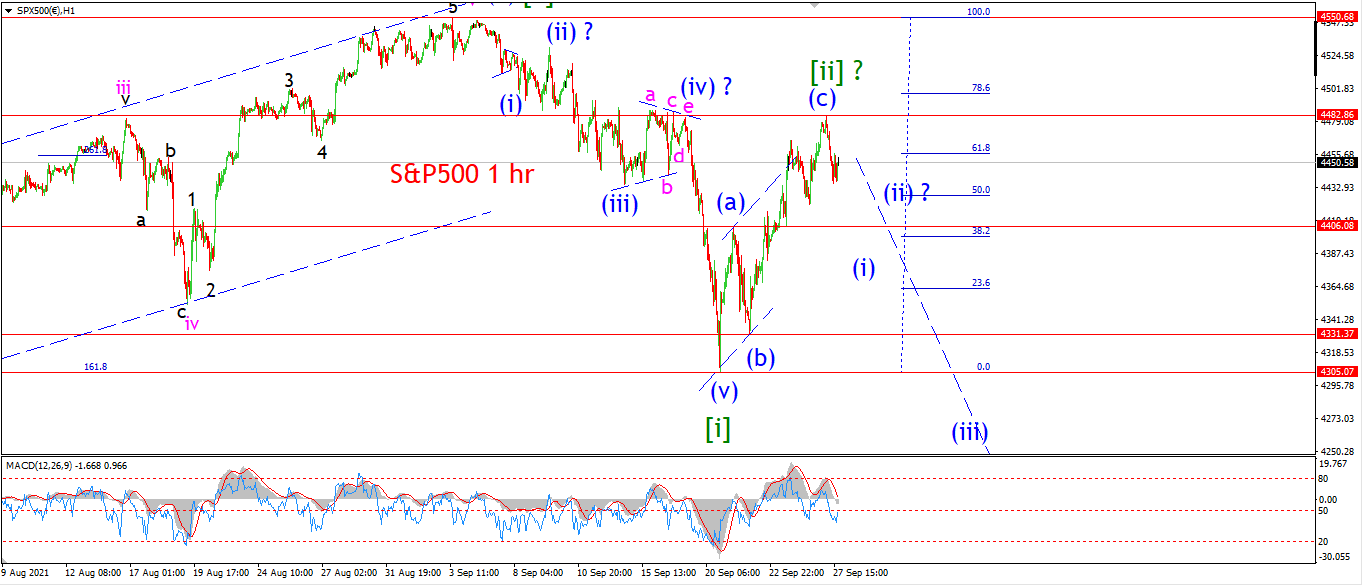
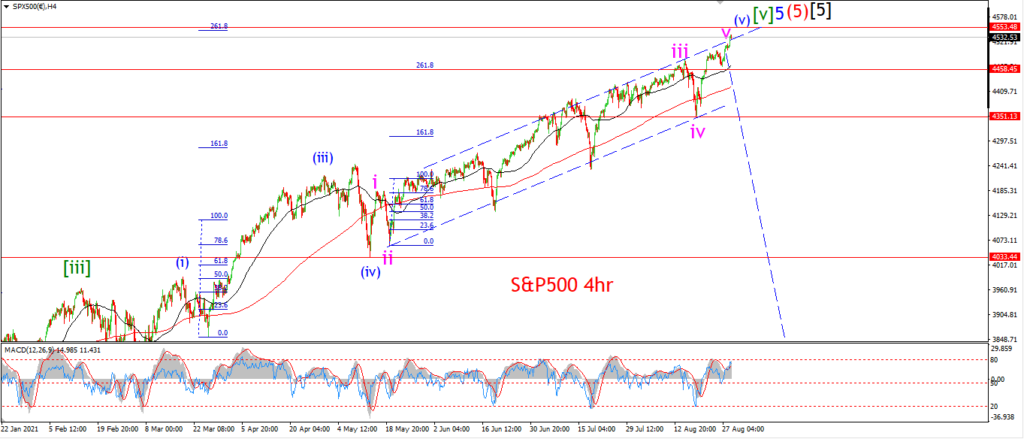
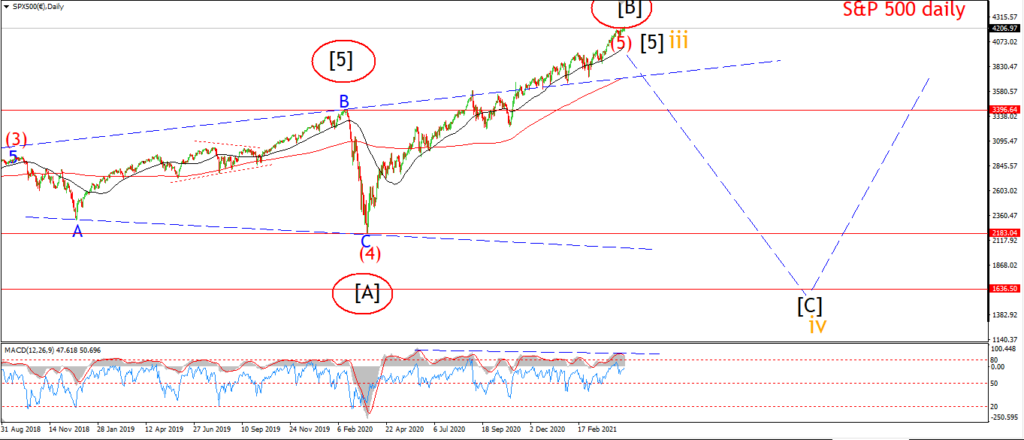
The s&p has fallen into the evening lows in a more promising pattern so far.
The price may be building a small head and shoulders off the wave [ii] high now.
this will complement the H&S around the recent high also,
which formed between wave ‘iii’ pink,
the recent top,
and now the wave [ii] high.
If this is wave (i) of [iii] now forming.
then we should see a follow through to the downside over the next few sessions.
Tomorrow;
Watch for wave [ii] to hold at the 4482 highs.
Wave (i) must now fall in a five wave pattern to break below 440 at least.
SILVER.
SILVER 1hr
SILVER 4hr.
SILVER daily.
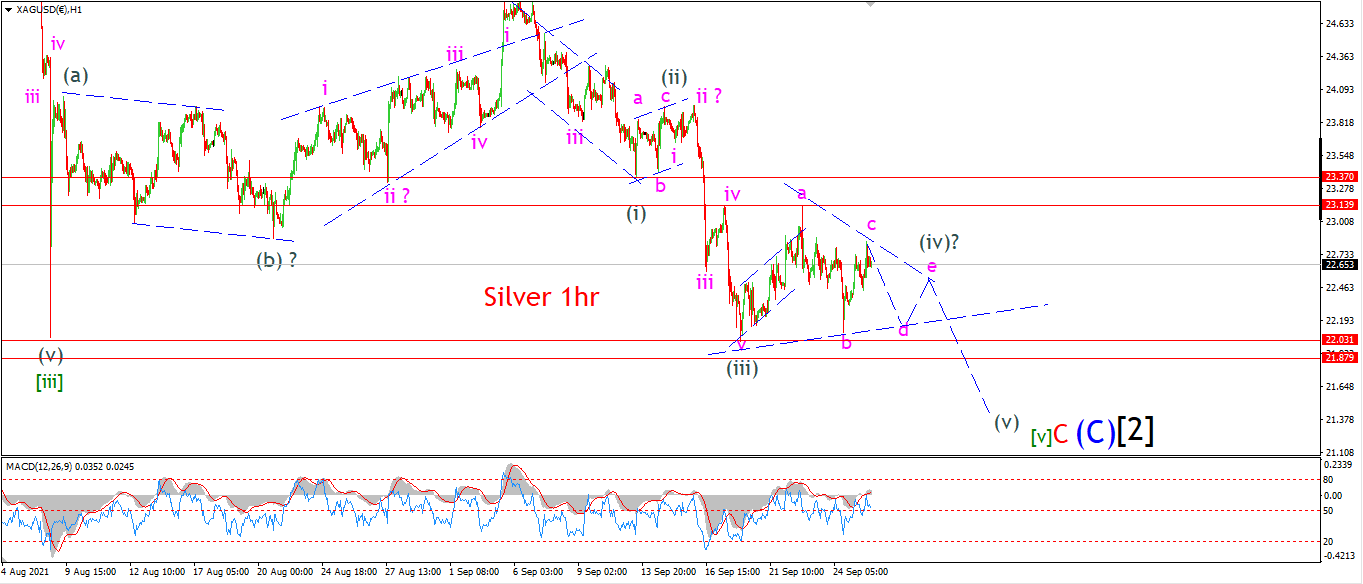
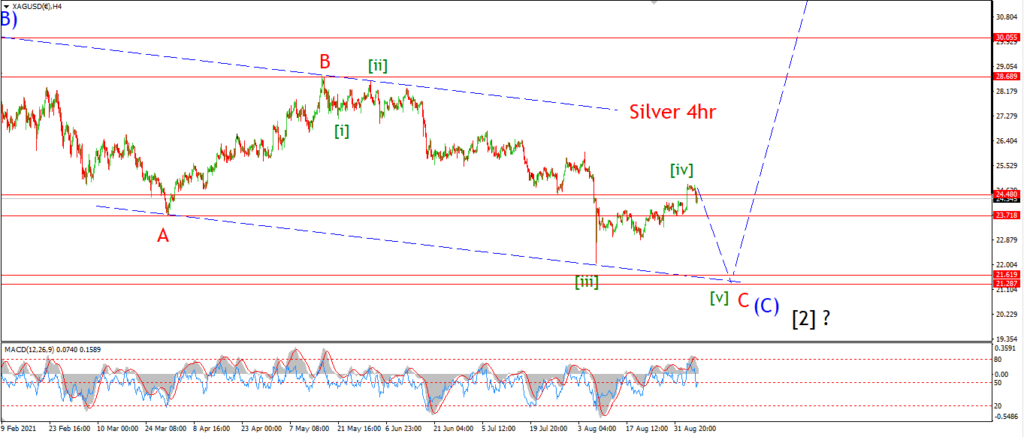
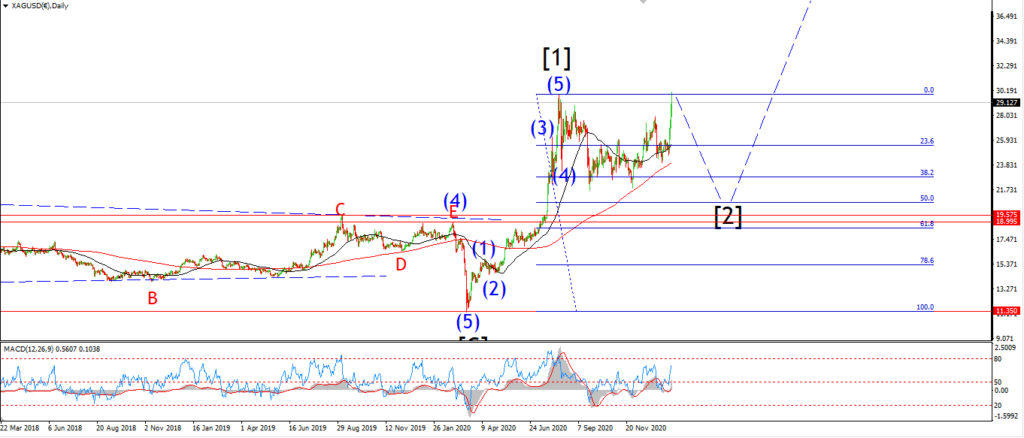
I am going with the triangle idea for wave (iv) this evening.
This pattern will require a few dead trading days where the price range gets tighter as shown.
A break of 23.13 will rule out the triangle in wave (iv).
And a break below 22.03 will signal wave (v) is underway.
Tomorrow;
Watch for wave (iv) to continue sideways and oscillate around 22.40 as wave (iv) completes.
BITCOIN
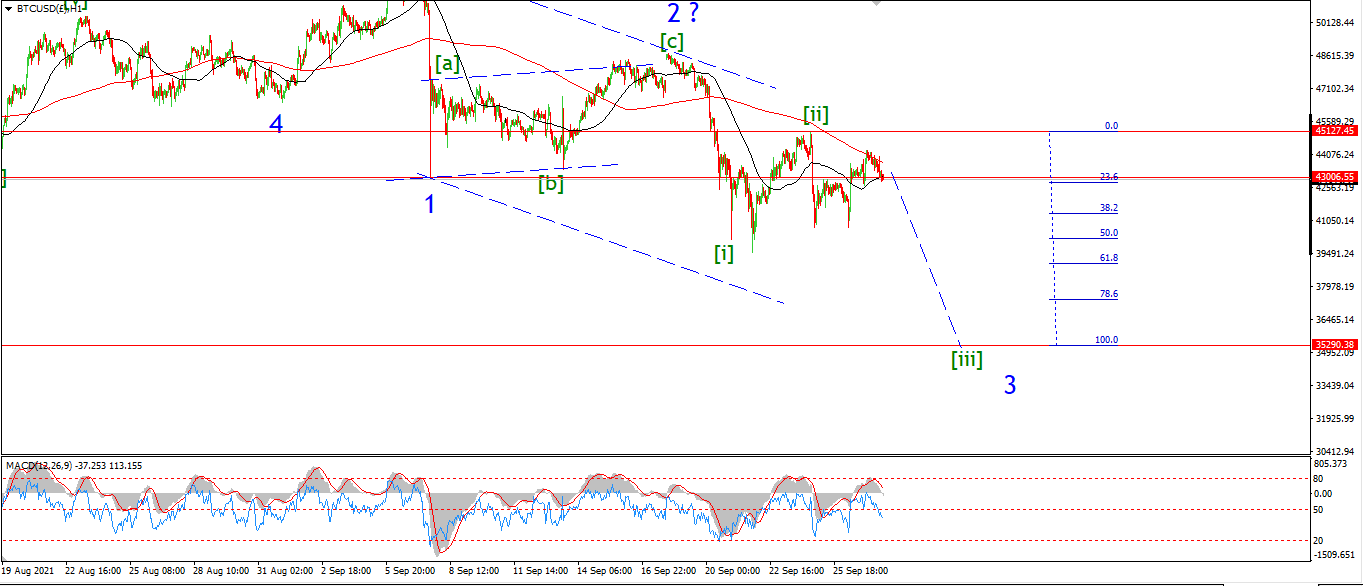
BITCOIN 1hr.
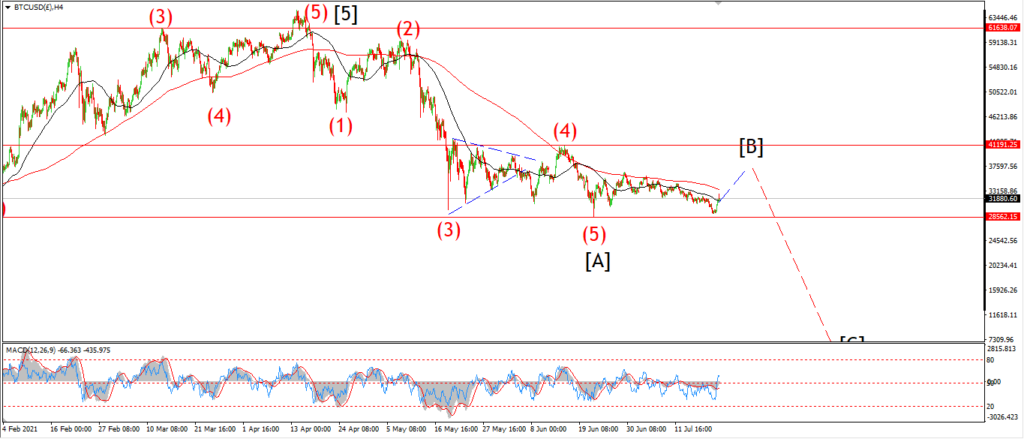
BITCOIN 4hr.
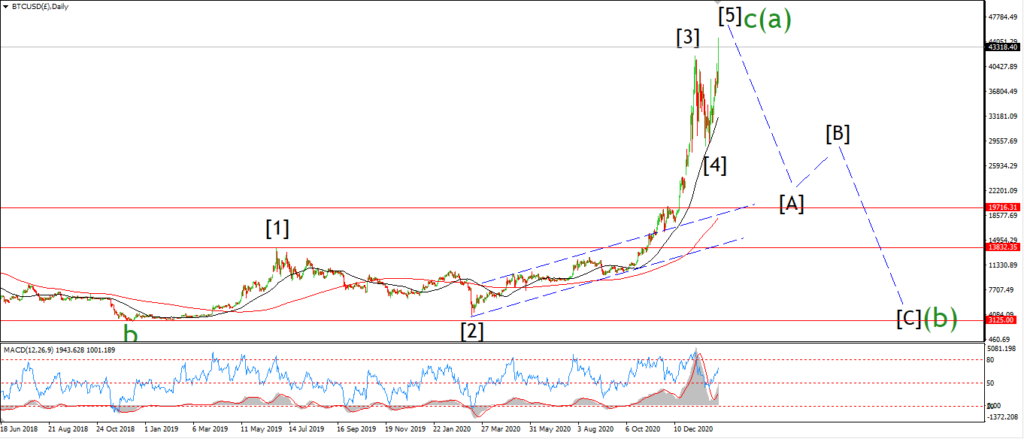
BITCOIN daily.
Topping in wave [B].
FTSE 100.
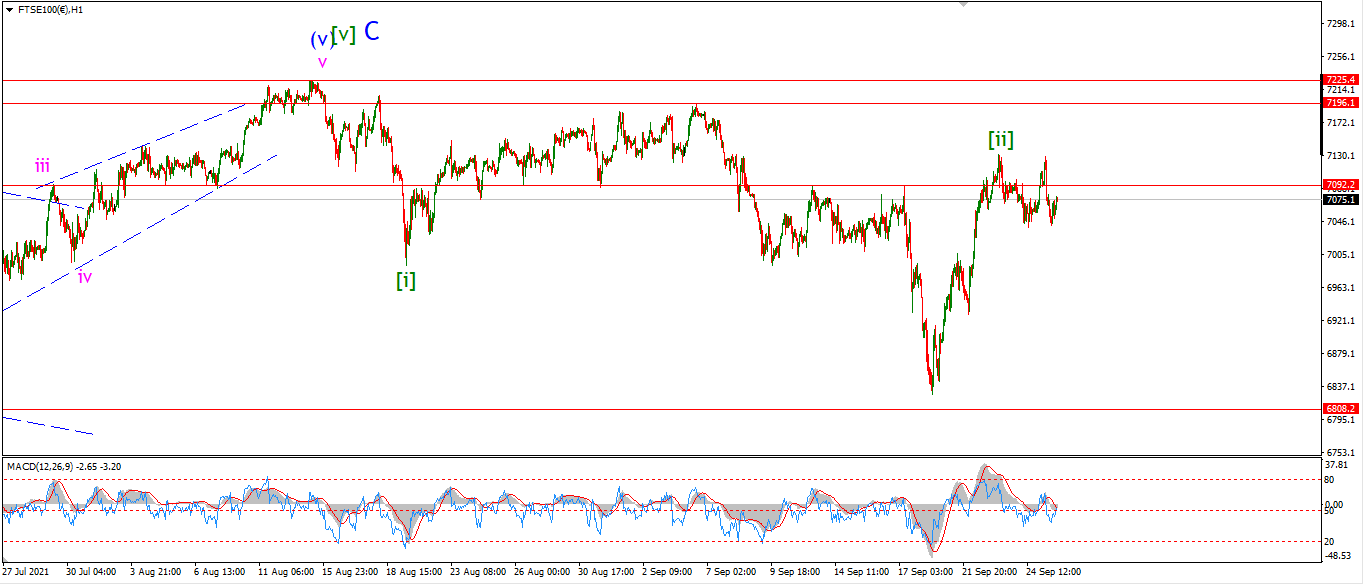
FTSE 100 1hr.
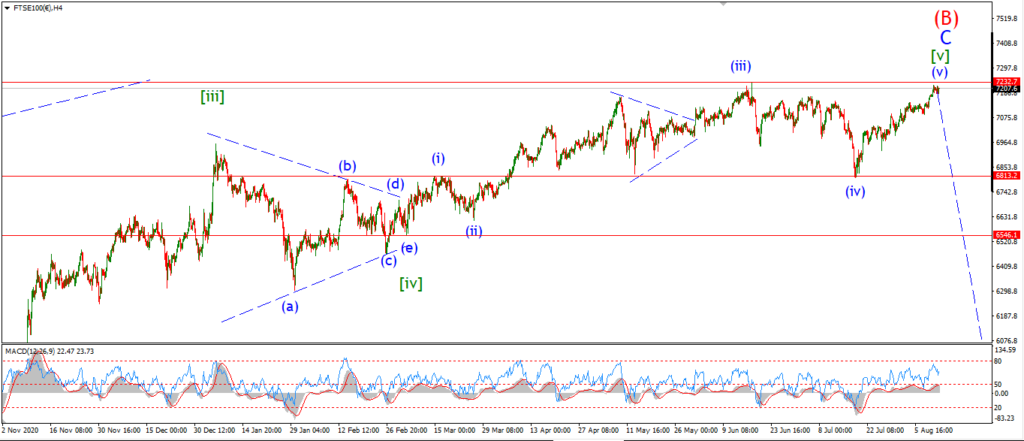
FTSE 100 4hr.

FTSE 100 daily.
Complete wave (B).
DAX.
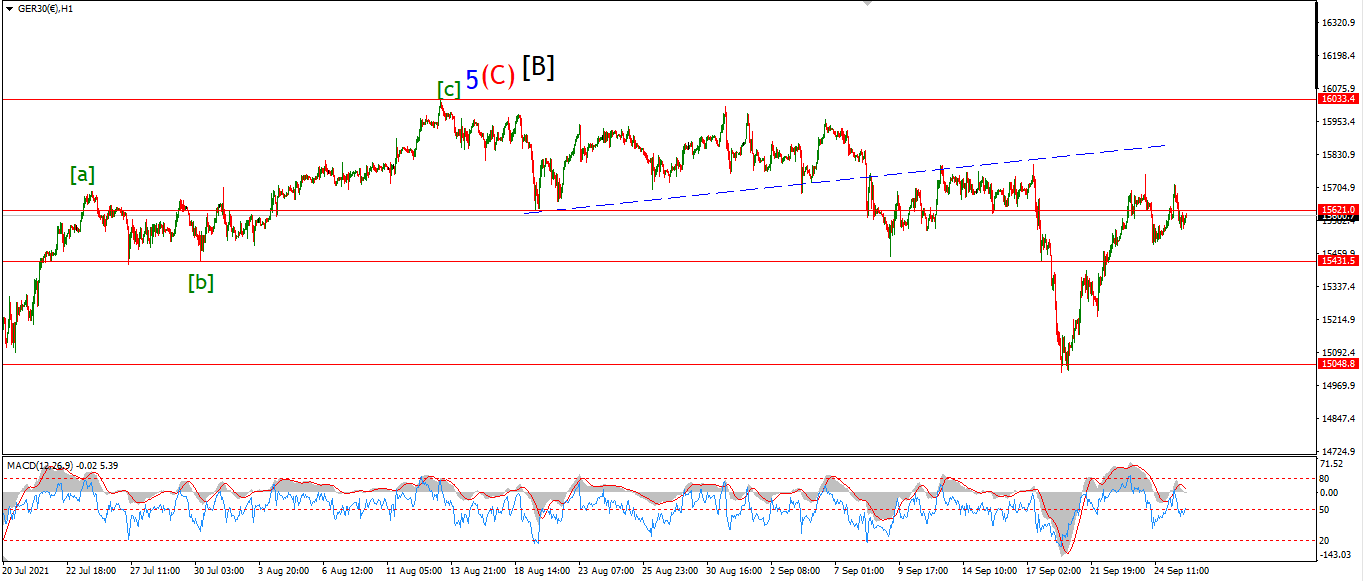
DAX 1hr
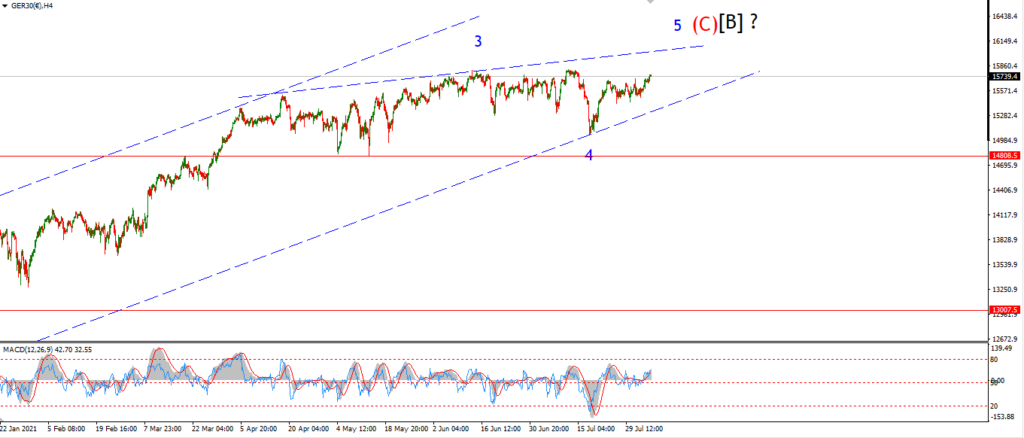
DAX 4hr
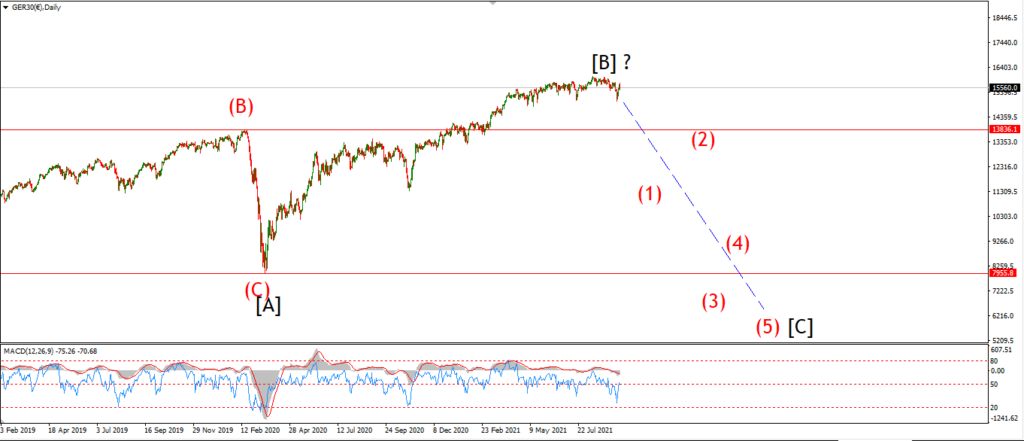
DAX daily.
Topping out in wave [B].
NASDAQ 100.
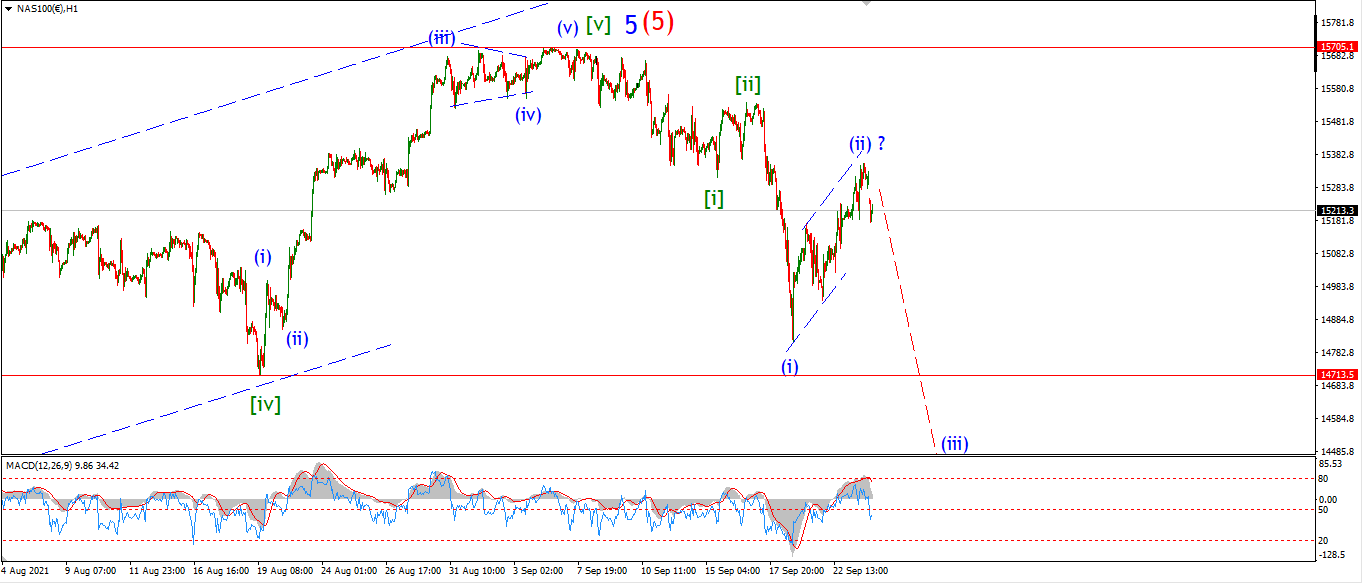
NASDAQ 1hr
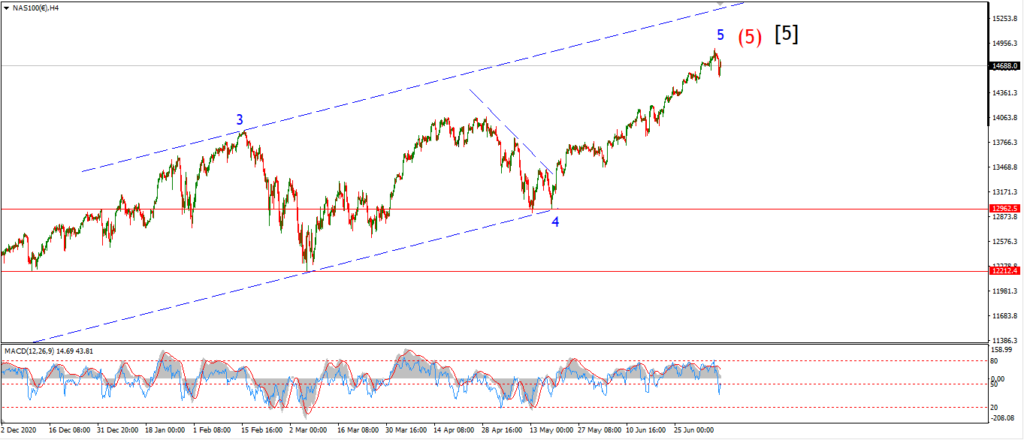
NASDAQ 4hr.
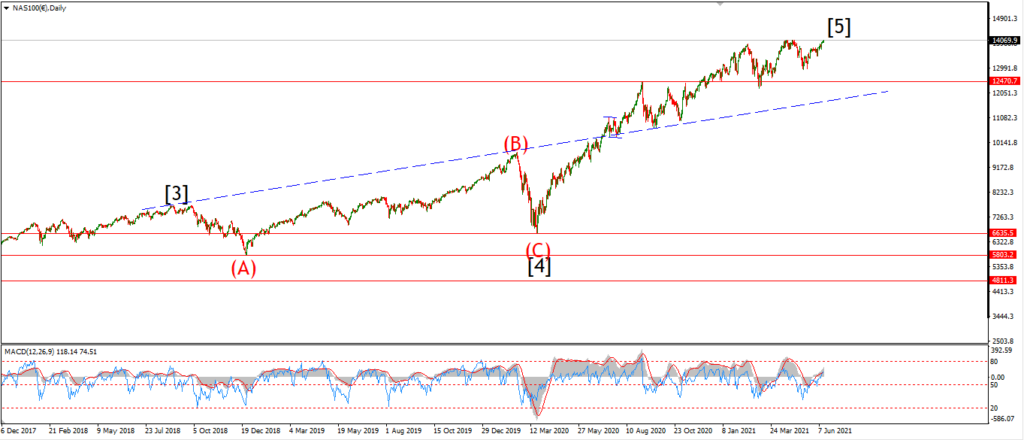
NASDAQ daily.
Is this it for the Nasdaq??