
[vc_row][vc_column][vc_separator border_width=”5″][/vc_column][/vc_row]
[vc_row][vc_column][vc_column_text]
Hi folks!
[/vc_column_text][/vc_column][/vc_row]
[vc_row][vc_column][vc_separator border_width=”5″][/vc_column][/vc_row]
[vc_row][vc_column][vc_column_text]
EURUSD
[/vc_column_text][/vc_column][/vc_row]
[vc_row][vc_column][vc_separator border_width=”5″][/vc_column][/vc_row][vc_row][vc_column width=”2/3″][vc_custom_heading text=”1 hr” use_theme_fonts=”yes”][vc_column_text]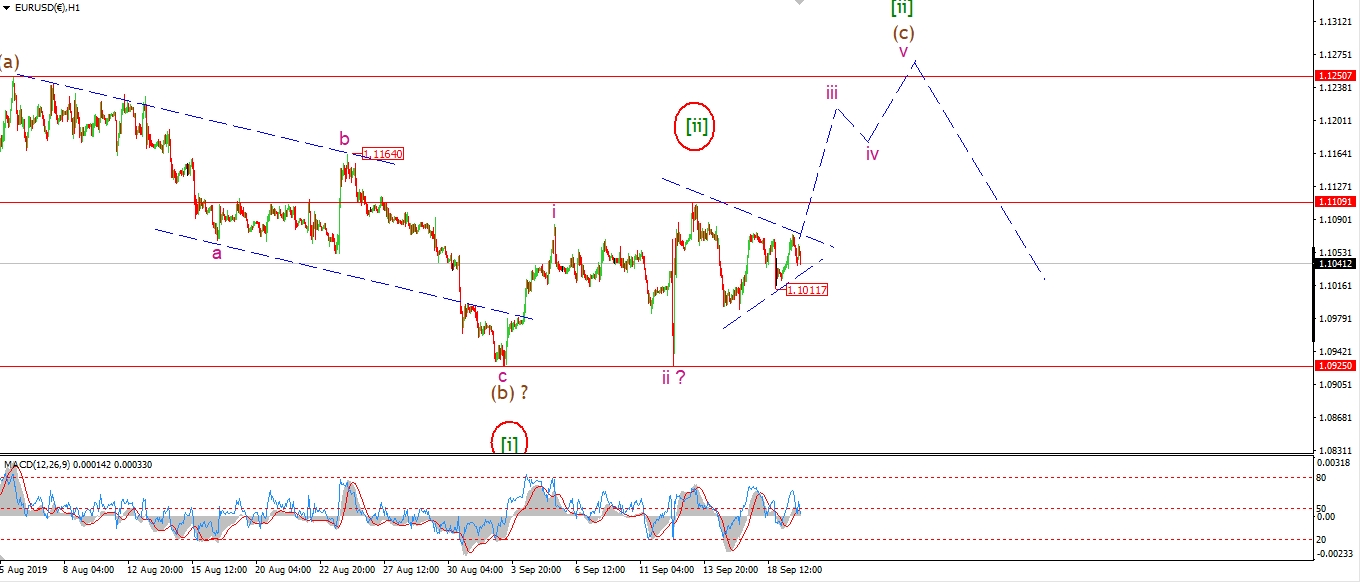 [/vc_column_text][/vc_column][vc_column width=”1/3″][vc_custom_heading text=”4 Hours” use_theme_fonts=”yes”][vc_column_text]
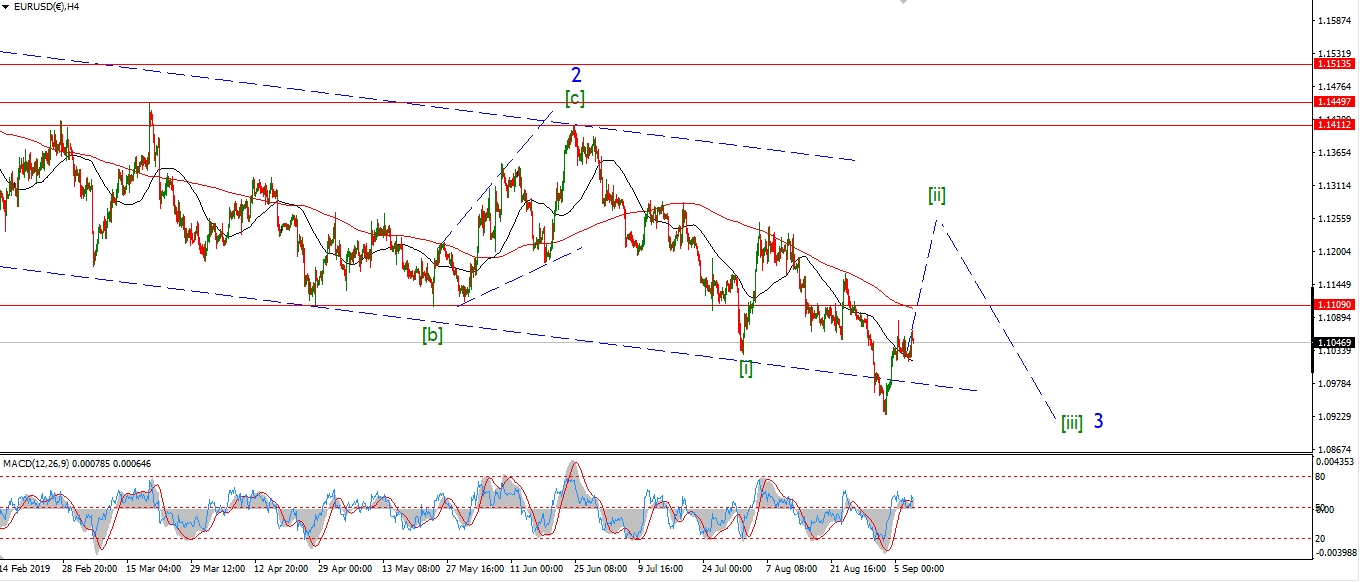 [/vc_column_text][vc_custom_heading text=”Daily” use_theme_fonts=”yes”][vc_column_text]
 [/vc_column_text][/vc_column][/vc_row]
[vc_row][vc_column][vc_column_text]
I have noticed how the price action is contracting over the last few sessions.
This action is similar to a triangle,
but a triangle does not fit well in the current short term wave count!
A compression in the trading range like this always ends with a thrust out of the pattern.
I am still leaning in favor of the upside in the short term, in wave ‘iii’ of (c).
But wave ‘iii’ is now overdue.
If that thrust higher does not come tomorrow,
then I will switch to the alternate count.
Tomorrow;
Watch for 1.1011 to hold and wave ‘iii’ up to break 1.1109.
[/vc_column_text][/vc_column][/vc_row]
[vc_row][vc_column][vc_separator border_width=”5″][/vc_column][/vc_row][vc_row][vc_column][vc_column_text]
GBPUSD
[/vc_column_text][/vc_column][/vc_row][vc_row][vc_column][vc_separator border_width=”5″][/vc_column][/vc_row][vc_row][vc_column width=”2/3″][vc_custom_heading text=”1 hr” use_theme_fonts=”yes”][vc_column_text]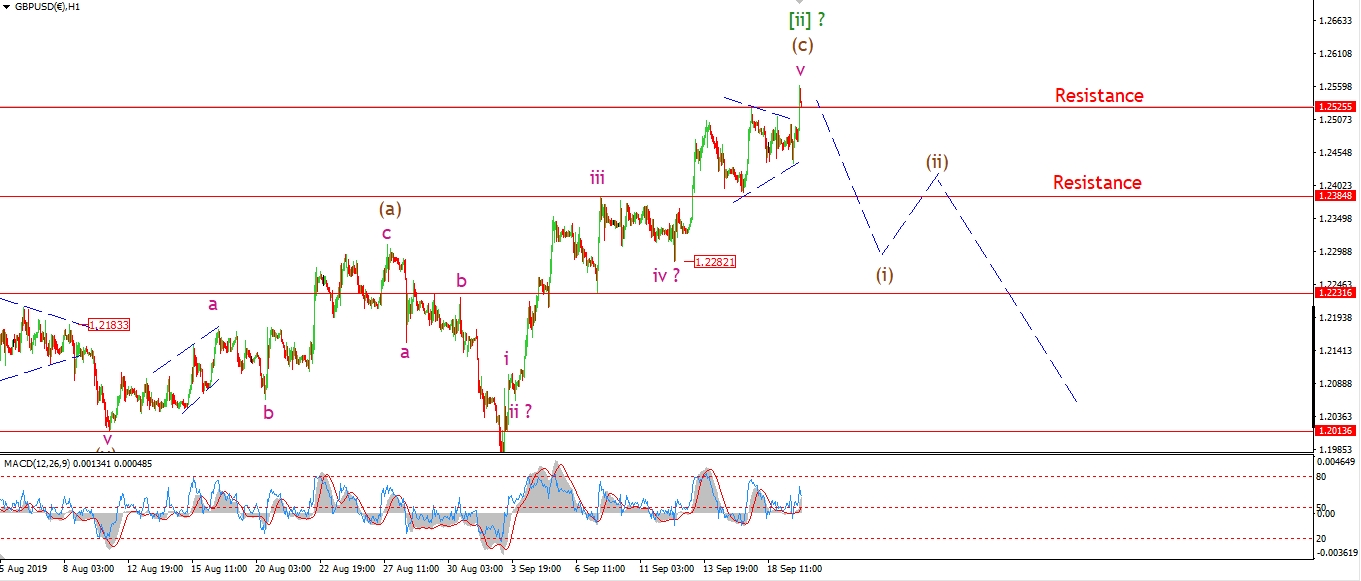 [/vc_column_text][/vc_column][vc_column width=”1/3″][vc_custom_heading text=”4 Hours” use_theme_fonts=”yes”][vc_column_text]
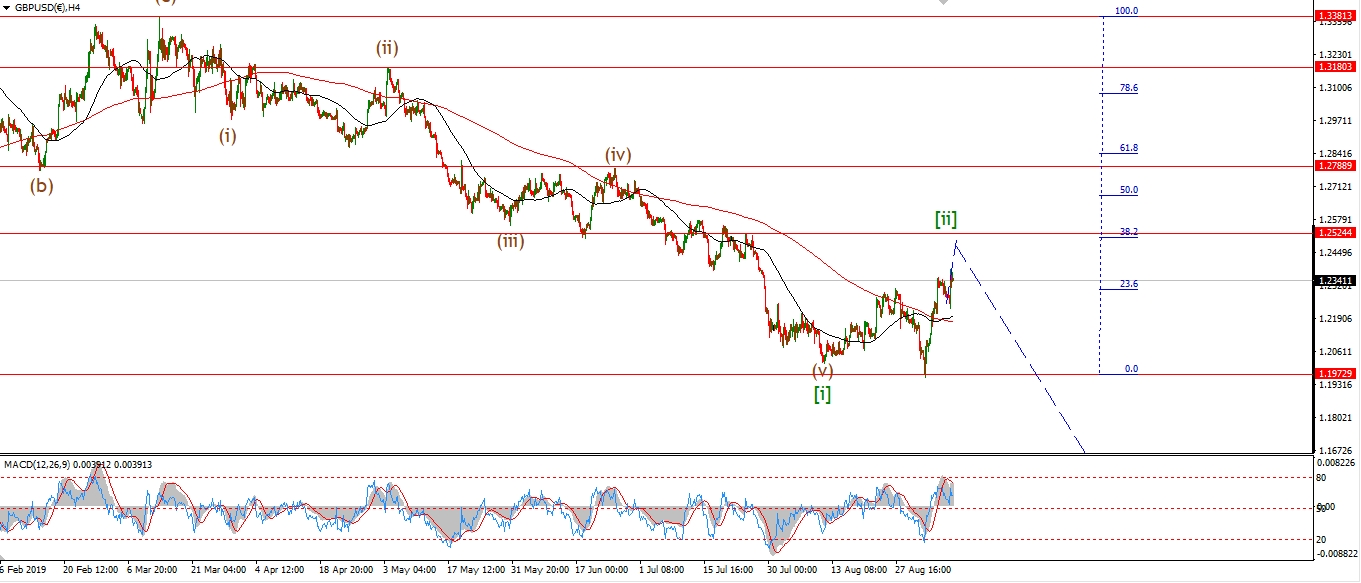 [/vc_column_text][vc_custom_heading text=”Daily” use_theme_fonts=”yes”][vc_column_text]
 [/vc_column_text][/vc_column][/vc_row]
[vc_row][vc_column][vc_column_text]
It took a while for the rally in wave (c) to begin a few weeks ago,
and now it is taking a few extra days for this rally to conclude!
Todays new high comes after a possible triangle within wave ‘v’.
That means todays rally is an ending move within the larger structure.
And this should close out wave (c).
Tomorrow;
The outlook from here is the same,
I am looking for a five wave decline off the top
and a correction to a lower high as shown.
This will be the best signal that wave {iii] down has begun.
[/vc_column_text][/vc_column][/vc_row]
[vc_row][vc_column][vc_separator border_width=”5″][/vc_column][/vc_row][vc_row][vc_column][vc_column_text]
USDJPY
[/vc_column_text][/vc_column][/vc_row][vc_row][vc_column][vc_separator border_width=”5″][/vc_column][/vc_row][vc_row][vc_column width=”2/3″][vc_custom_heading text=”1 hr” use_theme_fonts=”yes”][vc_column_text]
[/vc_column_text][/vc_column][vc_column width=”1/3″][vc_custom_heading text=”4 Hours” use_theme_fonts=”yes”][vc_column_text]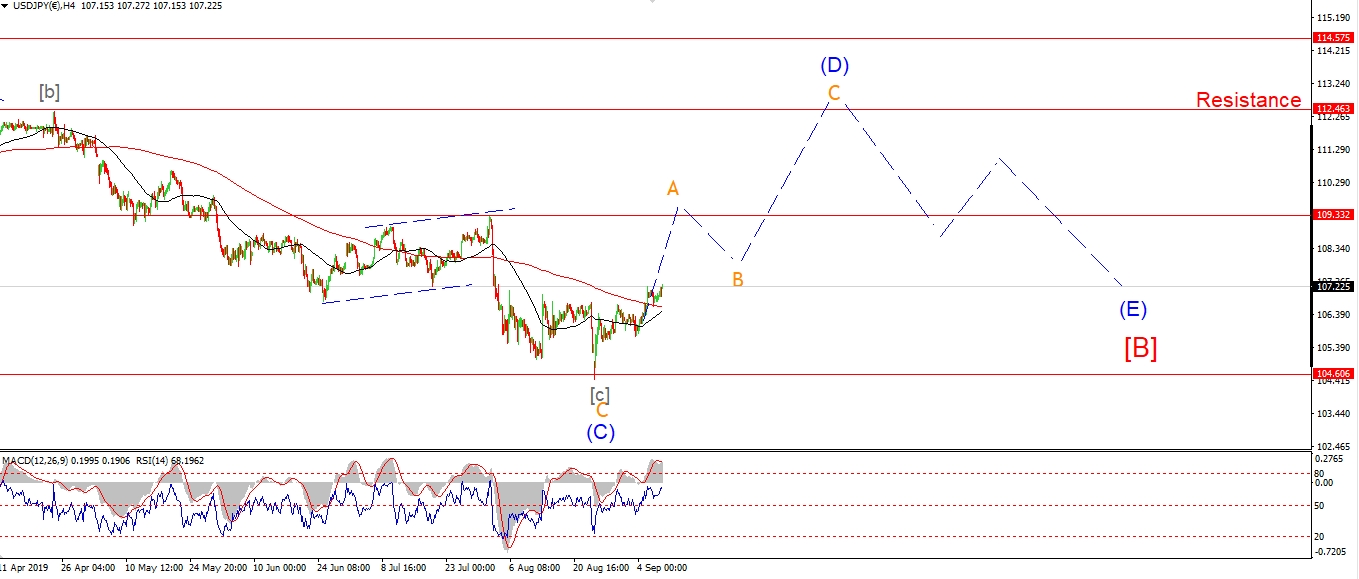 [/vc_column_text][vc_custom_heading text=”Daily” use_theme_fonts=”yes”][vc_column_text]
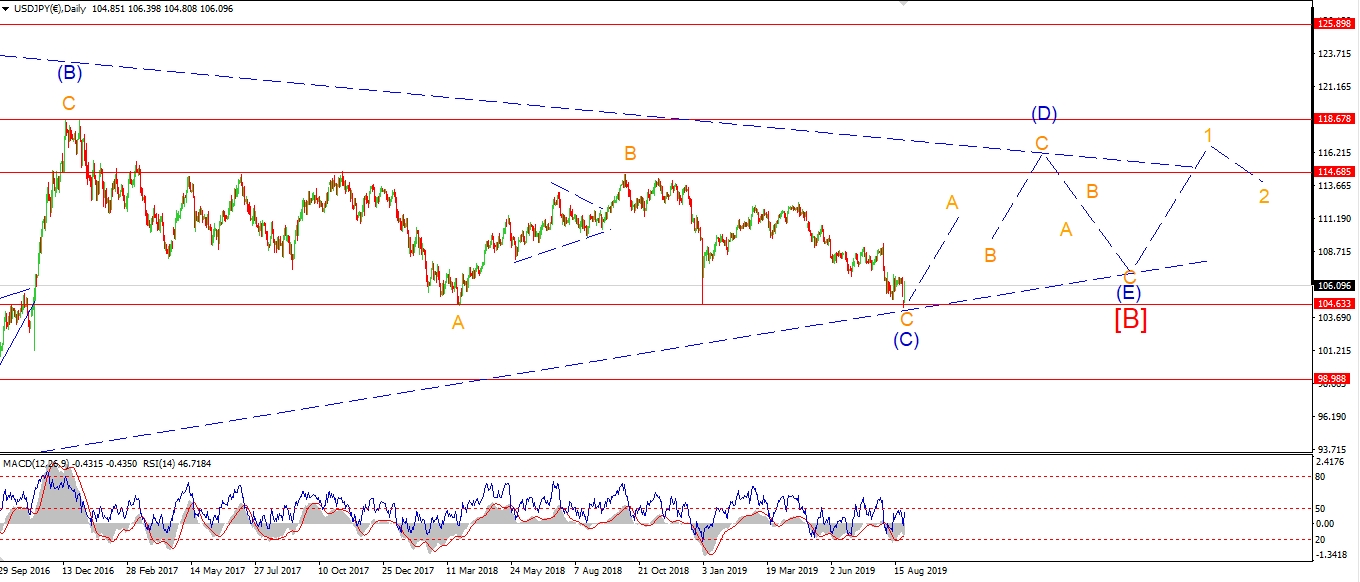 [/vc_column_text][/vc_column][/vc_row]
[vc_row][vc_column][vc_column_text]
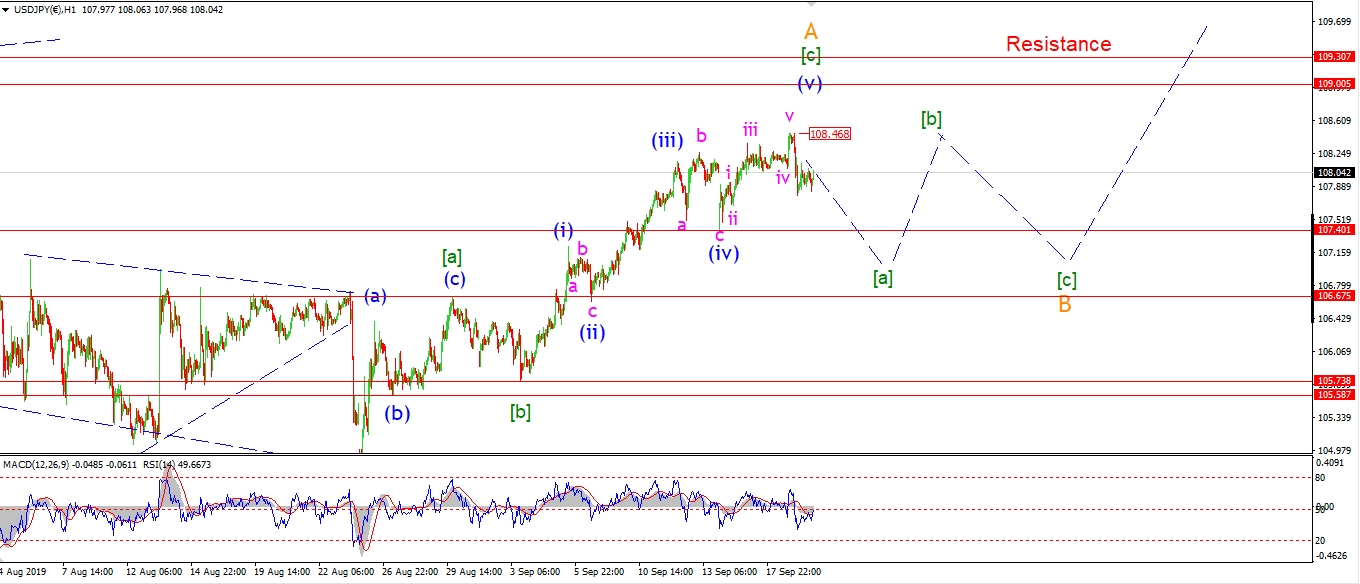
USDJPY has fallen off the high registered last night at 108.47.
It looks like wave ‘A’ up is now complete,
the internal pattern within wave ‘A’ traced out a 3,3,5 form,
which fits a flat correction.
Todays decline has kicked off wave ‘B’
and we should now move sideways for the next week or more in three waves as shown.
It is early days in wave ‘B’ so we will have to wait and see what pattern will emerge next week.
Tomorrow;
An early target for wave ‘B’ lies at 106.67 where wave [a] of ‘A’ topped out.
Wave [a] of ‘B’ should continue lower tomorrow.
[/vc_column_text][/vc_column][/vc_row]
[vc_row][vc_column][vc_separator border_width=”5″][/vc_column][/vc_row][vc_row][vc_column][vc_column_text]
DOW JONES INDUSTRIALS
[/vc_column_text][/vc_column][/vc_row][vc_row][vc_column][vc_separator border_width=”5″][/vc_column][/vc_row][vc_row][vc_column width=”2/3″][vc_custom_heading text=”1 hr” use_theme_fonts=”yes”][vc_column_text]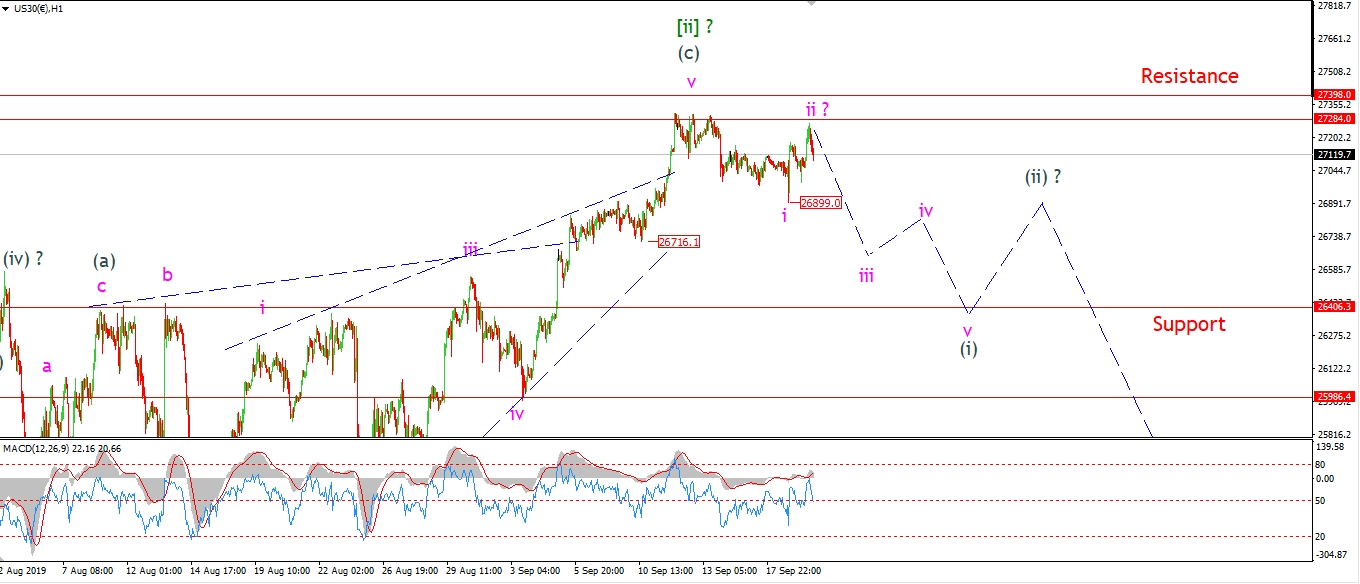 [/vc_column_text][/vc_column][vc_column width=”1/3″][vc_custom_heading text=”4 Hours” use_theme_fonts=”yes”][vc_column_text]
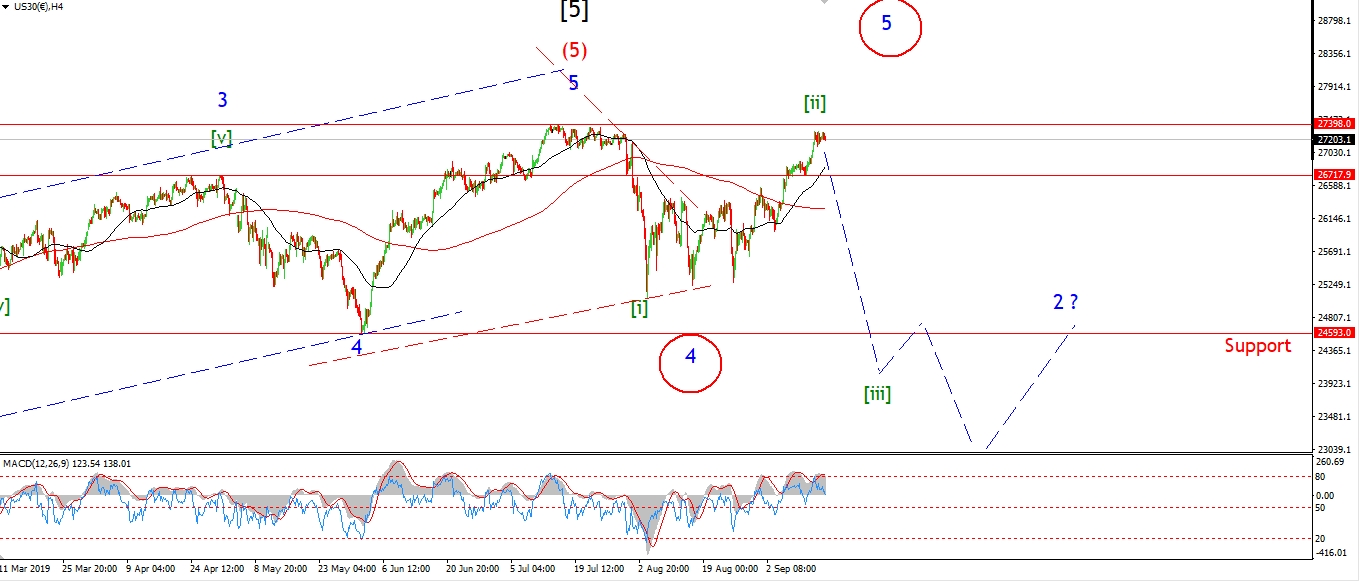 [/vc_column_text][vc_custom_heading text=”Daily” use_theme_fonts=”yes”][vc_column_text]
 [/vc_column_text][/vc_column][/vc_row]
[vc_row][vc_column][vc_column_text]
I am a glutton for punishment these days!
The market sold off in the late trade yesterday
which was welcome in terms of the bearish count.
But the market rallied again today to another lower high!
The pattern into todays high traced out three waves,
again, this pattern lends itself to a correction higher in wave ‘ii’.
the market has sold off this evening,
so this could be wave ‘iii’ down as I have waited so long for!
Wave ‘iii’ down must break 26700 in a nice sharp move.
And that is what I will look for tomorrow.
tomorrow;
Watch for the high to hold again at wave [ii].
A break of 26899 should signal wave ‘iii’ has begun.
[/vc_column_text][/vc_column][/vc_row]
[vc_row][vc_column][vc_separator border_width=”5″][/vc_column][/vc_row][vc_row][vc_column][vc_column_text]
GOLD
[/vc_column_text][/vc_column][/vc_row][vc_row][vc_column][vc_separator border_width=”5″][/vc_column][/vc_row][vc_row][vc_column width=”2/3″][vc_custom_heading text=”1 hr” use_theme_fonts=”yes”][vc_column_text]
 [/vc_column_text][/vc_column][vc_column width=”1/3″][vc_custom_heading text=”4 Hours” use_theme_fonts=”yes”][vc_column_text]
 [/vc_column_text][vc_custom_heading text=”Daily” use_theme_fonts=”yes”][vc_column_text]
 [/vc_column_text][/vc_column][/vc_row]
[vc_row][vc_column][vc_column_text]
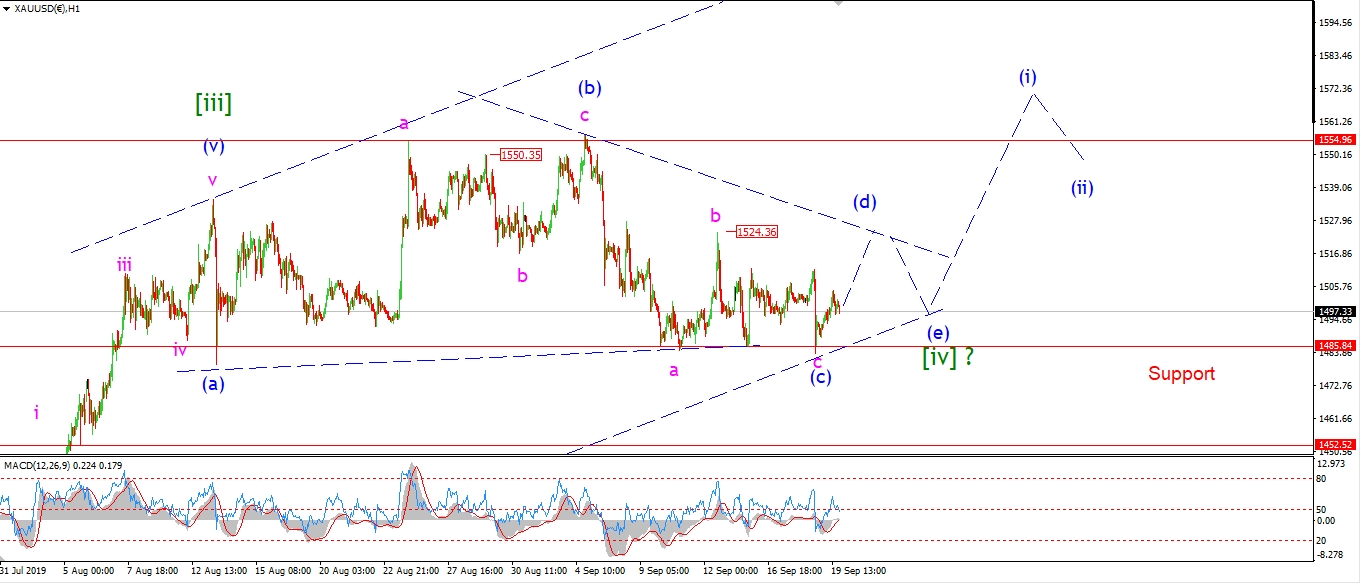
Gold spiked lower late last evening to break the 1485 low,
which rules out the previous triangle idea.
It is still possible that todays new low is wave (c) of that larger wave [iv] triangle.
The recent action does not fit any other pattern very well,
so the triangle is still the best interpretation.
tomorrow;
This count suggests that the price range will continue to contract around 1500 for another few days as wave (d) and (e) continue.
Watch for wave (d) to push up to about 1530 again in three waves.
[/vc_column_text][/vc_column][/vc_row]
[vc_row][vc_column][vc_separator border_width=”5″][/vc_column][/vc_row][vc_row][vc_column][vc_column_text]
U.S CRUDE OIL
[/vc_column_text][/vc_column][/vc_row][vc_row][vc_column][vc_separator border_width=”5″][/vc_column][/vc_row][vc_row][vc_column width=”2/3″][vc_custom_heading text=”1 hr” use_theme_fonts=”yes”][vc_column_text]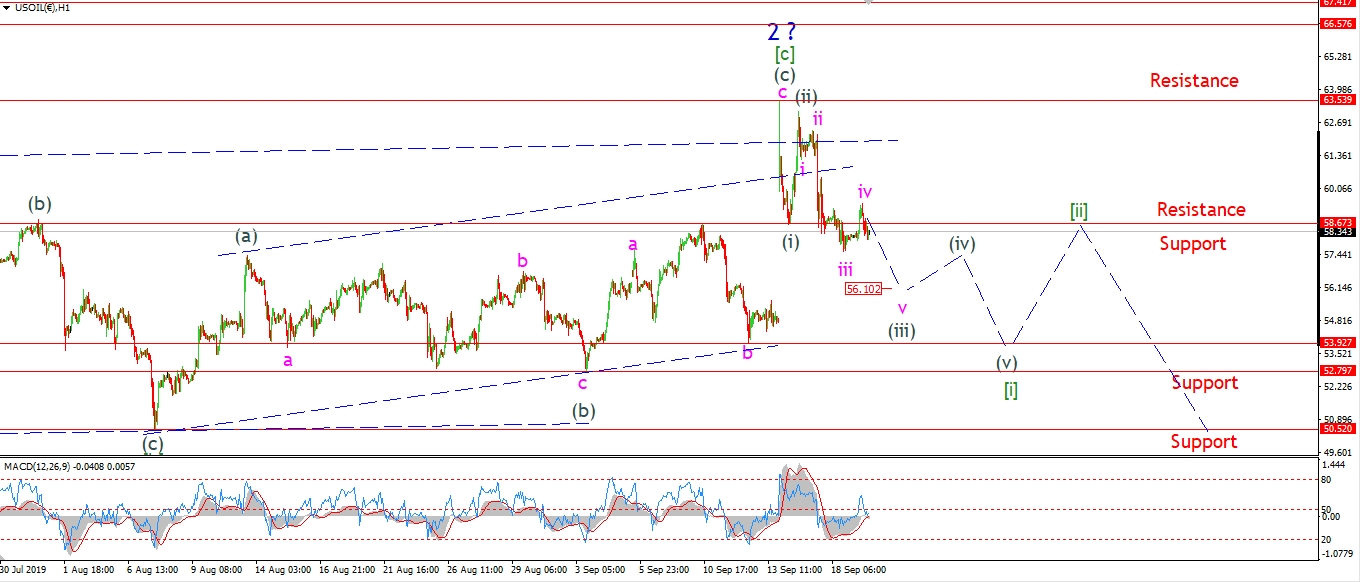 [/vc_column_text][/vc_column][vc_column width=”1/3″][vc_custom_heading text=”4 Hours” use_theme_fonts=”yes”][vc_column_text]
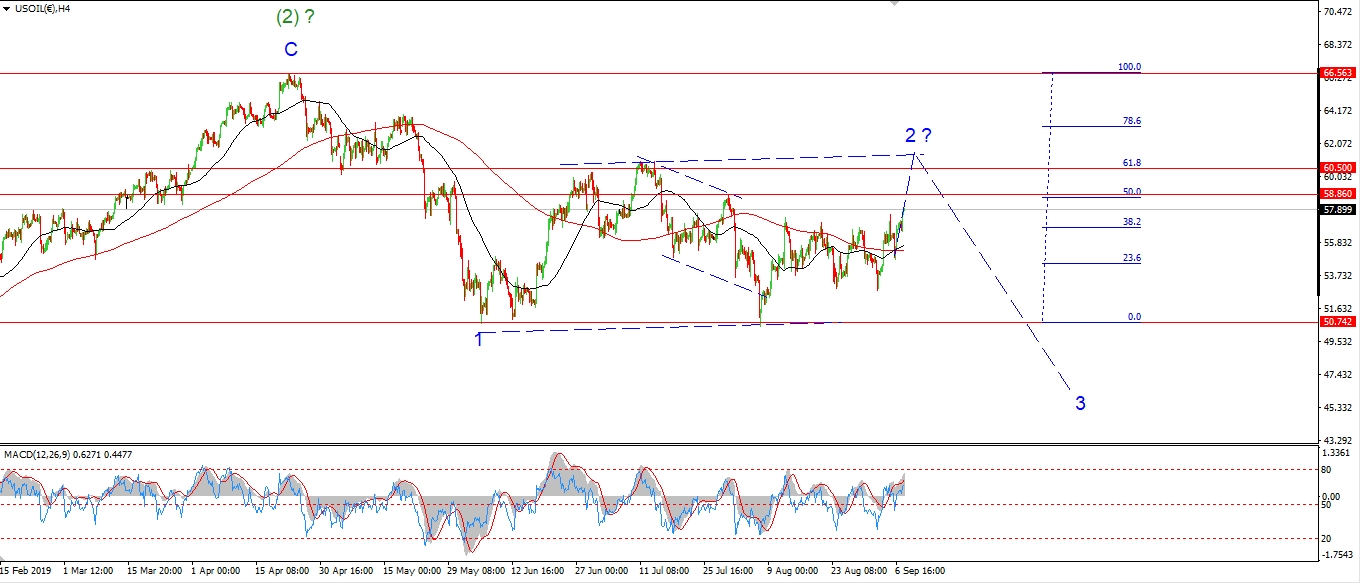 [/vc_column_text][vc_custom_heading text=”Daily” use_theme_fonts=”yes”][vc_column_text]
 [/vc_column_text][/vc_column][/vc_row]
[vc_row][vc_column][vc_column_text]
Crude corrected higher in three waves today which completed wave ‘iv’ of (iii).
The price is falling again this evening in a possible wave ‘v’ of (iii).
So wave ‘v’ should continue lower and hit about 56.00 again,
to close out the gap created on Monday.
Wave (iv) is then expected to hold below 58.00 next week.
Tomorrow;
Watch for wave ‘v’ of (iii) to drop to a new low and fill Mondays gap.
[/vc_column_text][/vc_column][/vc_row]
[vc_row][vc_column][vc_separator border_width=”5″][/vc_column][/vc_row][vc_row][vc_column][vc_column_text]
US 10 yr Treasuries.
[/vc_column_text][/vc_column][/vc_row][vc_row][vc_column][vc_separator border_width=”5″][/vc_column][/vc_row][vc_row][vc_column width=”2/3″][vc_custom_heading text=”1 hr” use_theme_fonts=”yes”][vc_column_text]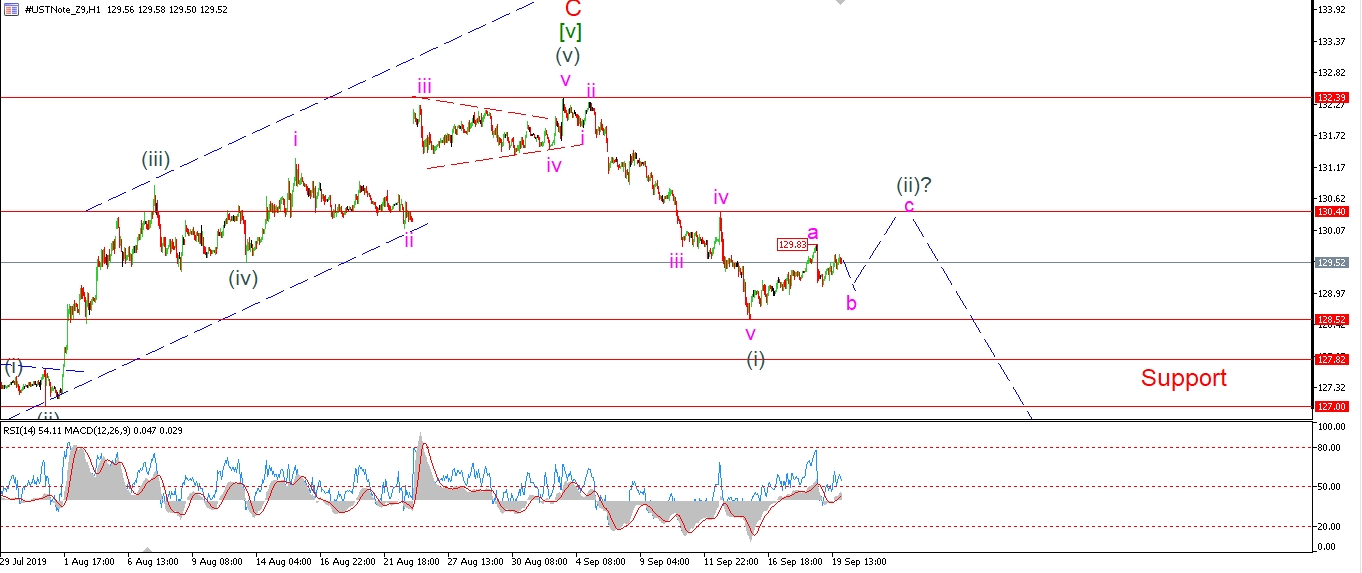 [/vc_column_text][/vc_column][vc_column width=”1/3″][vc_custom_heading text=”4 Hours” use_theme_fonts=”yes”][vc_column_text]
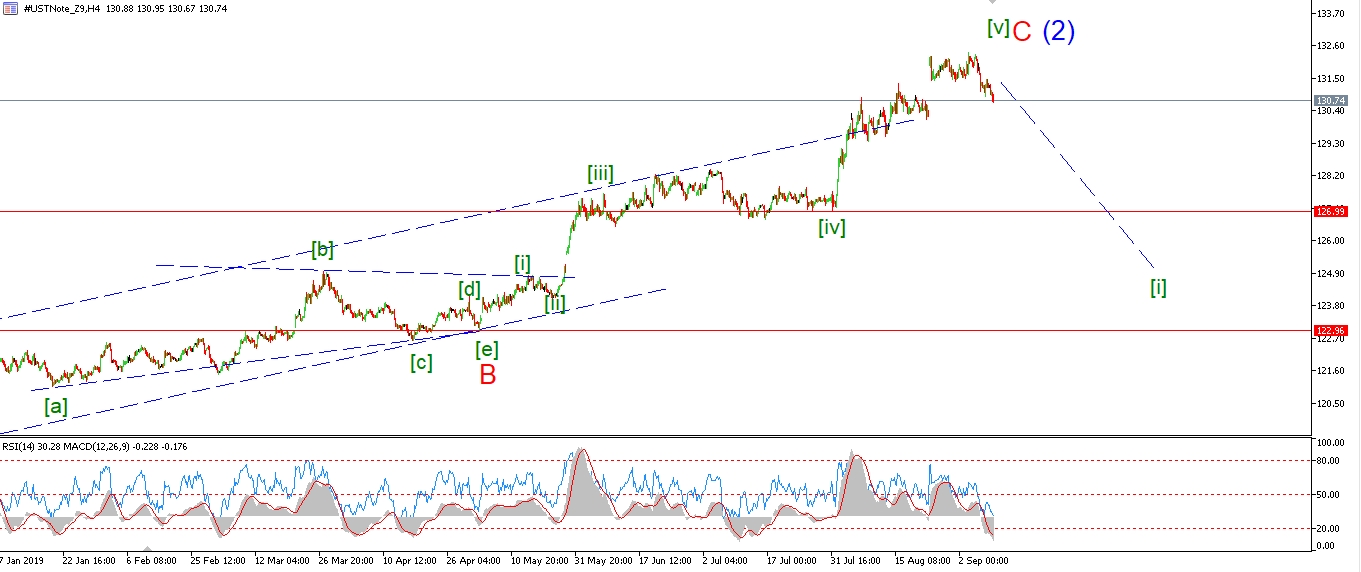 [/vc_column_text][vc_custom_heading text=”Daily” use_theme_fonts=”yes”][vc_column_text]
 [/vc_column_text][/vc_column][/vc_row]
[vc_row][vc_column][vc_column_text]
We are nearing a completed bearish signal in bonds now.
Wave ‘a’ did top out last night as suggested.
Today’s decline begins a three wave correction in wave ‘b’ of (ii).
And wave ‘c’ should rally again next week towards the target at 130.40.
Tomorrow;
Wave ‘b’ should complete above 128.52 early tomorrow.
Wave ‘c’ will be confirmed with a break of 129.83.
[/vc_column_text][/vc_column][/vc_row]
[vc_row][vc_column][vc_separator border_width=”5″][/vc_column][/vc_row][vc_row][vc_column][vc_column_text]
SILVER
[/vc_column_text][/vc_column][/vc_row][vc_row][vc_column][vc_separator border_width=”5″][/vc_column][/vc_row][vc_row][vc_column width=”2/3″][vc_custom_heading text=”1 hr” use_theme_fonts=”yes”][vc_column_text]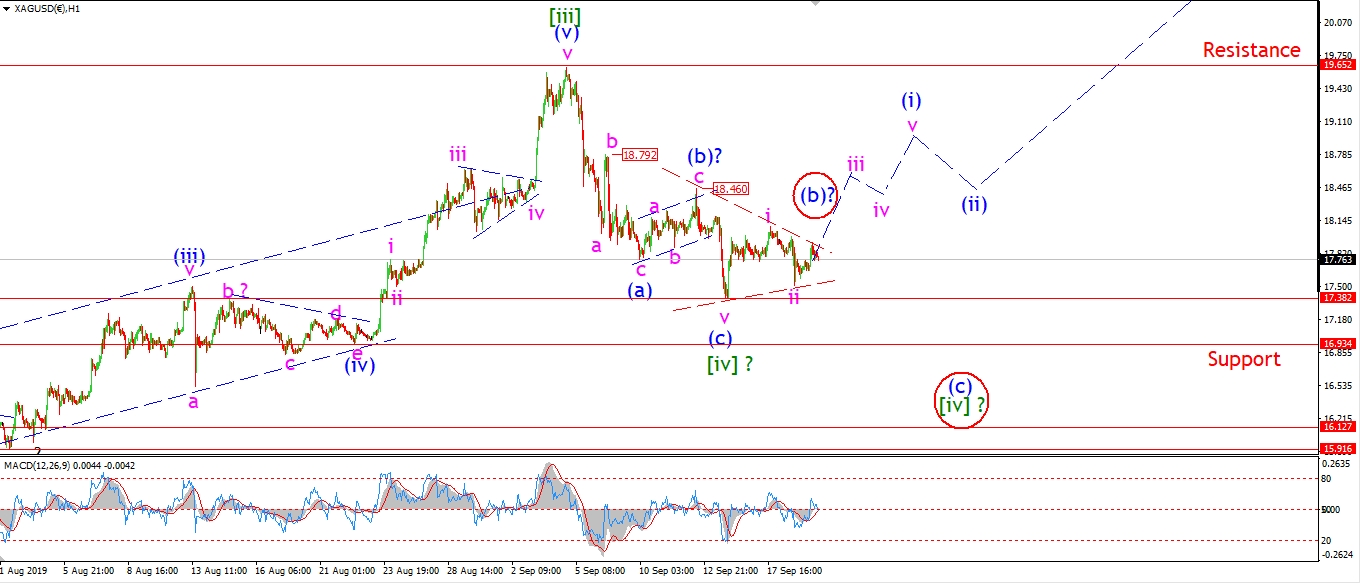 [/vc_column_text][/vc_column][vc_column width=”1/3″][vc_custom_heading text=”4 Hours” use_theme_fonts=”yes”][vc_column_text]
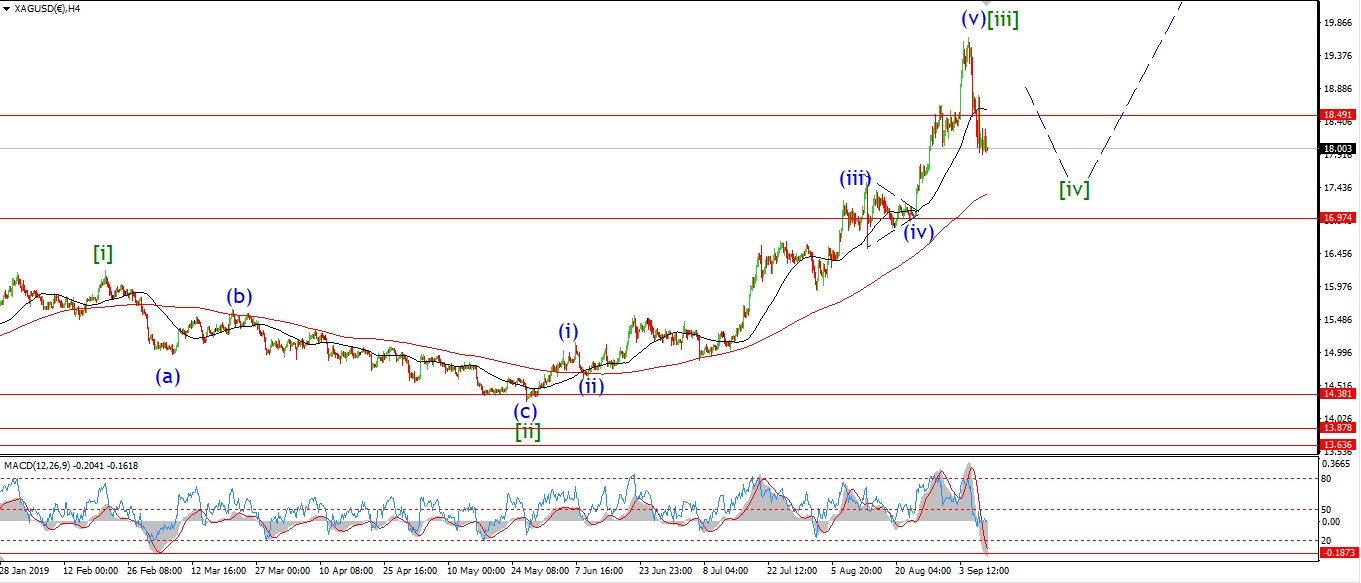 [/vc_column_text][vc_custom_heading text=”Daily” use_theme_fonts=”yes”][vc_column_text]
 [/vc_column_text][/vc_column][/vc_row]
[vc_row][vc_column][vc_column_text]
Silver failed to confirm the bullish count today,
so I am going to be a little more cautious with silver this evening.
The alternate count I have shown on the short term chart
calls for a triangle to form in wave (b) of [iv].
If this interpretation is correct,
then wave (c) of [iv] will drop back into 16.90 again to complete and then wave [v] should begin.
If we see a break of 17.38 again tomorrow,
that will confirm the alternate count.
Tomorrow;
I have not ruled out the bullish count yet,
a rally up above 18.46 will confirm the bullish interpretation.
Lets just hold fire to see what happens tomorrow.
[/vc_column_text][/vc_column][/vc_row]
[vc_row][vc_column][vc_separator border_width=”5″][/vc_column][/vc_row][vc_row][vc_column][vc_column_text]
S&P 500.
[/vc_column_text][/vc_column][/vc_row][vc_row][vc_column][vc_separator border_width=”5″][/vc_column][/vc_row][vc_row][vc_column width=”2/3″][vc_custom_heading text=”1 hr” use_theme_fonts=”yes”][vc_column_text]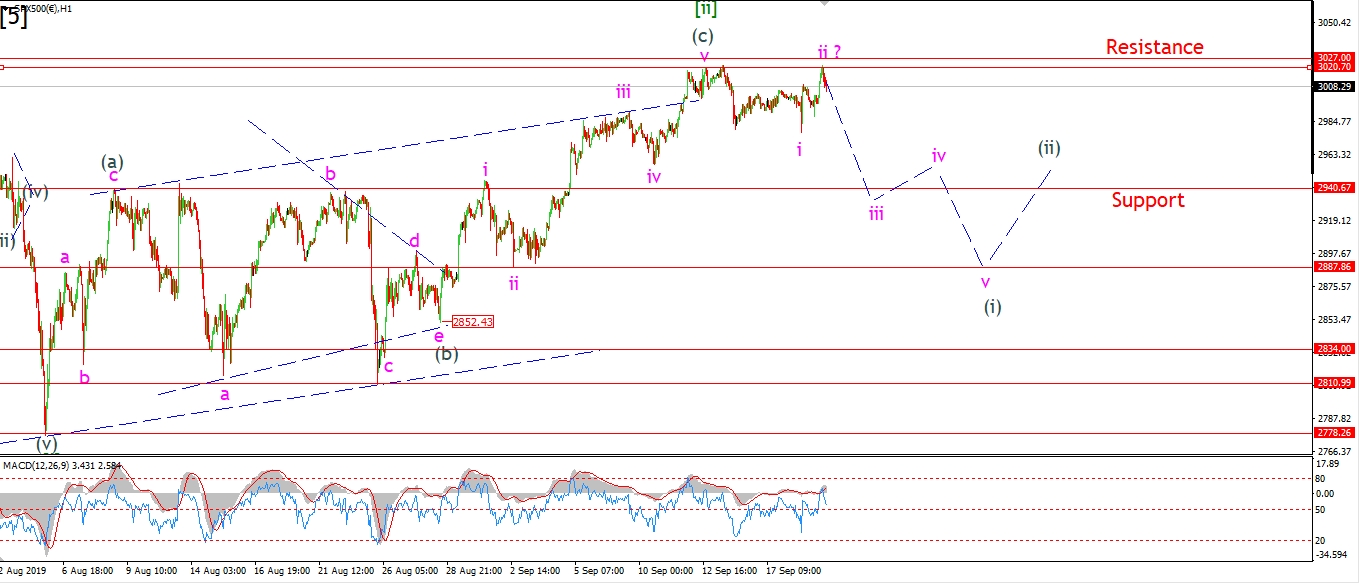 [/vc_column_text][/vc_column][vc_column width=”1/3″][vc_custom_heading text=”4 Hours” use_theme_fonts=”yes”][vc_column_text]
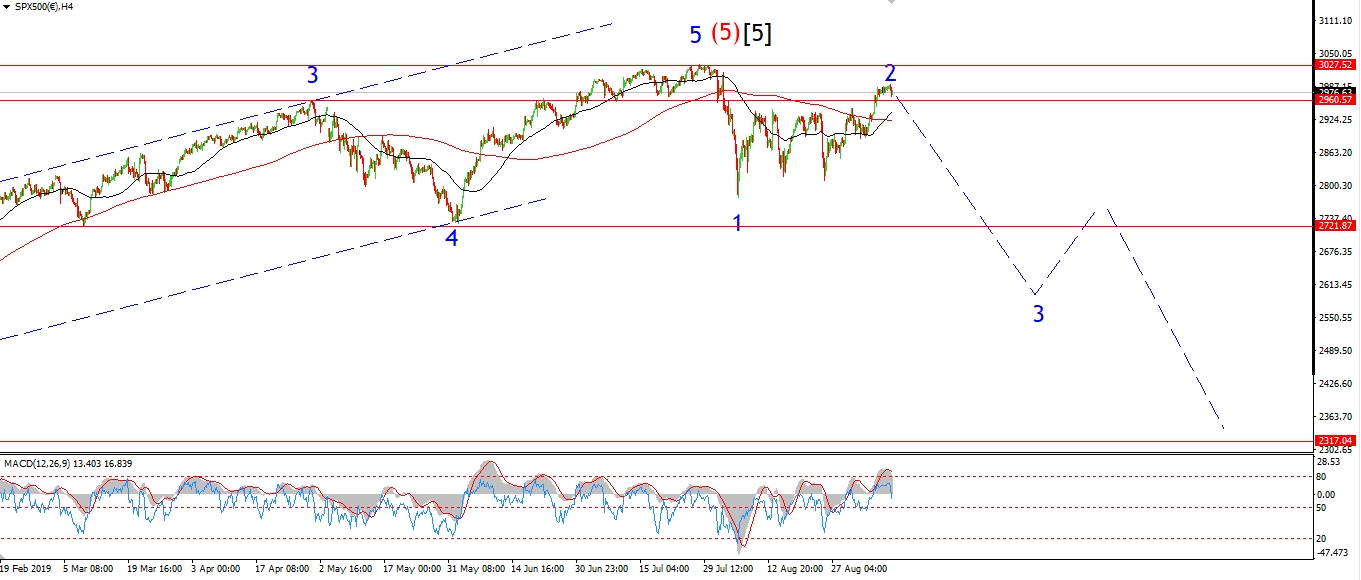 [/vc_column_text][vc_custom_heading text=”Daily” use_theme_fonts=”yes”][vc_column_text]
 [/vc_column_text][/vc_column][/vc_row]
[vc_row][vc_column][vc_column_text]
The S&P is holding below the 3020 high created on the 12th.
I am labeling the decline into last nights lows as wave ‘i’ down.
The rally today has traced out three waves up to a slight lower high in the case market.
This creates a 5/3 decline and a bearish signal.
As I mentioned earlier,
wave ‘iii’ down is overdue now,
so we must get the initial drop in wave ‘iii’ beginning tomorrow.
Any rally above 3020 will invalidate the short term count.
tomorrow;
Watch for 3020 to hold and wave ‘iii’ down to break the wave ‘i’ low.
[/vc_column_text][/vc_column][/vc_row]
[vc_row][vc_column][vc_separator border_width=”5″][/vc_column][/vc_row]