
[vc_row][vc_column][vc_separator border_width=”5″][/vc_column][/vc_row]
[vc_row][vc_column][vc_column_text]
Good evening all.
[/vc_column_text][/vc_column][/vc_row]
[vc_row][vc_column][vc_separator border_width=”5″][/vc_column][/vc_row]
[vc_row][vc_column][vc_column_text]
EURUSD
[/vc_column_text][/vc_column][/vc_row]
[vc_row][vc_column][vc_separator border_width=”5″][/vc_column][/vc_row][vc_row][vc_column width=”2/3″][vc_custom_heading text=”1 hr” use_theme_fonts=”yes”][vc_column_text]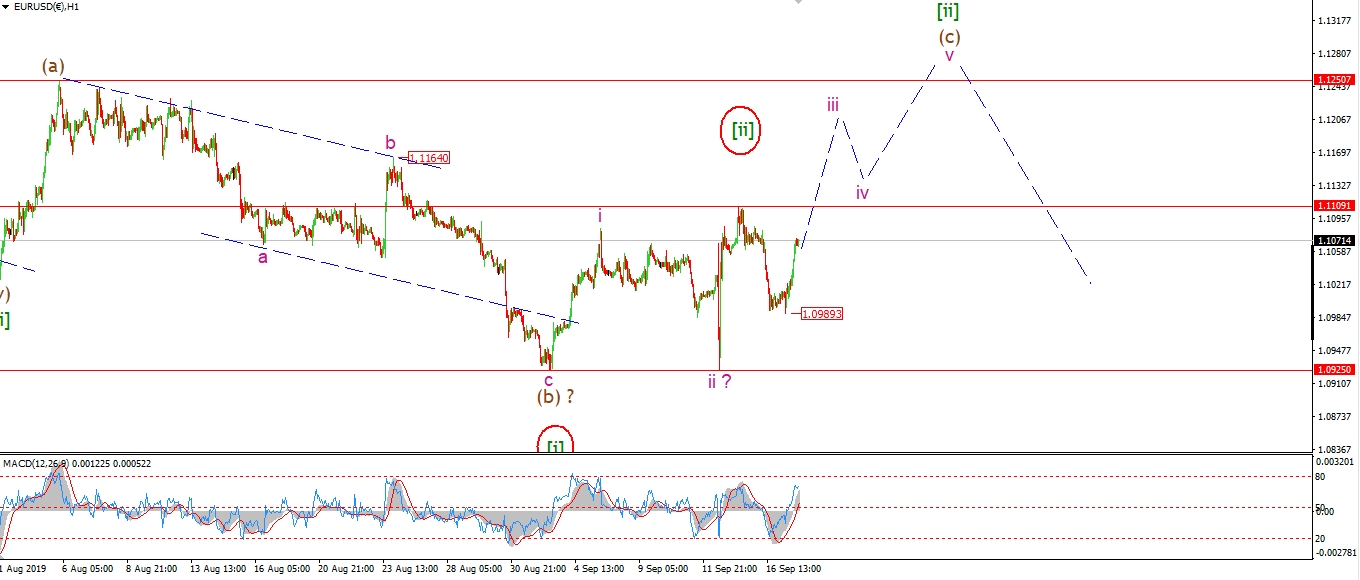 [/vc_column_text][/vc_column][vc_column width=”1/3″][vc_custom_heading text=”4 Hours” use_theme_fonts=”yes”][vc_column_text]
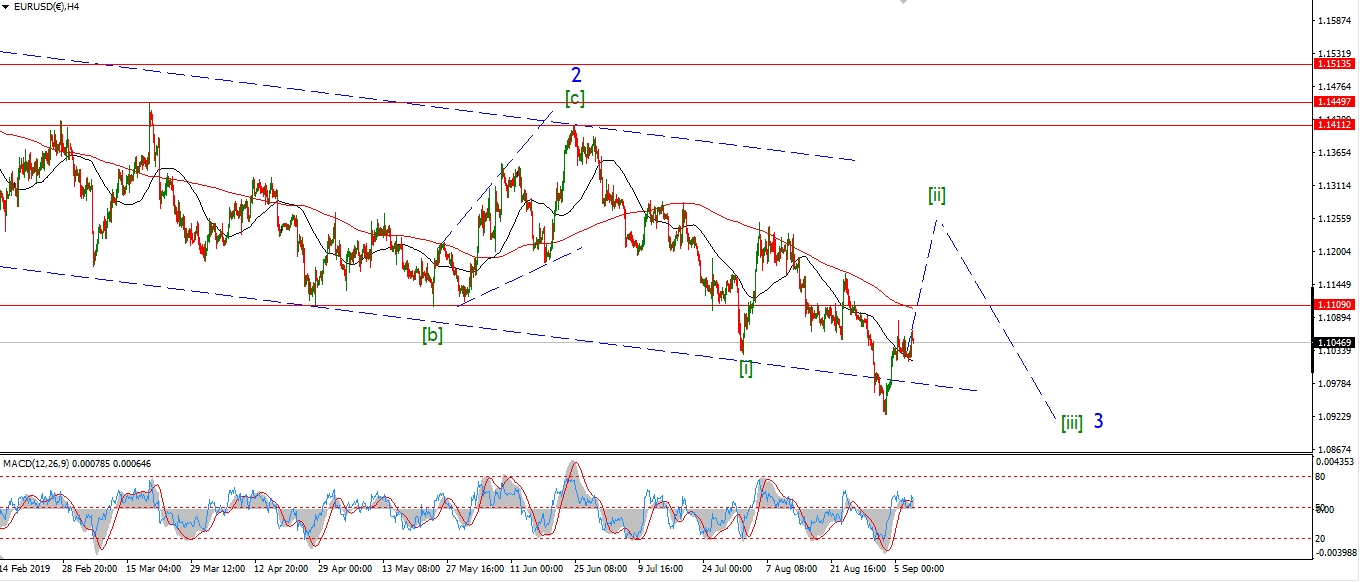 [/vc_column_text][vc_custom_heading text=”Daily” use_theme_fonts=”yes”][vc_column_text]
 [/vc_column_text][/vc_column][/vc_row]
[vc_row][vc_column][vc_column_text]
EURUSD has pushed higher today back into wave ‘iii’ up.
The price has not broken 1.1109 yet to confirm the short term count,
but the move is nice and impulsive looking,
so wave ‘iii’ up should continue higher tomorrow.
Mondays low at 1.0989 should hold now as wave ‘iii’ continues and any corrective action must stay above that level.
Tomorrow;
watch for wave ‘iii’ of (c) to push higher and complete at about 1.1200.
we should see a clear five wave pattern develop.
[/vc_column_text][/vc_column][/vc_row]
[vc_row][vc_column][vc_separator border_width=”5″][/vc_column][/vc_row][vc_row][vc_column][vc_column_text]
GBPUSD
[/vc_column_text][/vc_column][/vc_row][vc_row][vc_column][vc_separator border_width=”5″][/vc_column][/vc_row][vc_row][vc_column width=”2/3″][vc_custom_heading text=”1 hr” use_theme_fonts=”yes”][vc_column_text]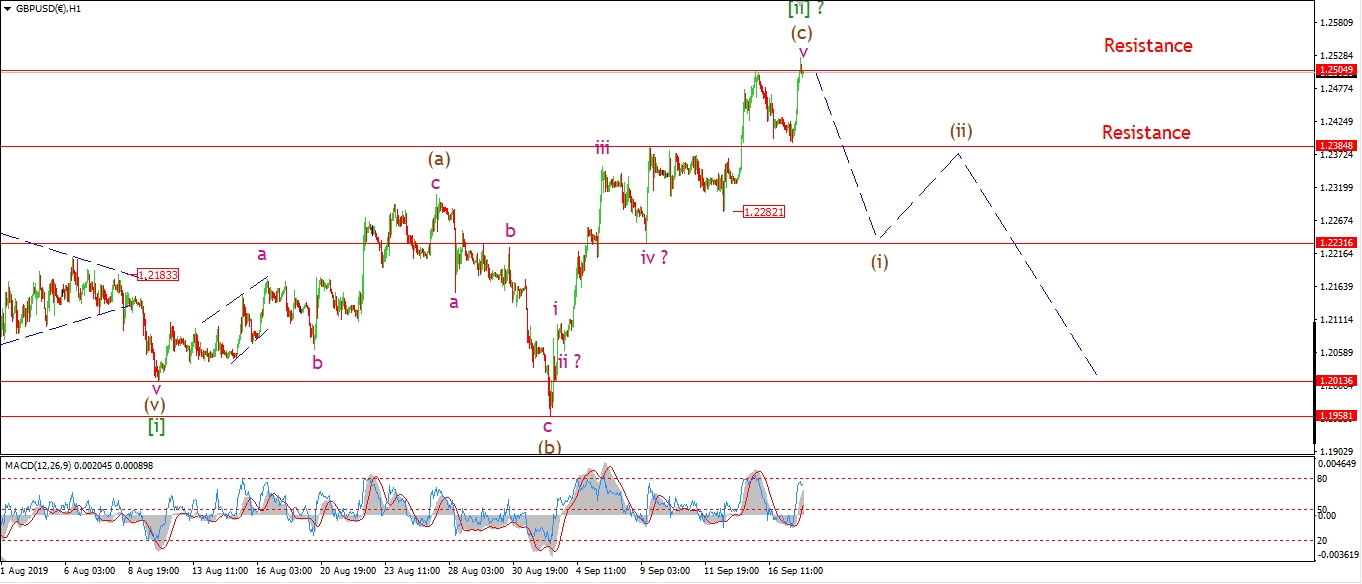 [/vc_column_text][/vc_column][vc_column width=”1/3″][vc_custom_heading text=”4 Hours” use_theme_fonts=”yes”][vc_column_text]
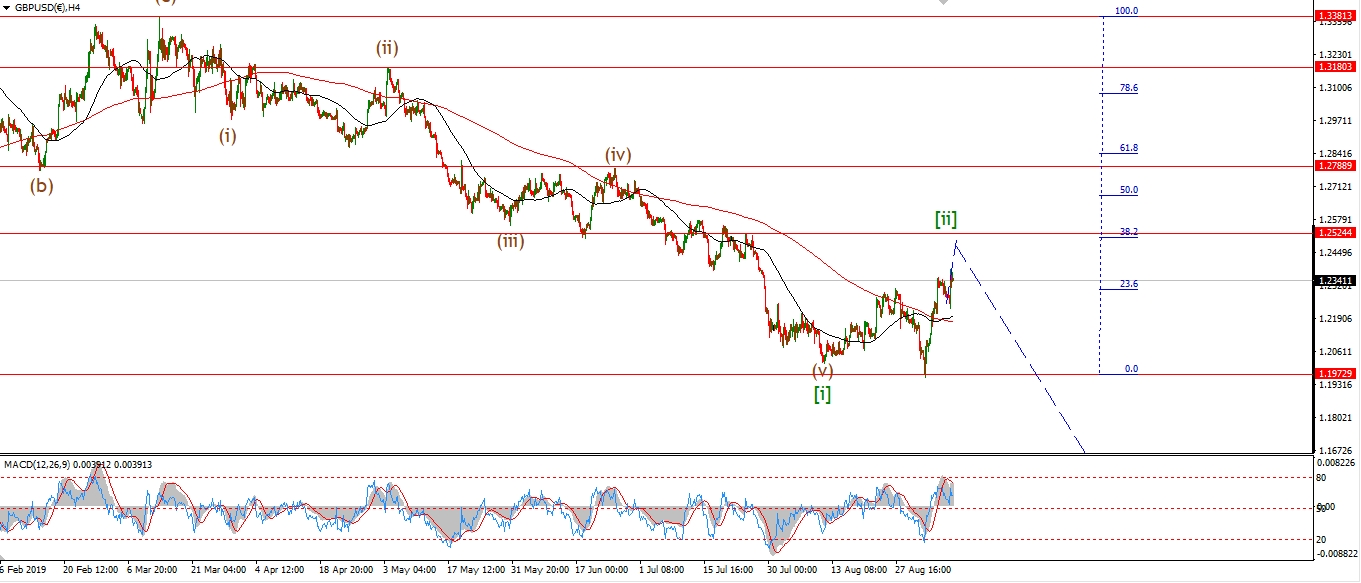 [/vc_column_text][vc_custom_heading text=”Daily” use_theme_fonts=”yes”][vc_column_text]
 [/vc_column_text][/vc_column][/vc_row]
[vc_row][vc_column][vc_column_text]
Cable seems to have extended higher in wave ‘v’ of (c).
The internal pattern within wave ‘v’
still counts as five waves in a few different configurations.
Tonight I have shown the low of 1.2231 as wave ‘iv’,
so a break of this level will confirm the turn down into wave (i).
Tomorrow;
Watch for a top to form in wave (c) finally.
Wave (i) down should begin soon.
A break of 1.2384 should signal the top is in for wave (c).
[/vc_column_text][/vc_column][/vc_row]
[vc_row][vc_column][vc_separator border_width=”5″][/vc_column][/vc_row][vc_row][vc_column][vc_column_text]
USDJPY
[/vc_column_text][/vc_column][/vc_row][vc_row][vc_column][vc_separator border_width=”5″][/vc_column][/vc_row][vc_row][vc_column width=”2/3″][vc_custom_heading text=”1 hr” use_theme_fonts=”yes”][vc_column_text]
[/vc_column_text][/vc_column][vc_column width=”1/3″][vc_custom_heading text=”4 Hours” use_theme_fonts=”yes”][vc_column_text]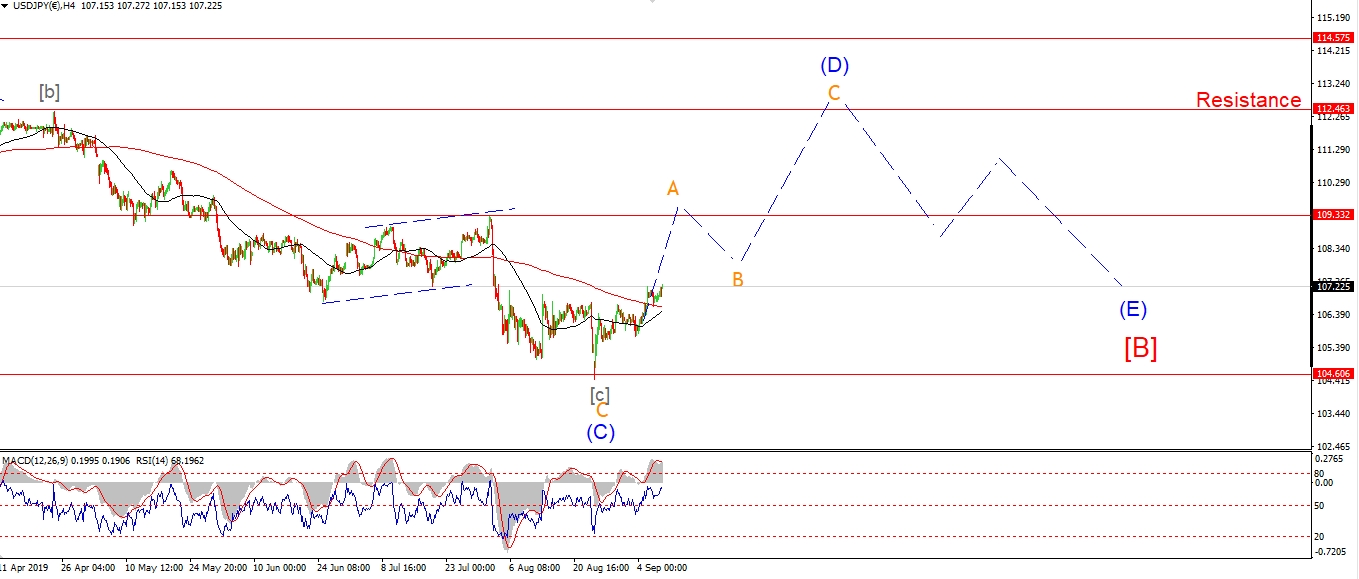 [/vc_column_text][vc_custom_heading text=”Daily” use_theme_fonts=”yes”][vc_column_text]
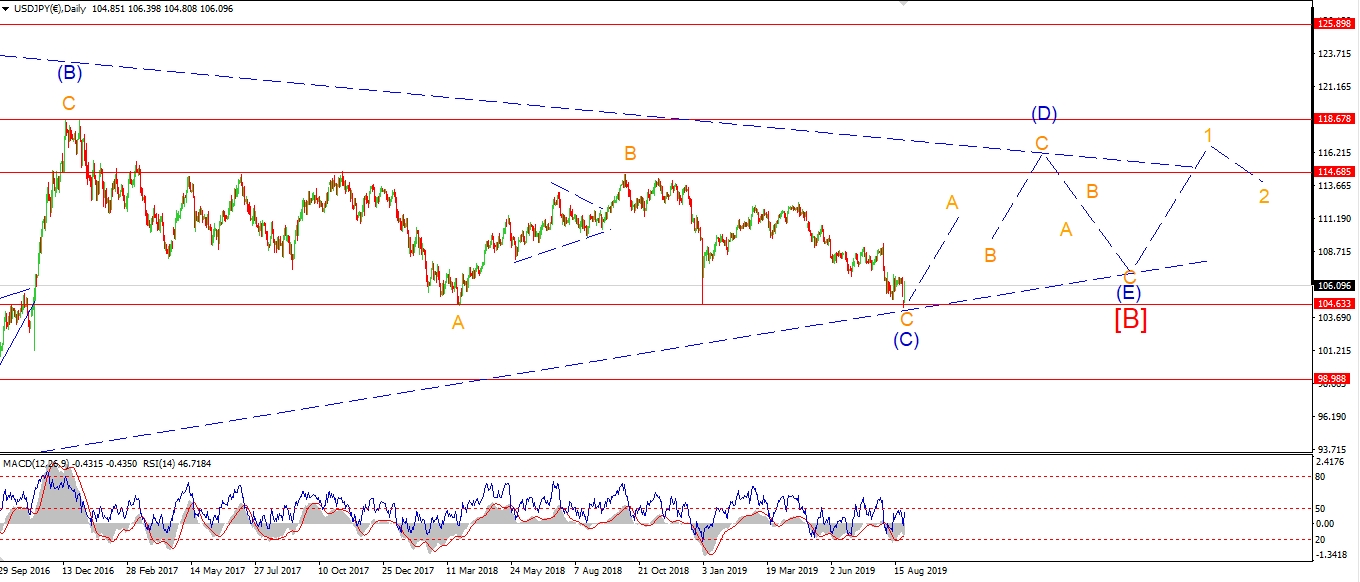 [/vc_column_text][/vc_column][/vc_row]
[vc_row][vc_column][vc_column_text]
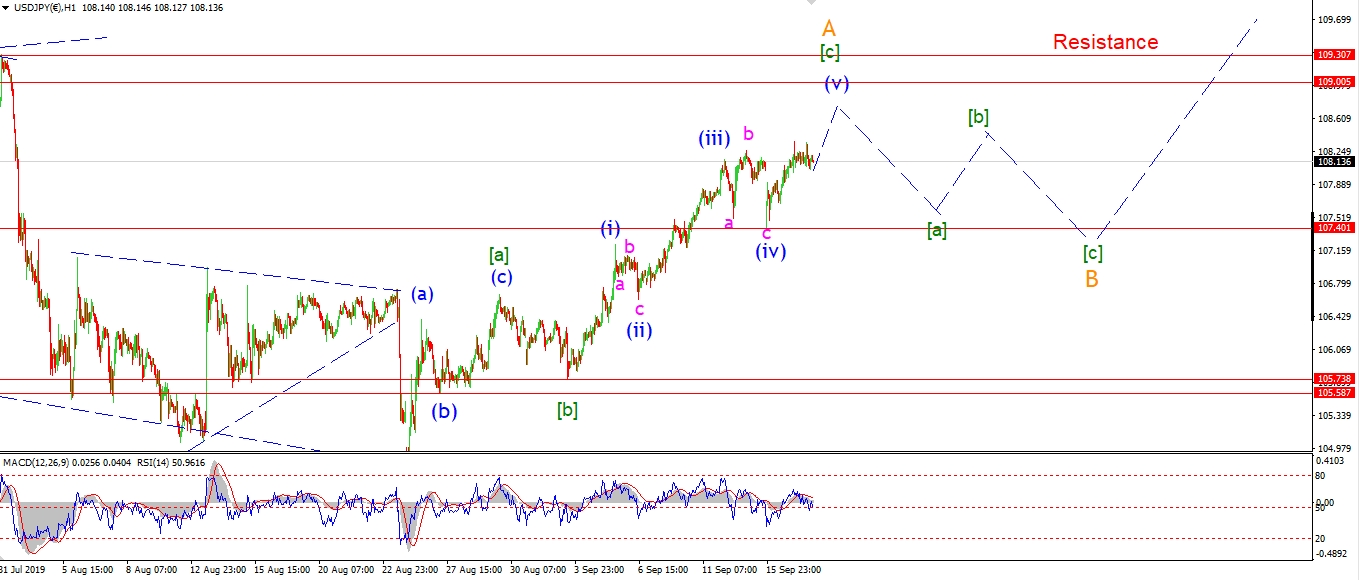
After a choppy trade USDJPY did break the wave ‘b’ high created last Friday.
The action off that high today is corrective looking,
so I think we could see another pop to the upside overnight.
This will complete a better formed wave (v) blue.
A new high near the 109.00 area will bring this rally in wave ‘A’ to a conclusion.
Tomorrow;
Watch for wave (v) to complete at or near the 109.00 resistance.
then we can look lower into wave ‘B’.
[/vc_column_text][/vc_column][/vc_row]
[vc_row][vc_column][vc_separator border_width=”5″][/vc_column][/vc_row][vc_row][vc_column][vc_column_text]
DOW JONES INDUSTRIALS
[/vc_column_text][/vc_column][/vc_row][vc_row][vc_column][vc_separator border_width=”5″][/vc_column][/vc_row][vc_row][vc_column width=”2/3″][vc_custom_heading text=”1 hr” use_theme_fonts=”yes”][vc_column_text]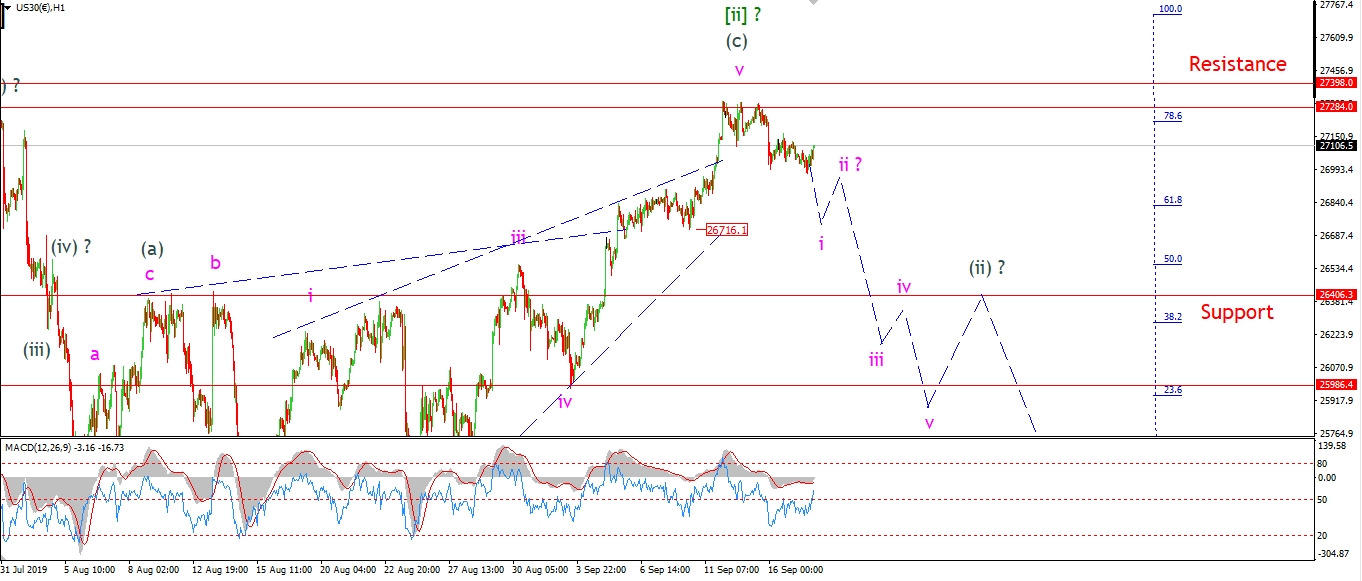 [/vc_column_text][/vc_column][vc_column width=”1/3″][vc_custom_heading text=”4 Hours” use_theme_fonts=”yes”][vc_column_text]
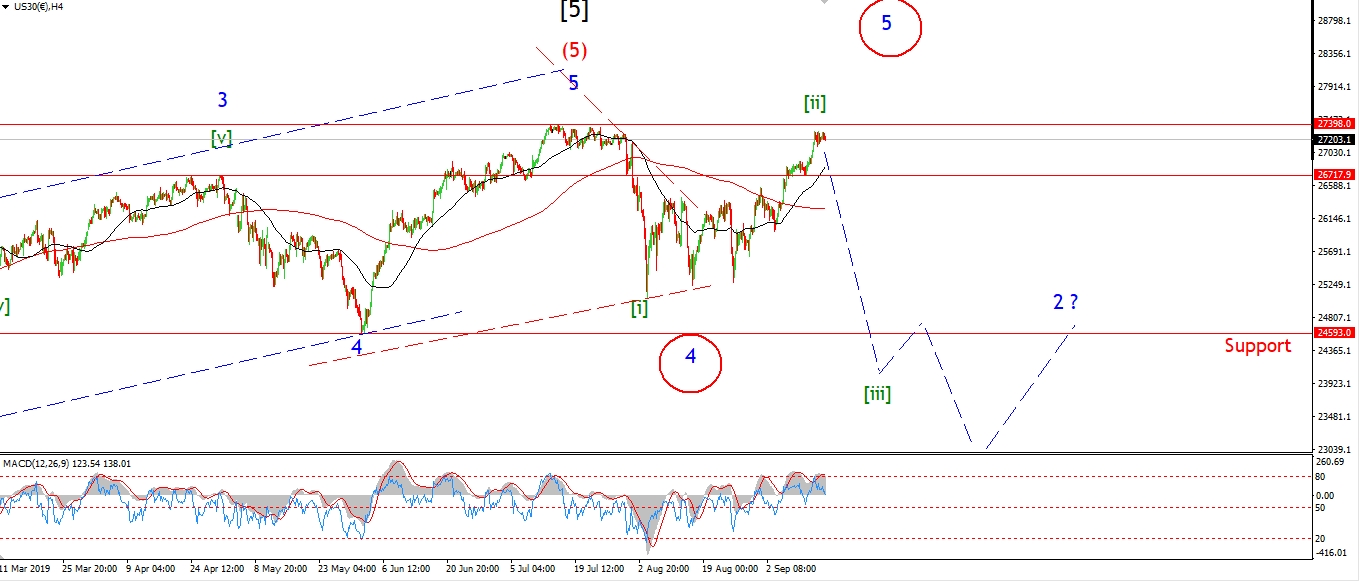 [/vc_column_text][vc_custom_heading text=”Daily” use_theme_fonts=”yes”][vc_column_text]
 [/vc_column_text][/vc_column][/vc_row]
[vc_row][vc_column][vc_column_text]
The decline off the high in the DOW has stalled today,
It is unclear whether wave ‘i’ down is complete at todays low,
or if todays sideways grind is a correction within wave ‘i’.
Tomorrow will tell.
If we see another spike lower towards 26700 ,
that should conclude wave ‘i’ down and then I will look for a lower high in wave ‘ii’ as shown.
This wave count is still very close to the edge at the moment,
and only a sharp move back below 26400 will re-affirm the bearish idea fully.
Tomorrow;
Watch for wave ‘i’ down to complete with one more spike lower towards 26700.
[/vc_column_text][/vc_column][/vc_row]
[vc_row][vc_column][vc_separator border_width=”5″][/vc_column][/vc_row][vc_row][vc_column][vc_column_text]
GOLD
[/vc_column_text][/vc_column][/vc_row][vc_row][vc_column][vc_separator border_width=”5″][/vc_column][/vc_row][vc_row][vc_column width=”2/3″][vc_custom_heading text=”1 hr” use_theme_fonts=”yes”][vc_column_text]
 [/vc_column_text][/vc_column][vc_column width=”1/3″][vc_custom_heading text=”4 Hours” use_theme_fonts=”yes”][vc_column_text]
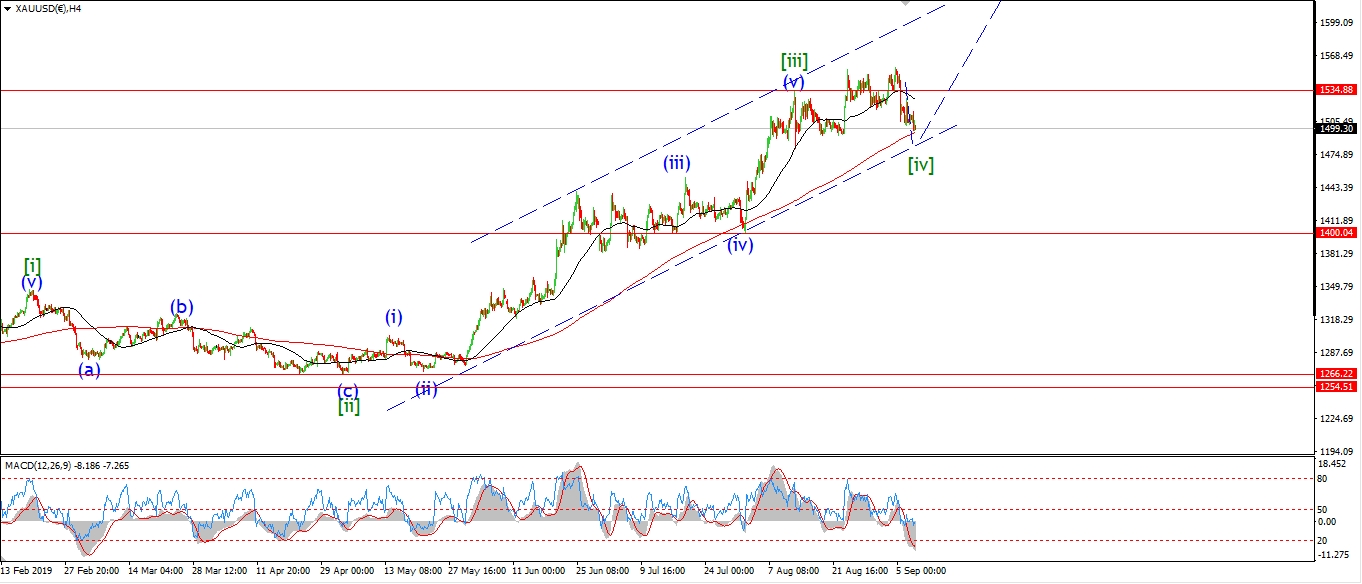 [/vc_column_text][vc_custom_heading text=”Daily” use_theme_fonts=”yes”][vc_column_text]
 [/vc_column_text][/vc_column][/vc_row]
[vc_row][vc_column][vc_column_text]
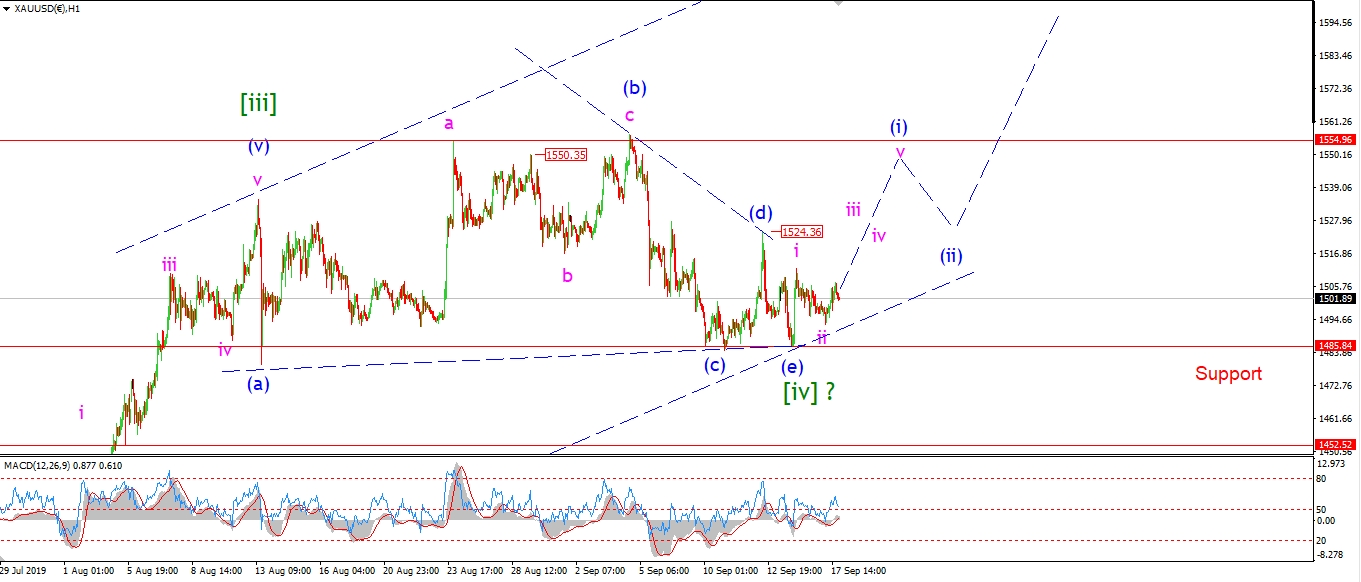
The action in gold today has neither confirmed the bullish count nor ruled it out.
I will have to see a move back above 1524 again at wave (d)
to really settle the bullish count and confirm the large triangle wave [iv].
Wave [v] up should start with the formation of a bullish higher low above 1485
in waves (i) and (ii) as shown.
For tomorrow;
Watch for 1485 to hold.
Wave ‘iii’ of (i) should break 1524.
[/vc_column_text][/vc_column][/vc_row]
[vc_row][vc_column][vc_separator border_width=”5″][/vc_column][/vc_row][vc_row][vc_column][vc_column_text]
U.S CRUDE OIL
[/vc_column_text][/vc_column][/vc_row][vc_row][vc_column][vc_separator border_width=”5″][/vc_column][/vc_row][vc_row][vc_column width=”2/3″][vc_custom_heading text=”1 hr” use_theme_fonts=”yes”][vc_column_text]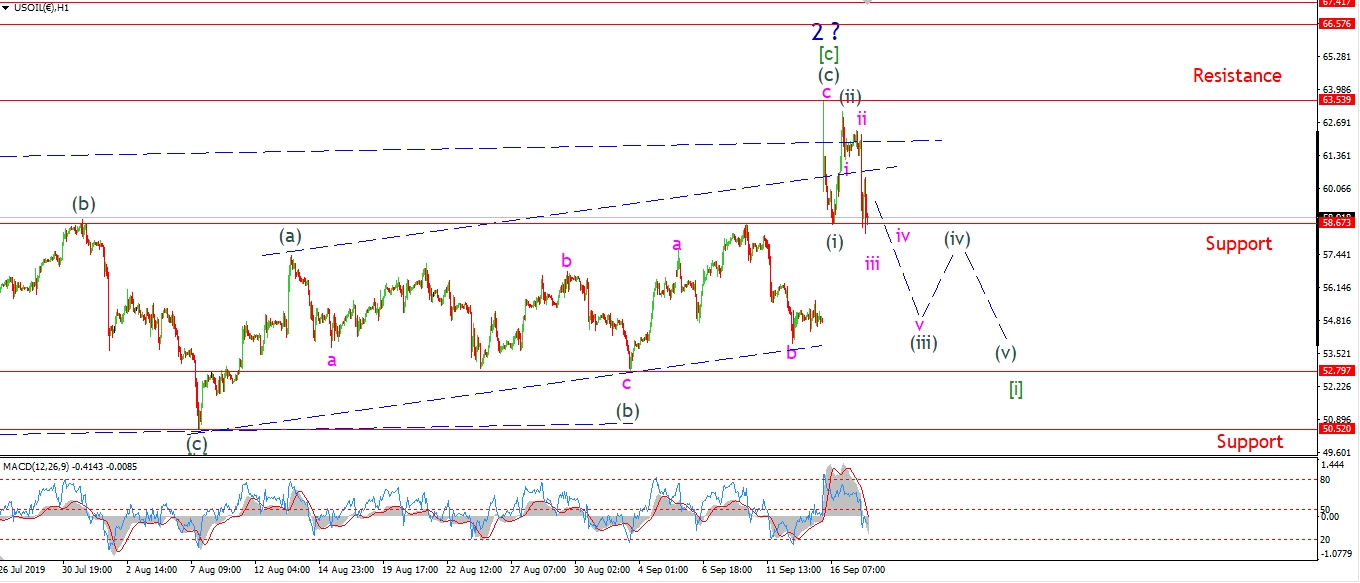 [/vc_column_text][/vc_column][vc_column width=”1/3″][vc_custom_heading text=”4 Hours” use_theme_fonts=”yes”][vc_column_text]
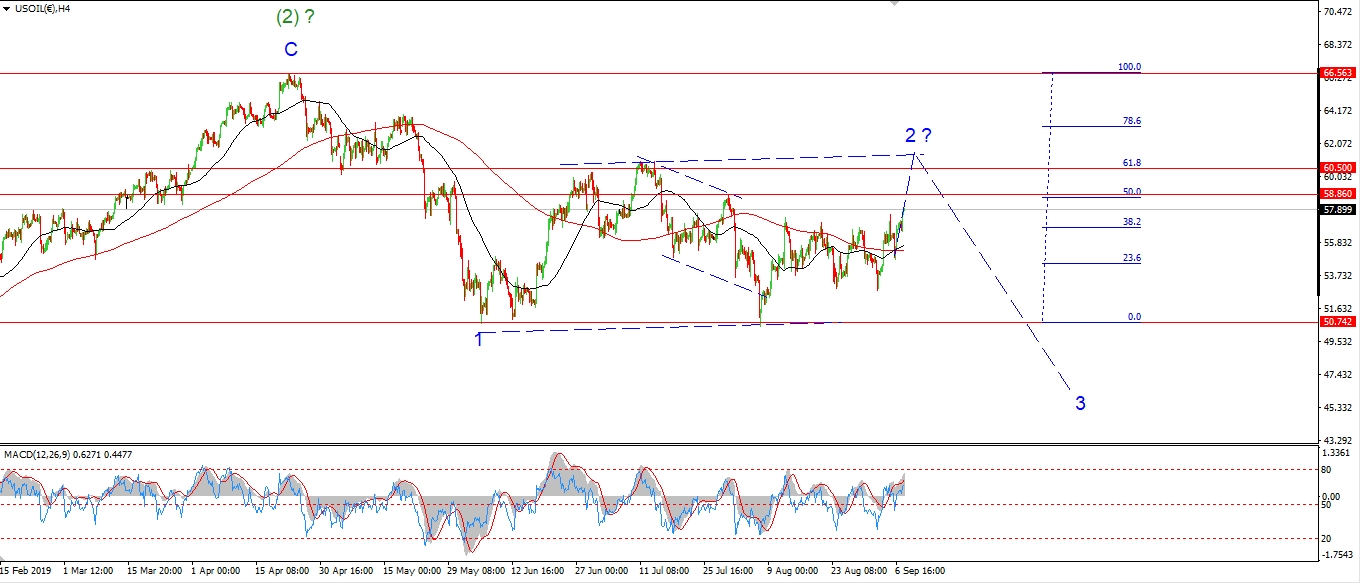 [/vc_column_text][vc_custom_heading text=”Daily” use_theme_fonts=”yes”][vc_column_text]
 [/vc_column_text][/vc_column][/vc_row]
[vc_row][vc_column][vc_column_text]
Crude has dropped sharply off the lower high wave (ii) today.
This action is viewed as wave (iii) of [i] now.
So far the decline has only created a three wave pattern off the high,
which can still suggest a correction.
This decline must continue lower for the rest of the week to confirm that wave [i] down is in play.
The price is hanging at the lows of the session as I write,
so we are on the right track so far.
Tomorrow;
I have labelled todays drop as wave ‘iii’ of (iii).
Wave ‘iii’ should continue lower tomorrow,
and then wave ‘iv’ should consolidate below 58.00 again.
[/vc_column_text][/vc_column][/vc_row]
[vc_row][vc_column][vc_separator border_width=”5″][/vc_column][/vc_row][vc_row][vc_column][vc_column_text]
US 10 yr Treasuries.
[/vc_column_text][/vc_column][/vc_row][vc_row][vc_column][vc_separator border_width=”5″][/vc_column][/vc_row][vc_row][vc_column width=”2/3″][vc_custom_heading text=”1 hr” use_theme_fonts=”yes”][vc_column_text]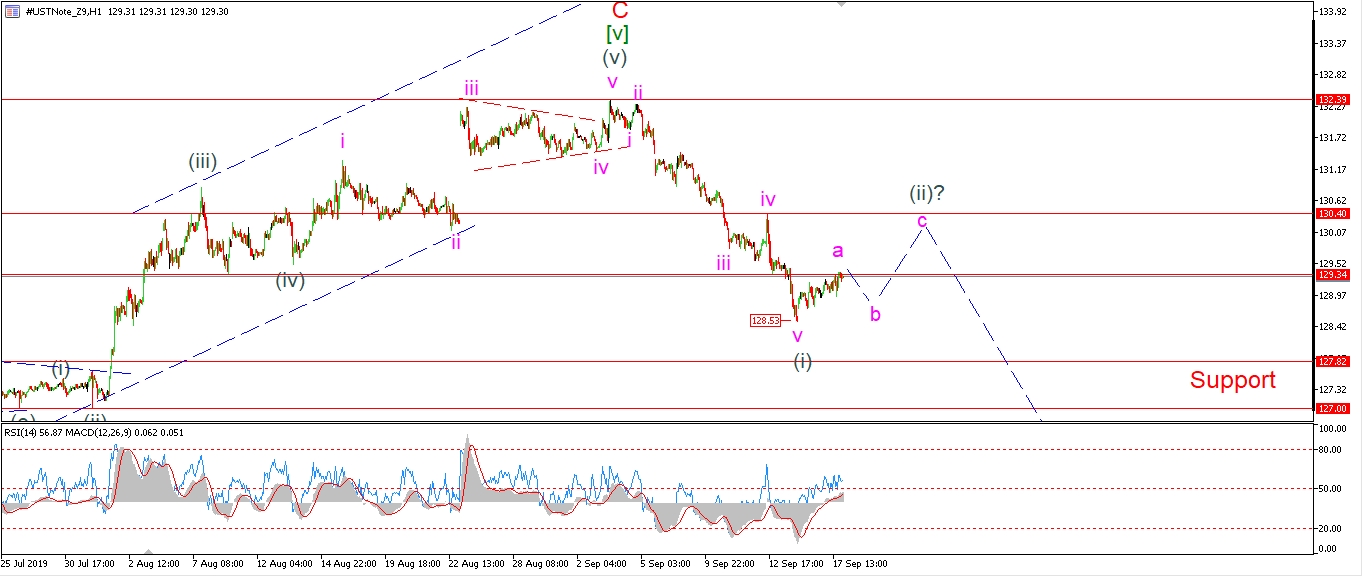 [/vc_column_text][/vc_column][vc_column width=”1/3″][vc_custom_heading text=”4 Hours” use_theme_fonts=”yes”][vc_column_text]
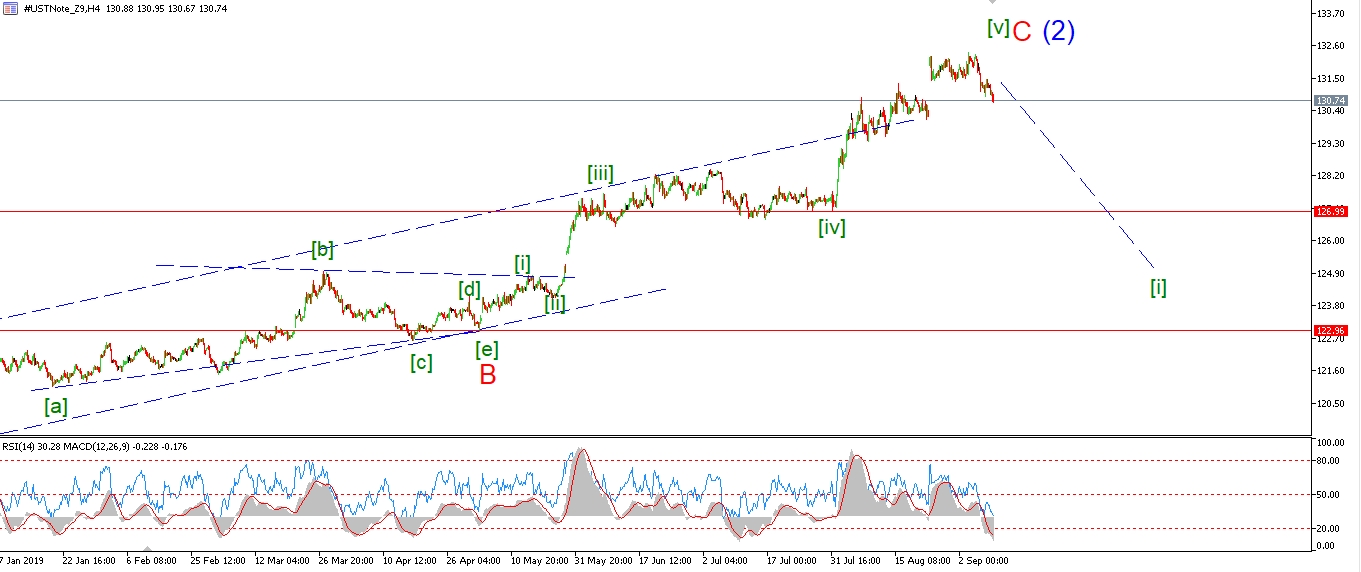 [/vc_column_text][vc_custom_heading text=”Daily” use_theme_fonts=”yes”][vc_column_text]
 [/vc_column_text][/vc_column][/vc_row]
[vc_row][vc_column][vc_column_text]
It is possible that wave (ii) has begun off Fridays lows,
but the action is a little unconvincing just yet.
I have shown todays rise as wave ‘a’ of (ii),
with waves ‘b’ and ‘c’ expected to grind higher over the coming days.
The target for wave (ii) lies at the previous fourth wave at 130.40.
And once that correction higher completes,
we will have a bearish impulsive pattern in place off the high.
Tomorrow;
Watch for wave ‘b’ of (ii) to hold above the wave (i) high at 128.53.
[/vc_column_text][/vc_column][/vc_row]
[vc_row][vc_column][vc_separator border_width=”5″][/vc_column][/vc_row][vc_row][vc_column][vc_column_text]
SILVER
[/vc_column_text][/vc_column][/vc_row][vc_row][vc_column][vc_separator border_width=”5″][/vc_column][/vc_row][vc_row][vc_column width=”2/3″][vc_custom_heading text=”1 hr” use_theme_fonts=”yes”][vc_column_text]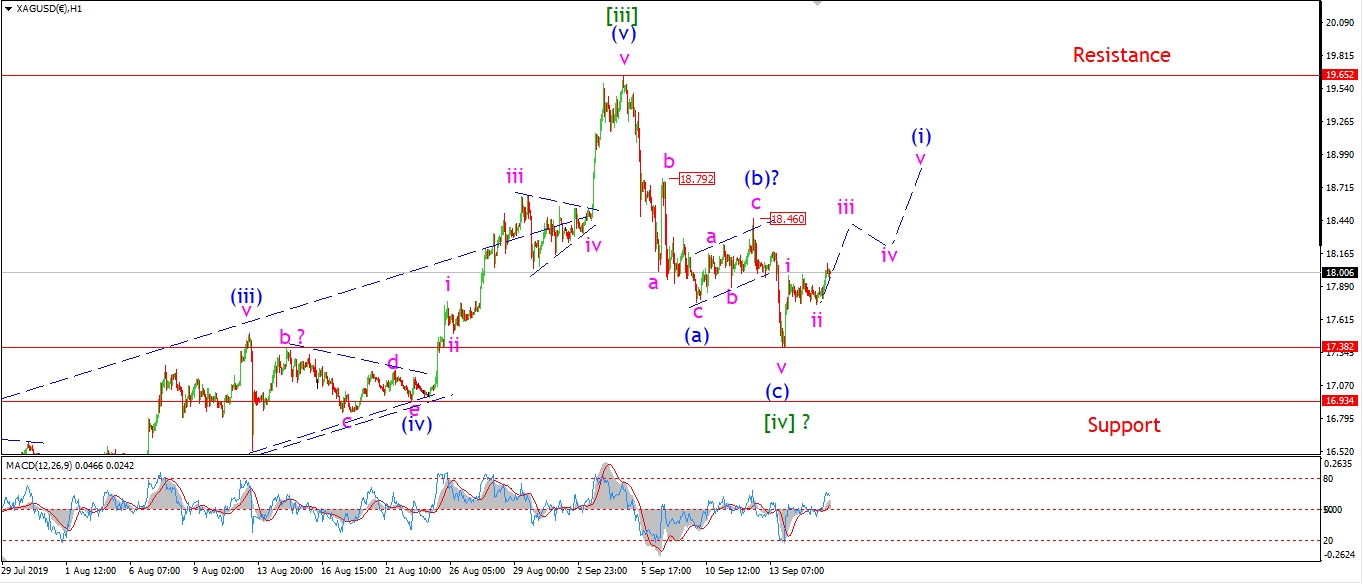 [/vc_column_text][/vc_column][vc_column width=”1/3″][vc_custom_heading text=”4 Hours” use_theme_fonts=”yes”][vc_column_text]
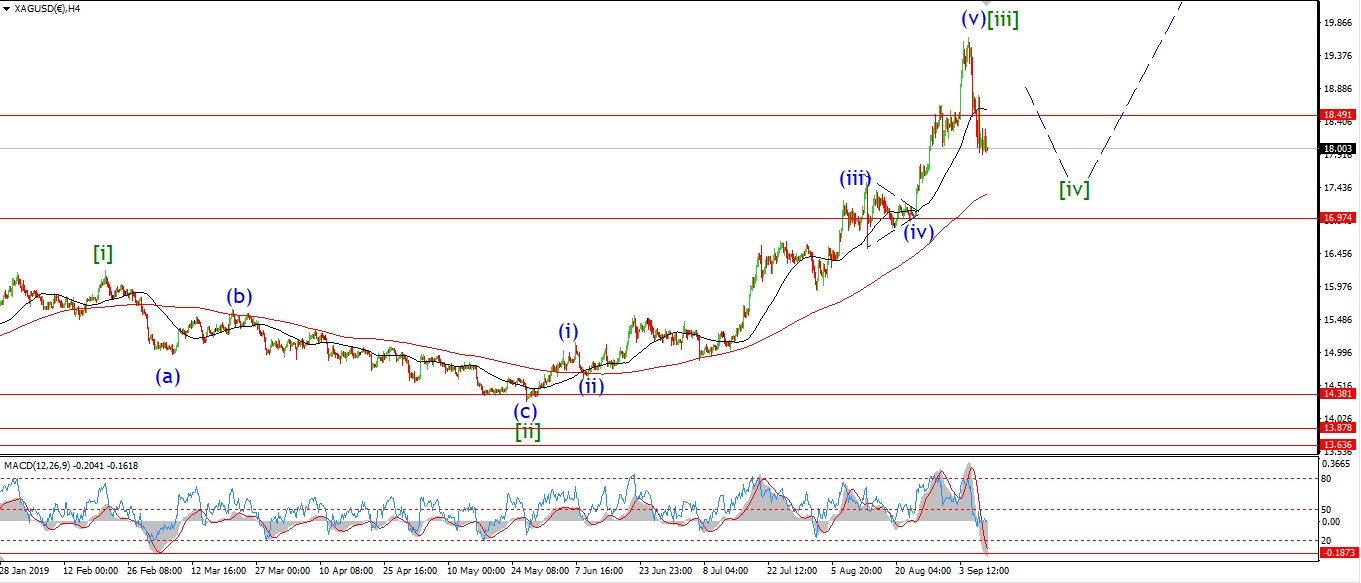 [/vc_column_text][vc_custom_heading text=”Daily” use_theme_fonts=”yes”][vc_column_text]
 [/vc_column_text][/vc_column][/vc_row]
[vc_row][vc_column][vc_column_text]
Silver is looking reasonably positive again,
as the price moved higher off the 17.40 low again today.
This rise can be viewed as wave ‘iii’ of (i) as shown.
I will need to see a sharp move higher tomorrow
back towards 18.46 again to confirm that short term count.
The main argument against the bullish count now is this,
wave [iv] has been relatively short in comparison to wave [ii].
This does suggest that wave [iv] should continue and develop into a larger structure.
We will just have to let the price action sort this problem out over the coming week.
Tomorrow;
Watch for wave ‘iii’ of (i) to continue higher.
17.40 must hold.
[/vc_column_text][/vc_column][/vc_row]
[vc_row][vc_column][vc_separator border_width=”5″][/vc_column][/vc_row][vc_row][vc_column][vc_column_text]
S&P 500.
[/vc_column_text][/vc_column][/vc_row][vc_row][vc_column][vc_separator border_width=”5″][/vc_column][/vc_row][vc_row][vc_column width=”2/3″][vc_custom_heading text=”1 hr” use_theme_fonts=”yes”][vc_column_text]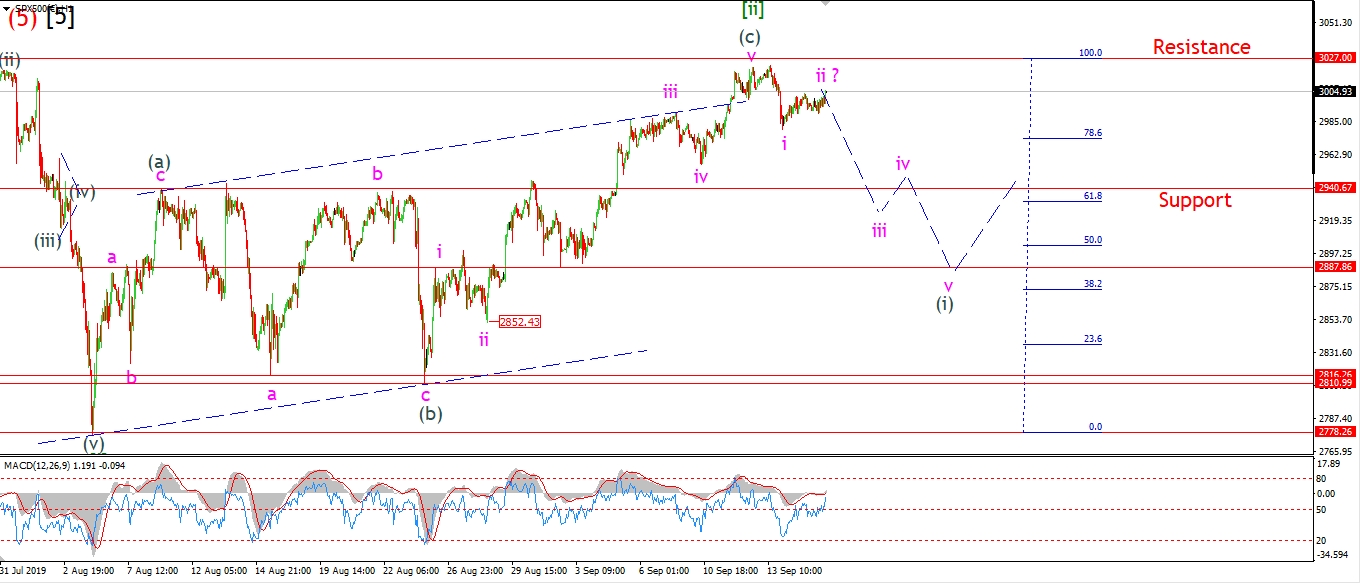 [/vc_column_text][/vc_column][vc_column width=”1/3″][vc_custom_heading text=”4 Hours” use_theme_fonts=”yes”][vc_column_text]
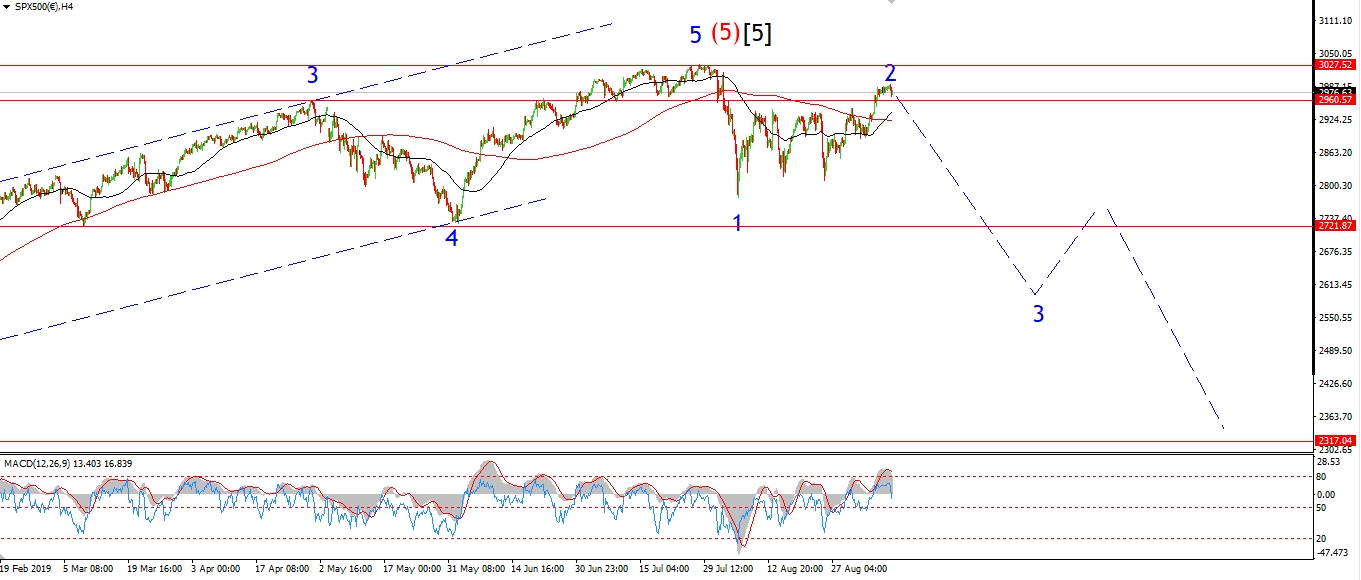 [/vc_column_text][vc_custom_heading text=”Daily” use_theme_fonts=”yes”][vc_column_text]
 [/vc_column_text][/vc_column][/vc_row]
[vc_row][vc_column][vc_column_text]
The S&P is holding below Fridays high so far today.
The action looks corrective and has drifted sideways in a very sluggish trade.
This does count as a possible wave ‘ii’ in place now,
and it suggests a decline in wave ‘iii’ to begin tomorrow.
I would like to see wave ‘iii’ break that all important 2940 level as shown.
That type of decline would just be enough
to tilt the odd’s back in favor of the bearish count again.
Tomorrow;
Watch for wave ‘ii’ to hold below Fridays high again,
a sharp move lower will signal wave ‘iii’ has begun.
[/vc_column_text][/vc_column][/vc_row]
[vc_row][vc_column][vc_separator border_width=”5″][/vc_column][/vc_row]