
[vc_row][vc_column][vc_separator border_width=”5″][/vc_column][/vc_row]
[vc_row][vc_column][vc_column_text]
Hi everyone.
[/vc_column_text][/vc_column][/vc_row]
[vc_row][vc_column][vc_separator border_width=”5″][/vc_column][/vc_row]
[vc_row][vc_column][vc_column_text]
EURUSD
[/vc_column_text][/vc_column][/vc_row]
[vc_row][vc_column][vc_separator border_width=”5″][/vc_column][/vc_row][vc_row][vc_column width=”2/3″][vc_custom_heading text=”1 hr” use_theme_fonts=”yes”][vc_column_text]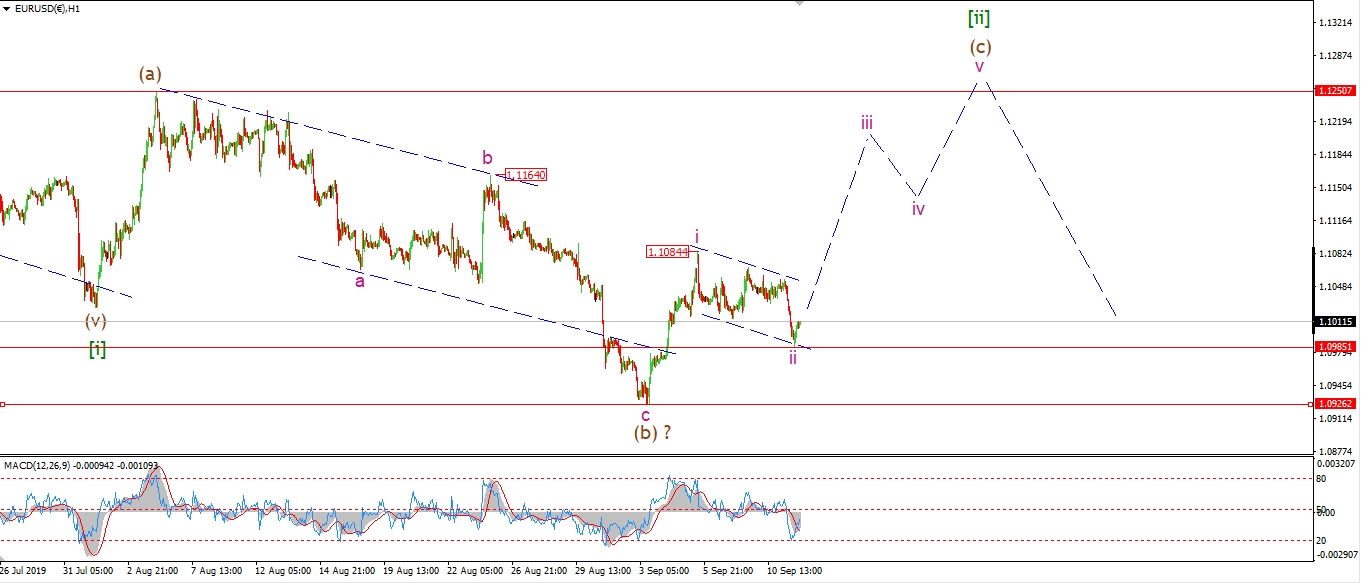 [/vc_column_text][/vc_column][vc_column width=”1/3″][vc_custom_heading text=”4 Hours” use_theme_fonts=”yes”][vc_column_text]
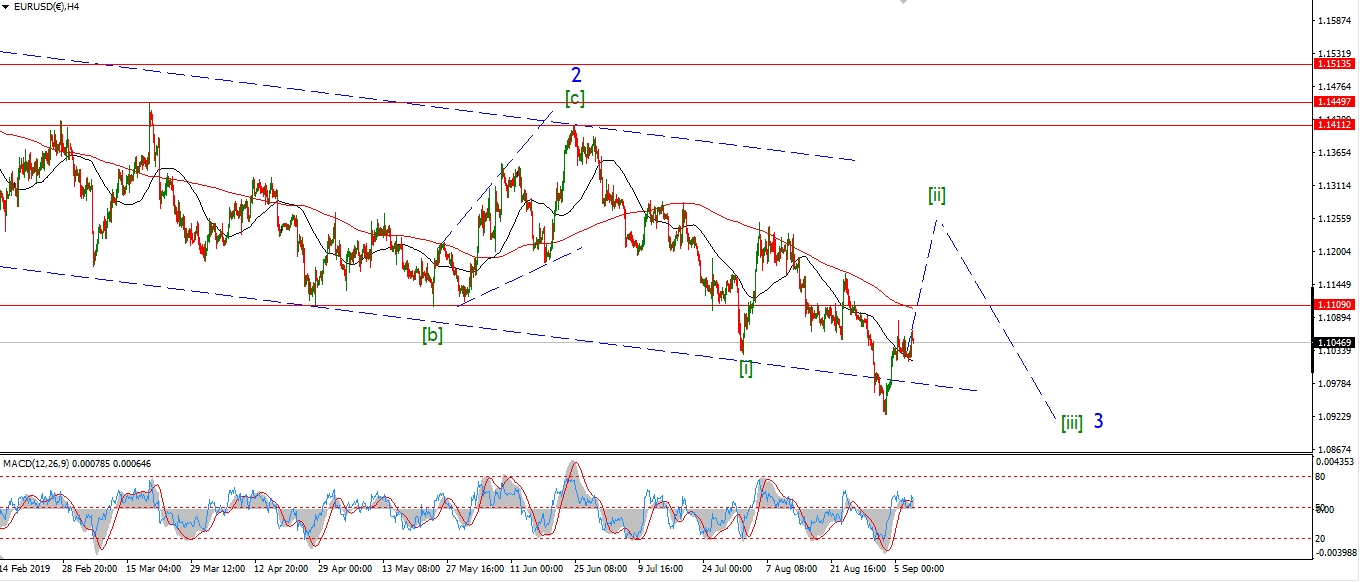 [/vc_column_text][vc_custom_heading text=”Daily” use_theme_fonts=”yes”][vc_column_text]
 [/vc_column_text][/vc_column][/vc_row]
[vc_row][vc_column][vc_column_text]
EURUSD pushed lower to hit the alternate wave ‘ii’ level today with a sharp spike which hit 1.0985 at the low.
The price has filled a trend channel off the wave ‘i’ high,
and the decline is in three waves.
This completes a 5/3 impulse wave to the upside.
So it looks like wave ‘ii’ is now complete at 1.0985,
and we should see wave ‘iii’ begin tomorrow.
A break of 1.1084 again will confirm wave ‘iii’ has begun.
Tomorrow;
Watch for wave ‘iii’ to turn higher again off todays lows.
the low at 1.0926 must hold now in order for this count to remain valid.
[/vc_column_text][/vc_column][/vc_row]
[vc_row][vc_column][vc_separator border_width=”5″][/vc_column][/vc_row][vc_row][vc_column][vc_column_text]
GBPUSD
[/vc_column_text][/vc_column][/vc_row][vc_row][vc_column][vc_separator border_width=”5″][/vc_column][/vc_row][vc_row][vc_column width=”2/3″][vc_custom_heading text=”1 hr” use_theme_fonts=”yes”][vc_column_text]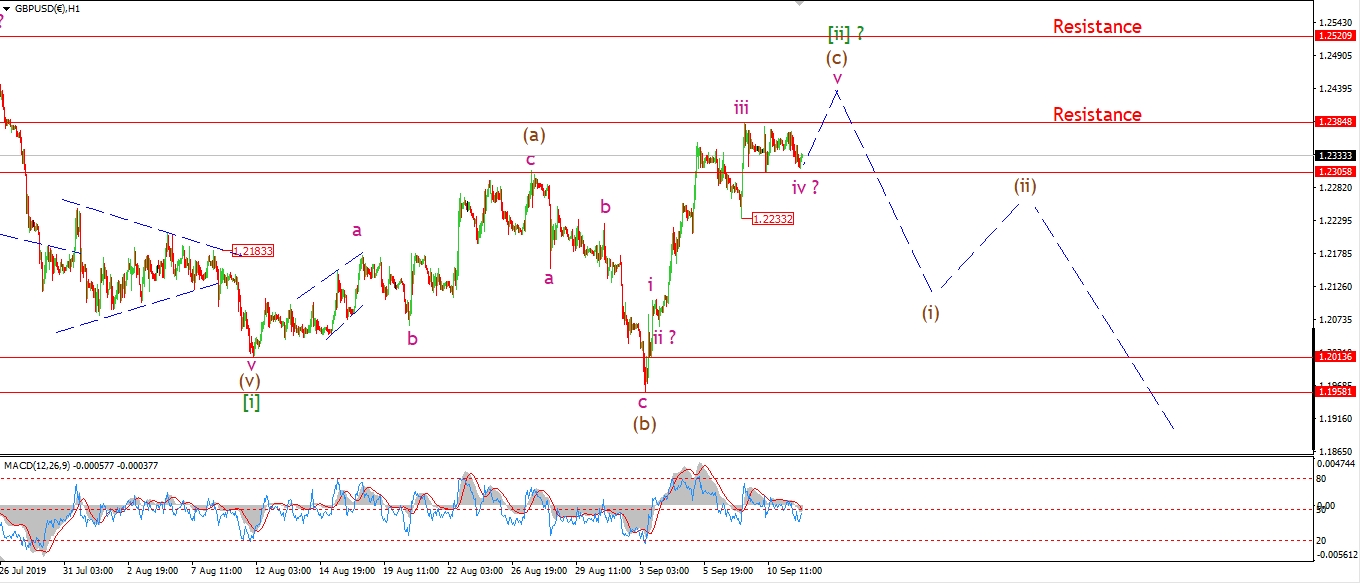 [/vc_column_text][/vc_column][vc_column width=”1/3″][vc_custom_heading text=”4 Hours” use_theme_fonts=”yes”][vc_column_text]
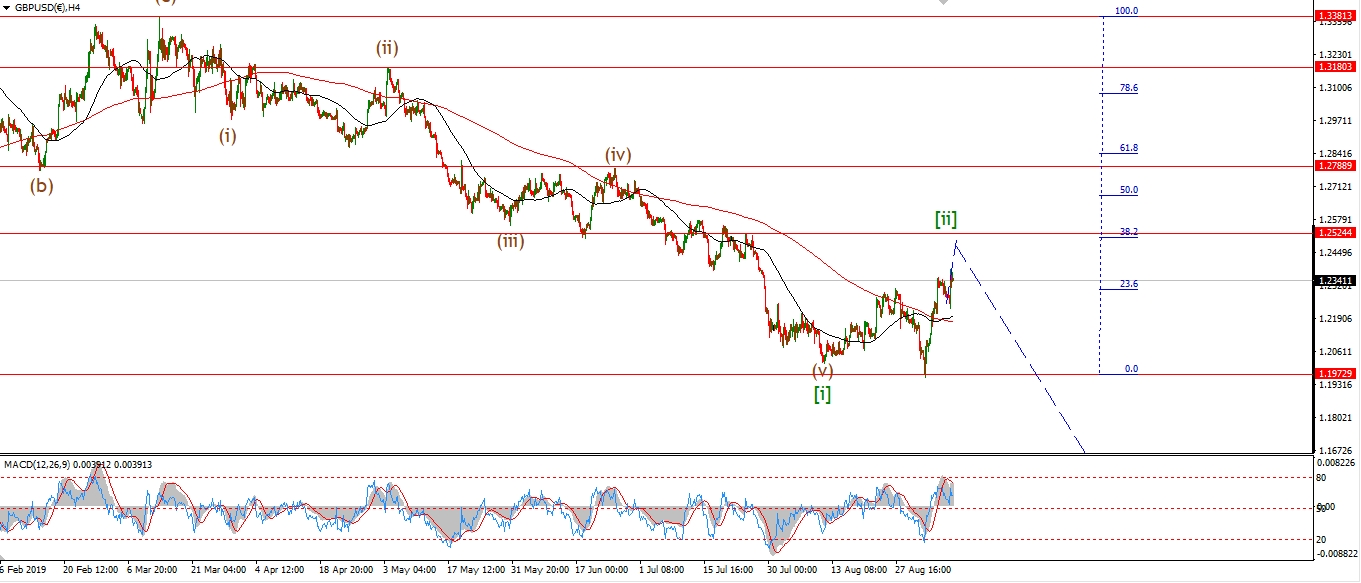 [/vc_column_text][vc_custom_heading text=”Daily” use_theme_fonts=”yes”][vc_column_text]
 [/vc_column_text][/vc_column][/vc_row]
[vc_row][vc_column][vc_column_text]
The sideways action continued today in GBPUSD.
This action is still viewed as corrective at the moment.
And I have shown todays lows as wave ‘iv’ of (c),
with wave ‘v’ due to start tomorrow.
Wave (c) needs another push above 1.2384 now to complete five waves.
With an outside chance that wave ‘v’ will hit resistance at 1.2520.
Once five waves complete,
I will begin to look for a turn lower again to begin wave [iii].
Tomorrow;
Watch for 1.2233 to hold as wave ‘iv’ completes.
Wave ‘v’ should begin early tomorrow.
[/vc_column_text][/vc_column][/vc_row]
[vc_row][vc_column][vc_separator border_width=”5″][/vc_column][/vc_row][vc_row][vc_column][vc_column_text]
USDJPY
[/vc_column_text][/vc_column][/vc_row][vc_row][vc_column][vc_separator border_width=”5″][/vc_column][/vc_row][vc_row][vc_column width=”2/3″][vc_custom_heading text=”1 hr” use_theme_fonts=”yes”][vc_column_text]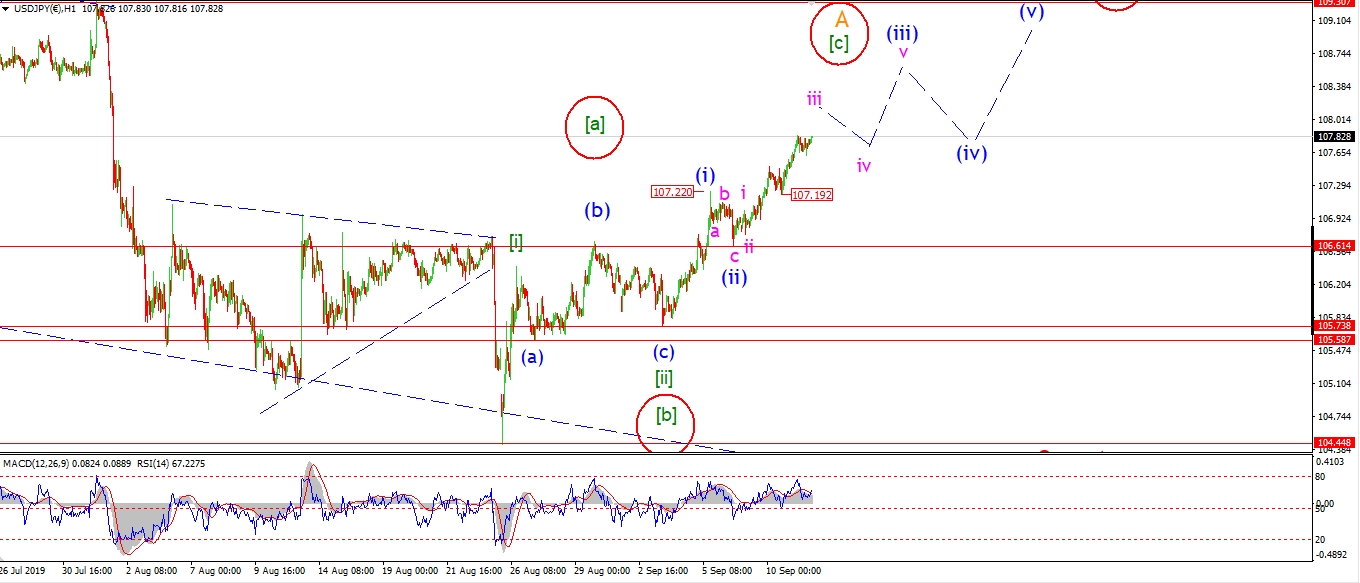 [/vc_column_text][/vc_column][vc_column width=”1/3″][vc_custom_heading text=”4 Hours” use_theme_fonts=”yes”][vc_column_text]
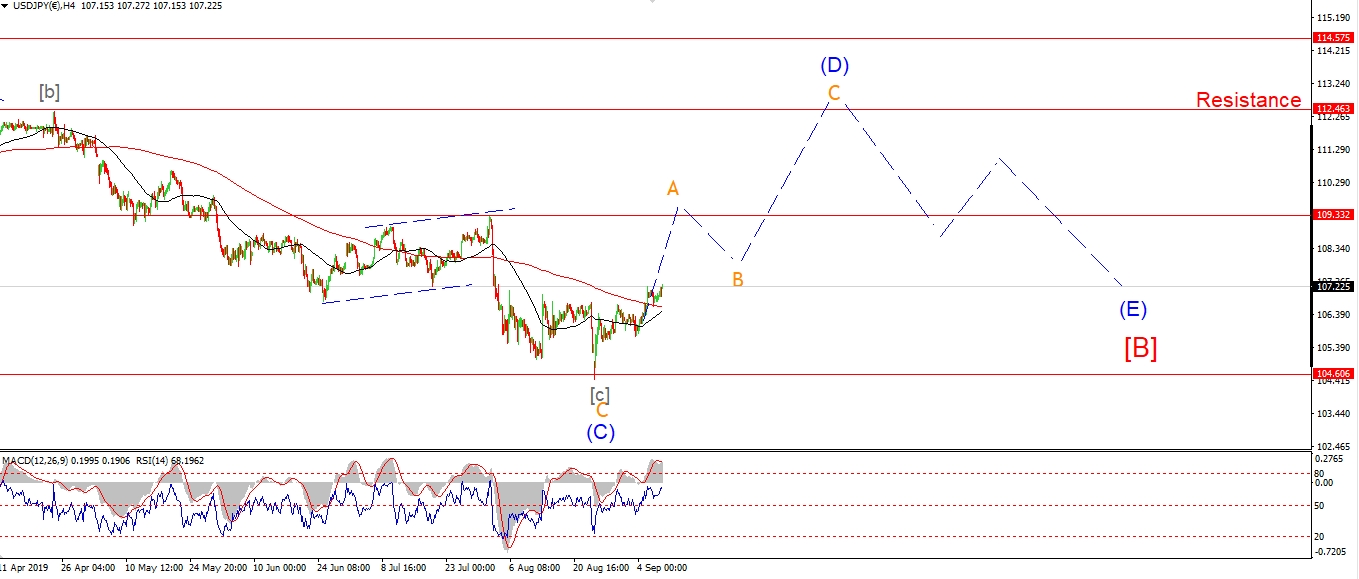 [/vc_column_text][vc_custom_heading text=”Daily” use_theme_fonts=”yes”][vc_column_text]
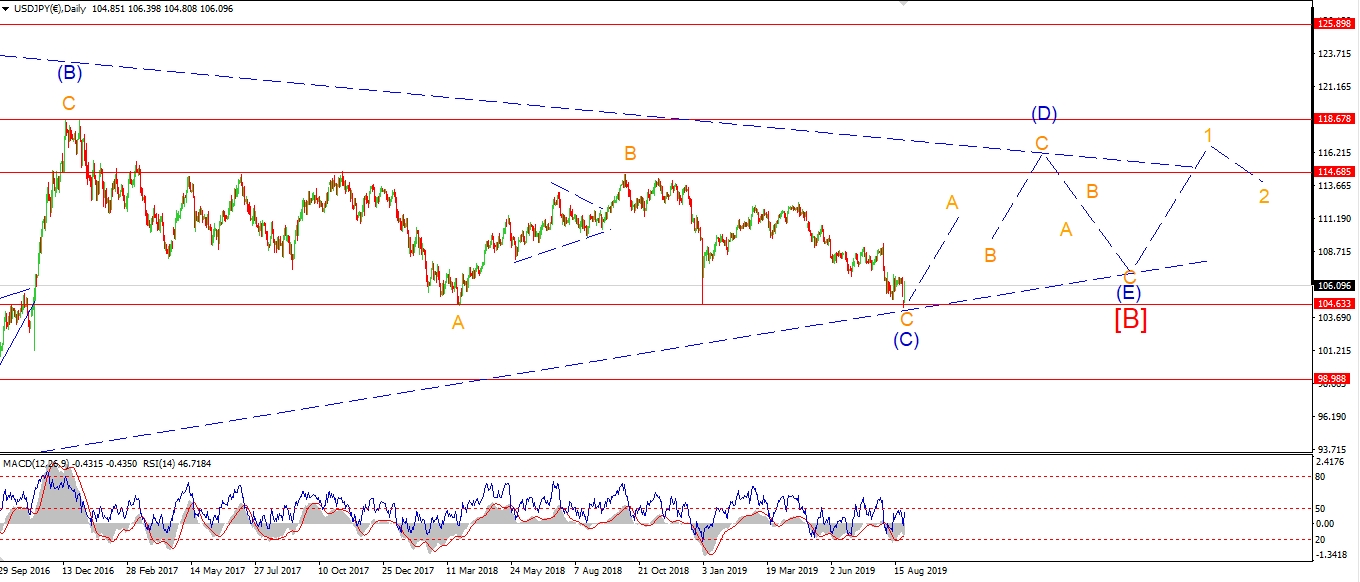 [/vc_column_text][/vc_column][/vc_row]
[vc_row][vc_column][vc_column_text]
USDJPY is looking a little fragile this evening.
The upside momentum seems to have dissipated even while we are in the midst of a possible third wave up.
This action is leaning towards the alternate count now.
And I have shown that circled in red.
The alternate calls for a three wave rally in wave ‘A’ to complete soon and then a corrective drop in wave ‘B’ to begin.
A break of 106.60 will confirm the alternate count.
Tomorrow;
For the moment I will stick with the current wave count,
as both allow for more upside over the next few sessions.
Watch for the high at 107.22 to hold tomorrow.
[/vc_column_text][/vc_column][/vc_row]
[vc_row][vc_column][vc_separator border_width=”5″][/vc_column][/vc_row][vc_row][vc_column][vc_column_text]
DOW JONES INDUSTRIALS
[/vc_column_text][/vc_column][/vc_row][vc_row][vc_column][vc_separator border_width=”5″][/vc_column][/vc_row][vc_row][vc_column width=”2/3″][vc_custom_heading text=”1 hr” use_theme_fonts=”yes”][vc_column_text]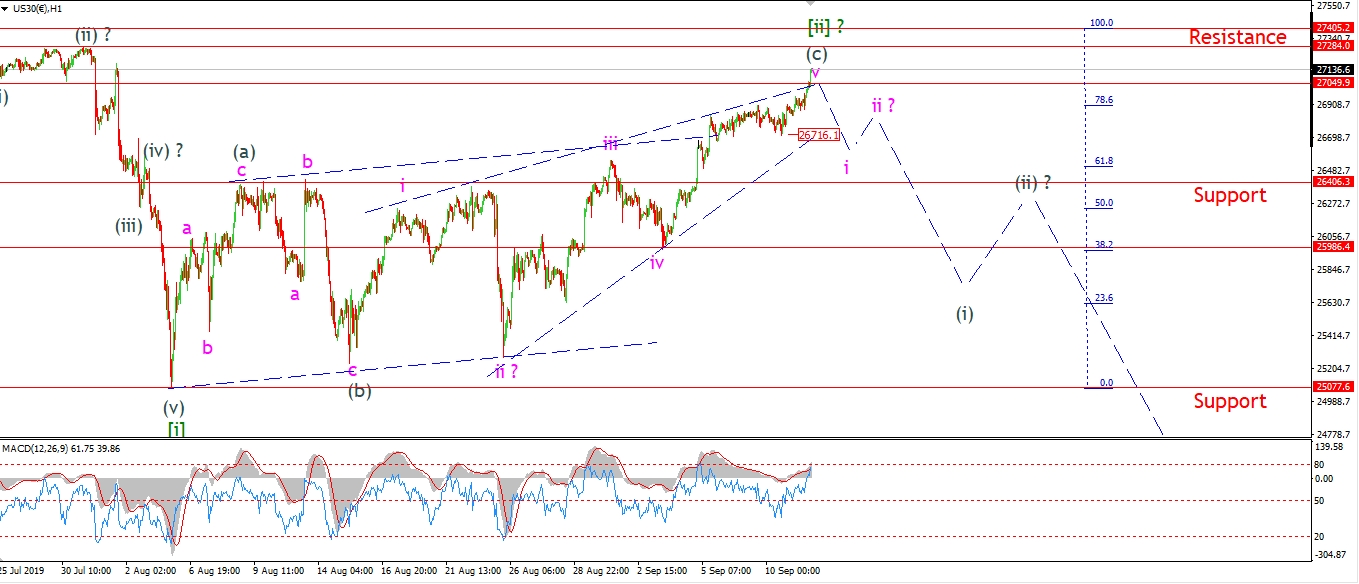 [/vc_column_text][/vc_column][vc_column width=”1/3″][vc_custom_heading text=”4 Hours” use_theme_fonts=”yes”][vc_column_text]
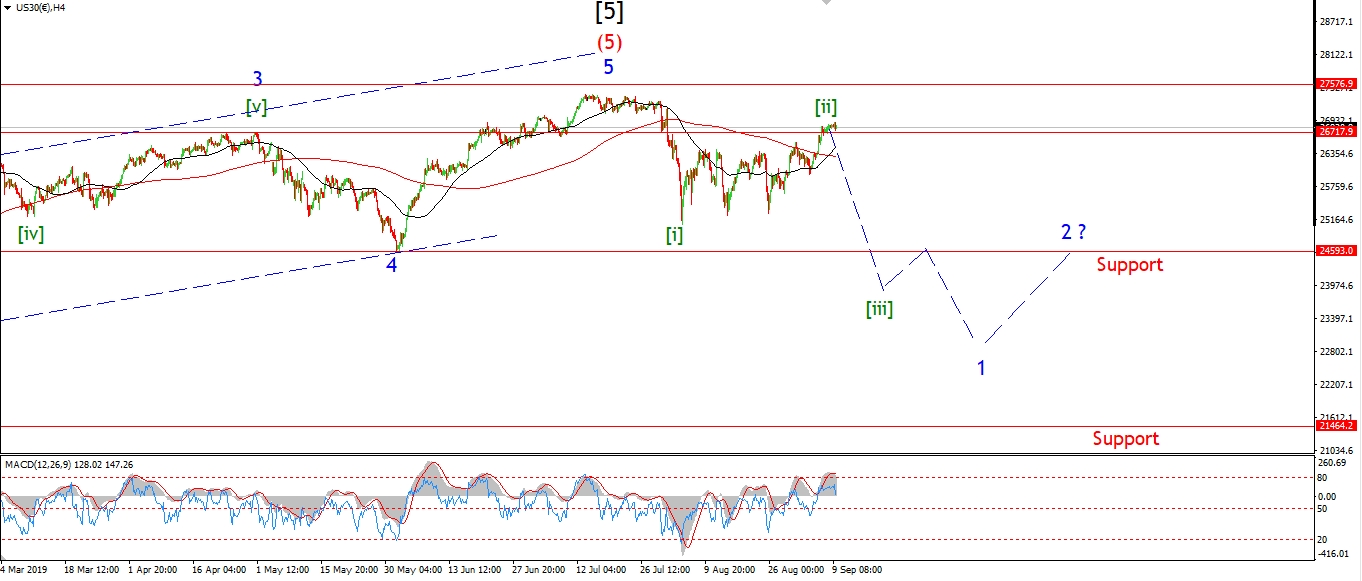 [/vc_column_text][vc_custom_heading text=”Daily” use_theme_fonts=”yes”][vc_column_text]
 [/vc_column_text][/vc_column][/vc_row]
[vc_row][vc_column][vc_column_text]
The Dow is higher today in wave ‘v’ of (c) but this rally looks really stretched now.
I know that we are right back up in the territory of the alll time highs in wave [ii],
and that it is late in the game for a turn lower,
but I still cant shake the idea that this is a three wave correction.
No matter what way I count this structure off the wave [i] low,
it all points to a corrective rally.
The action over the last few sessions is zombie like.
Moving higher in a tight range with very little internal variation.
This structure is weak,
and the rally should break tomorrow.
Tomorrow;
Watch for that initial move lower in wave ‘i’ of (i) which should break 26700 at a minimum.
[/vc_column_text][/vc_column][/vc_row]
[vc_row][vc_column][vc_separator border_width=”5″][/vc_column][/vc_row][vc_row][vc_column][vc_column_text]
GOLD
[/vc_column_text][/vc_column][/vc_row][vc_row][vc_column][vc_separator border_width=”5″][/vc_column][/vc_row][vc_row][vc_column width=”2/3″][vc_custom_heading text=”1 hr” use_theme_fonts=”yes”][vc_column_text]
 [/vc_column_text][/vc_column][vc_column width=”1/3″][vc_custom_heading text=”4 Hours” use_theme_fonts=”yes”][vc_column_text]
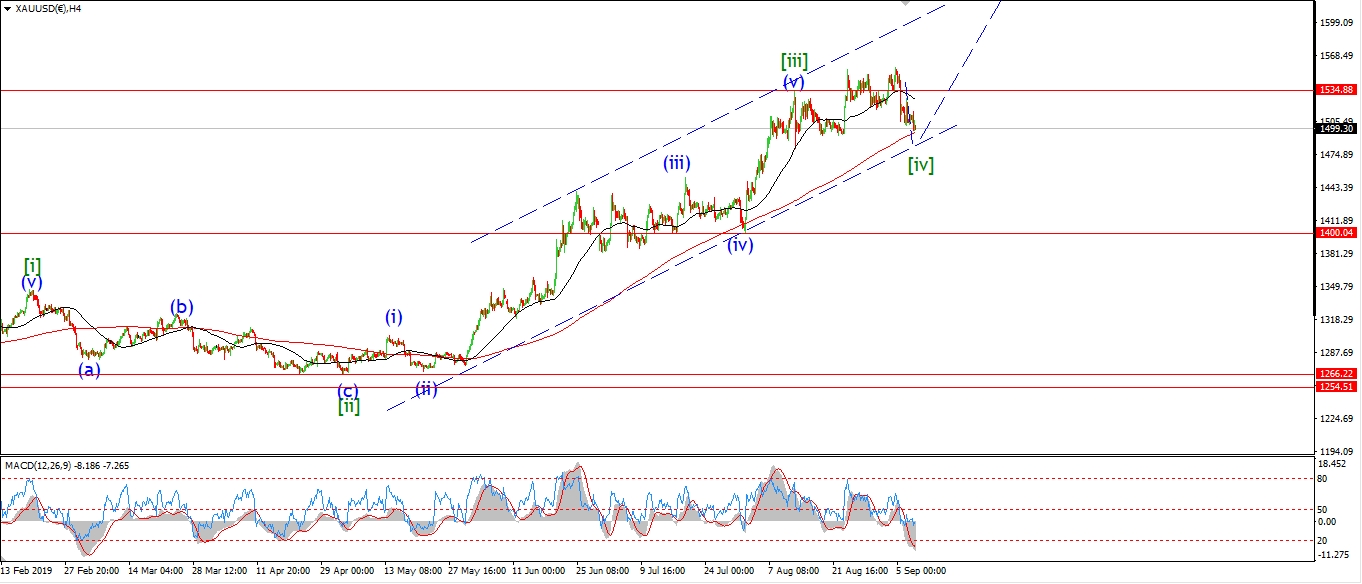 [/vc_column_text][vc_custom_heading text=”Daily” use_theme_fonts=”yes”][vc_column_text]
 [/vc_column_text][/vc_column][/vc_row]
[vc_row][vc_column][vc_column_text]
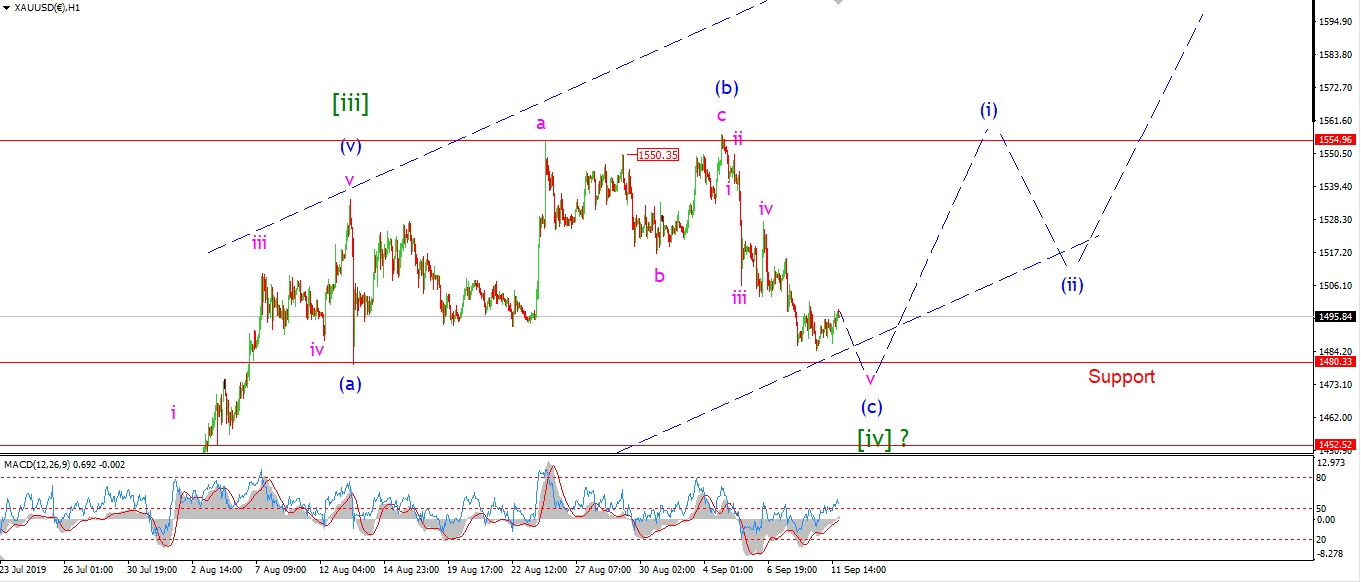
Gold didn’t quite make it to 1480 in wave (c) just yet.
The price has risen fairly collectively today in a possible fourth wave within wave ‘v’.
I think this structure needs another decline
back below 1480 again to finish off wave (c) properly.
When that happens,
I will look higher again in wave (i) of [v].
Tomorrow;
watch for wave ‘v’ of (c) to hit 1480 and complete.
Next week is looking positive at the moment,
as wave (i) should carry prices higher again.
[/vc_column_text][/vc_column][/vc_row]
[vc_row][vc_column][vc_separator border_width=”5″][/vc_column][/vc_row][vc_row][vc_column][vc_column_text]
U.S CRUDE OIL
[/vc_column_text][/vc_column][/vc_row][vc_row][vc_column][vc_separator border_width=”5″][/vc_column][/vc_row][vc_row][vc_column width=”2/3″][vc_custom_heading text=”1 hr” use_theme_fonts=”yes”][vc_column_text]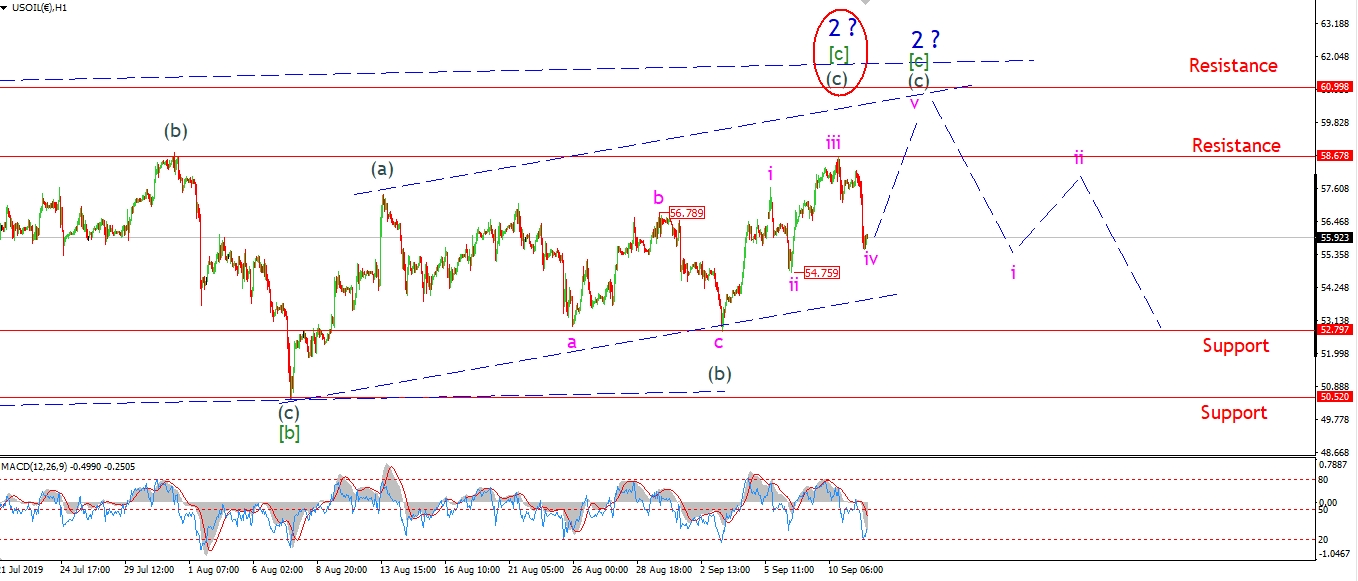 [/vc_column_text][/vc_column][vc_column width=”1/3″][vc_custom_heading text=”4 Hours” use_theme_fonts=”yes”][vc_column_text]
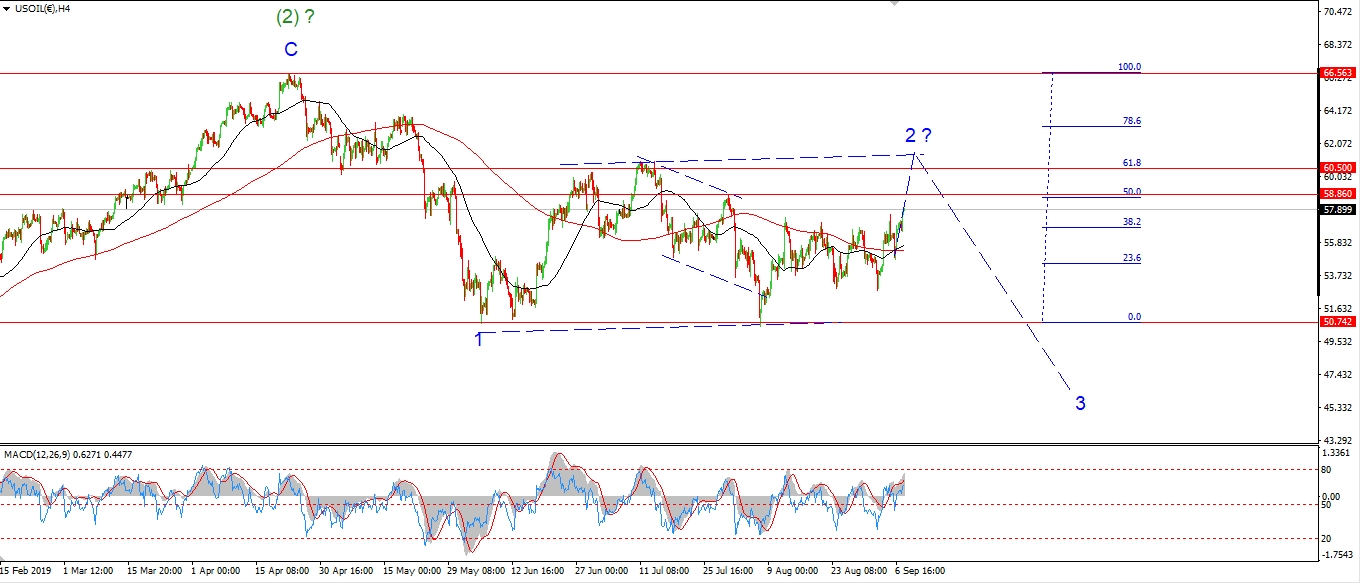 [/vc_column_text][vc_custom_heading text=”Daily” use_theme_fonts=”yes”][vc_column_text]
 [/vc_column_text][/vc_column][/vc_row]
[vc_row][vc_column][vc_column_text]
If crude oil has topped in wave ‘2’ today,
then the stock market will not be far behind!
The price moved sharply lower today,
which calls into question the idea of a further rally in wave (c).
The decline off the recent high at wave ‘iii’
can still be counted as a three wave correction in wave ‘iv’.
So the current count has not been ruled out just yet.
But,
if the price falls below 54.75 in five waves again,
that will invalidate the current count.
and wave ‘2’ will be complete as a running flat.
Tomorrow;
At the moment we are quite close to creating a five wave decline and invalidating this count.
So wave ‘iv’ must hold above 54.75 tomorrow to remain bullish in wave (c).
[/vc_column_text][/vc_column][/vc_row]
[vc_row][vc_column][vc_separator border_width=”5″][/vc_column][/vc_row][vc_row][vc_column][vc_column_text]
US 10 yr Treasuries.
[/vc_column_text][/vc_column][/vc_row][vc_row][vc_column][vc_separator border_width=”5″][/vc_column][/vc_row][vc_row][vc_column width=”2/3″][vc_custom_heading text=”1 hr” use_theme_fonts=”yes”][vc_column_text]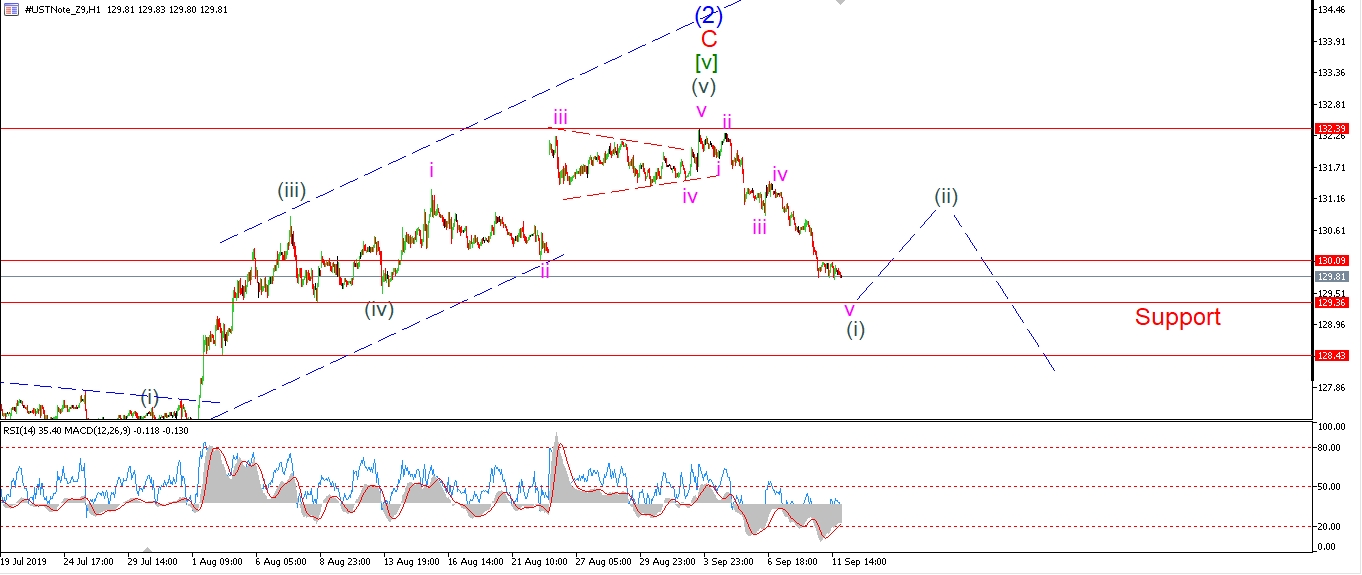 [/vc_column_text][/vc_column][vc_column width=”1/3″][vc_custom_heading text=”4 Hours” use_theme_fonts=”yes”][vc_column_text]
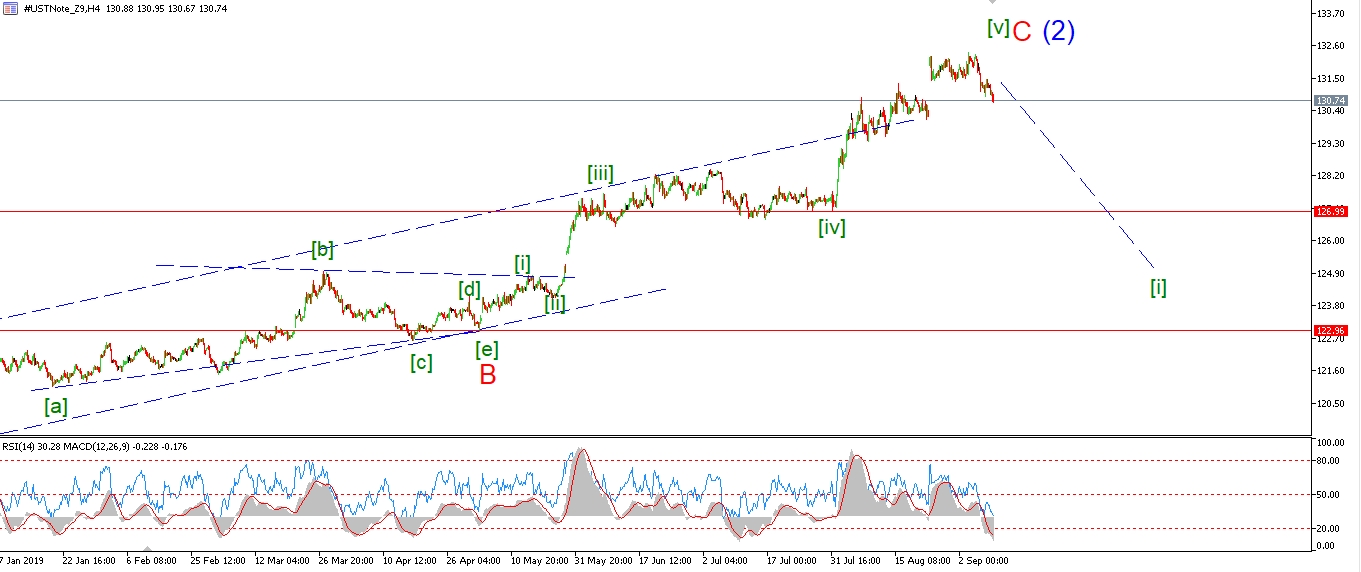 [/vc_column_text][vc_custom_heading text=”Daily” use_theme_fonts=”yes”][vc_column_text]
 [/vc_column_text][/vc_column][/vc_row]
[vc_row][vc_column][vc_column_text]
Now the story is getting interesting for bonds!
Bonds have held below 130.00 for the whole day.
The action is very tight and corrective looking,
so I expect wave (i) down is not yet complete.
Wave ‘v’ of (i) is likely tracing out an extension into a five wave structure itself.
If this is the case,
then wave (i) could break 129.36 before finishing.
That would be an interesting move
as it will bring the price below the left shoulder formed at wave (iv).
And that will definitely favor the bearish outlook.
Tomorrow;
watch for wave (i) down to break support at 129.36.
[/vc_column_text][/vc_column][/vc_row]
[vc_row][vc_column][vc_separator border_width=”5″][/vc_column][/vc_row][vc_row][vc_column][vc_column_text]
SILVER
[/vc_column_text][/vc_column][/vc_row][vc_row][vc_column][vc_separator border_width=”5″][/vc_column][/vc_row][vc_row][vc_column width=”2/3″][vc_custom_heading text=”1 hr” use_theme_fonts=”yes”][vc_column_text]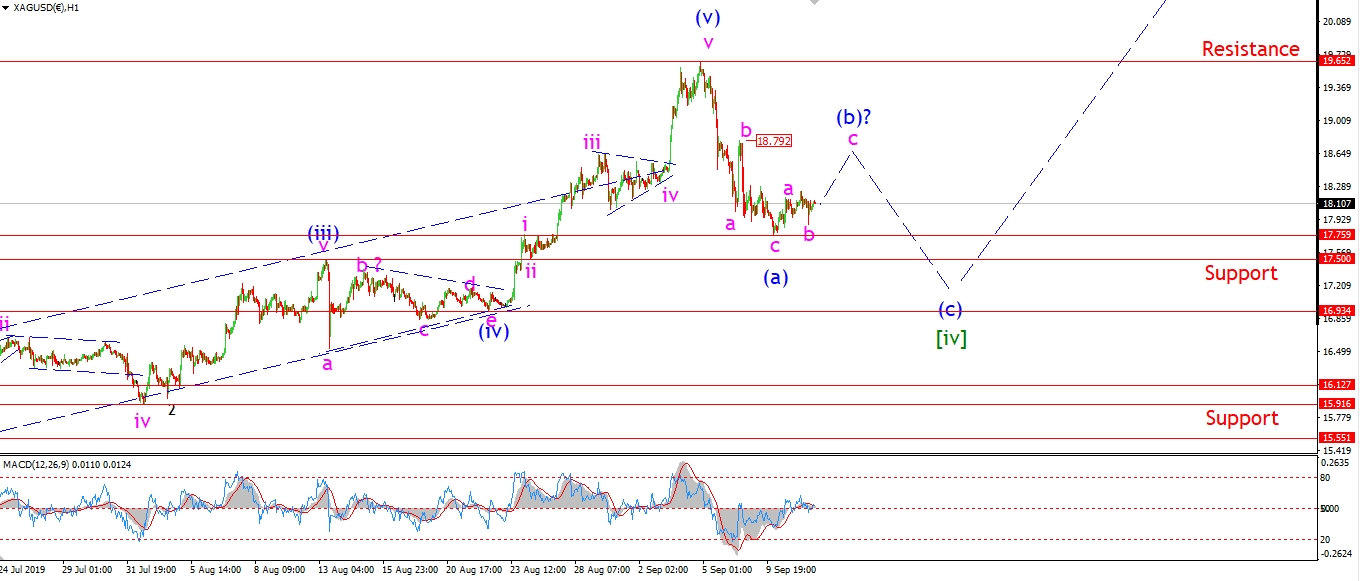 [/vc_column_text][/vc_column][vc_column width=”1/3″][vc_custom_heading text=”4 Hours” use_theme_fonts=”yes”][vc_column_text]
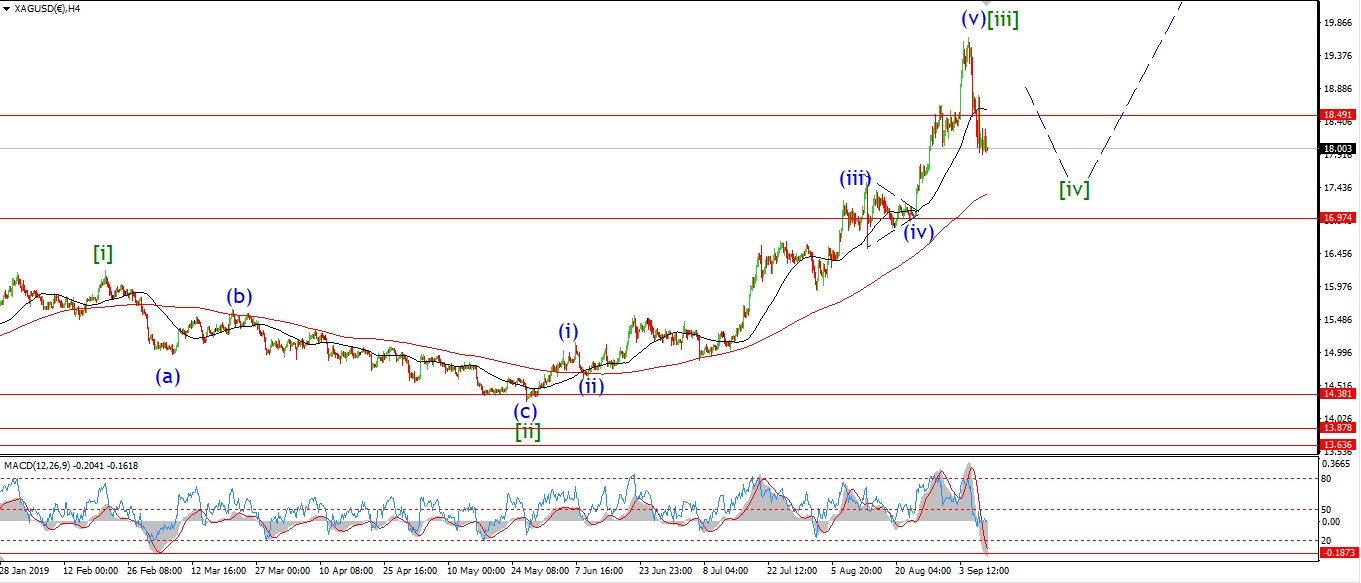 [/vc_column_text][vc_custom_heading text=”Daily” use_theme_fonts=”yes”][vc_column_text]
 [/vc_column_text][/vc_column][/vc_row]
[vc_row][vc_column][vc_column_text]
Silver is very quiet over the last few sessions!
The price seems to be stuck in wave ‘b’ of (b) today
which could explain the lack of any direction.
I have shown wave ‘b’ pink at todays low of 17.88,
wave ‘c’ should now continue higher and complete in the area of the previous wave ‘b’ at 18.79.
Tomorrow;
Watch for 17.88 to hold and wave (b) to close out with one more push to resistance.
Wave (c) should follow and head lower for most of next week.
[/vc_column_text][/vc_column][/vc_row]
[vc_row][vc_column][vc_separator border_width=”5″][/vc_column][/vc_row][vc_row][vc_column][vc_column_text]
S&P 500.
[/vc_column_text][/vc_column][/vc_row][vc_row][vc_column][vc_separator border_width=”5″][/vc_column][/vc_row][vc_row][vc_column width=”2/3″][vc_custom_heading text=”1 hr” use_theme_fonts=”yes”][vc_column_text]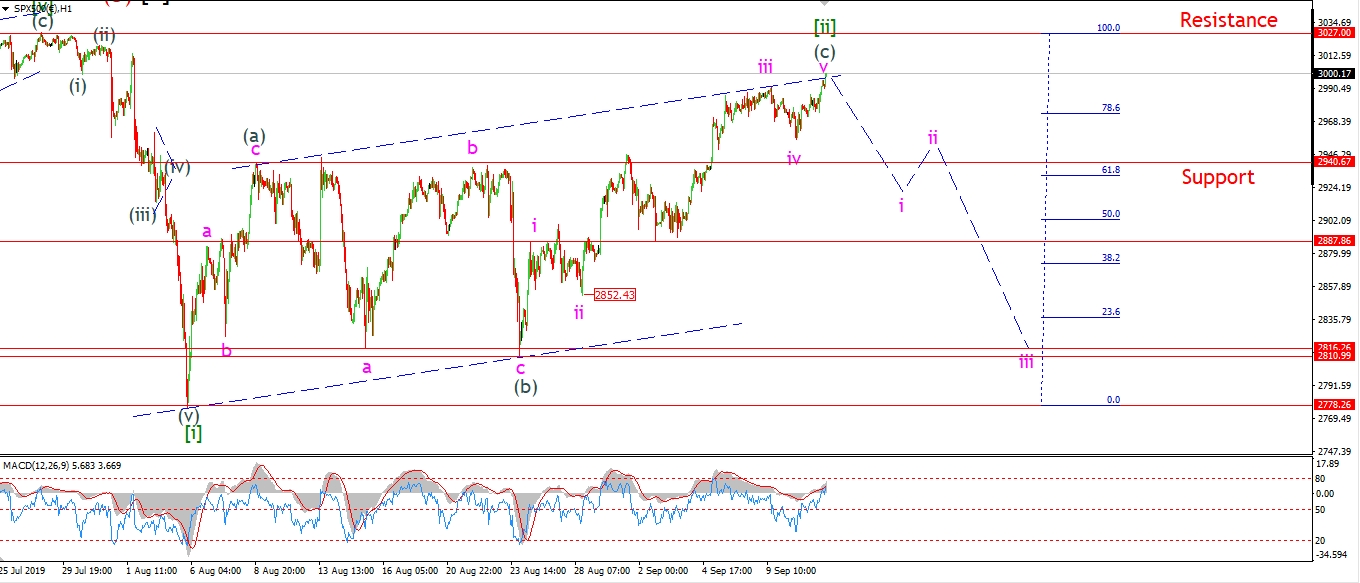 [/vc_column_text][/vc_column][vc_column width=”1/3″][vc_custom_heading text=”4 Hours” use_theme_fonts=”yes”][vc_column_text]
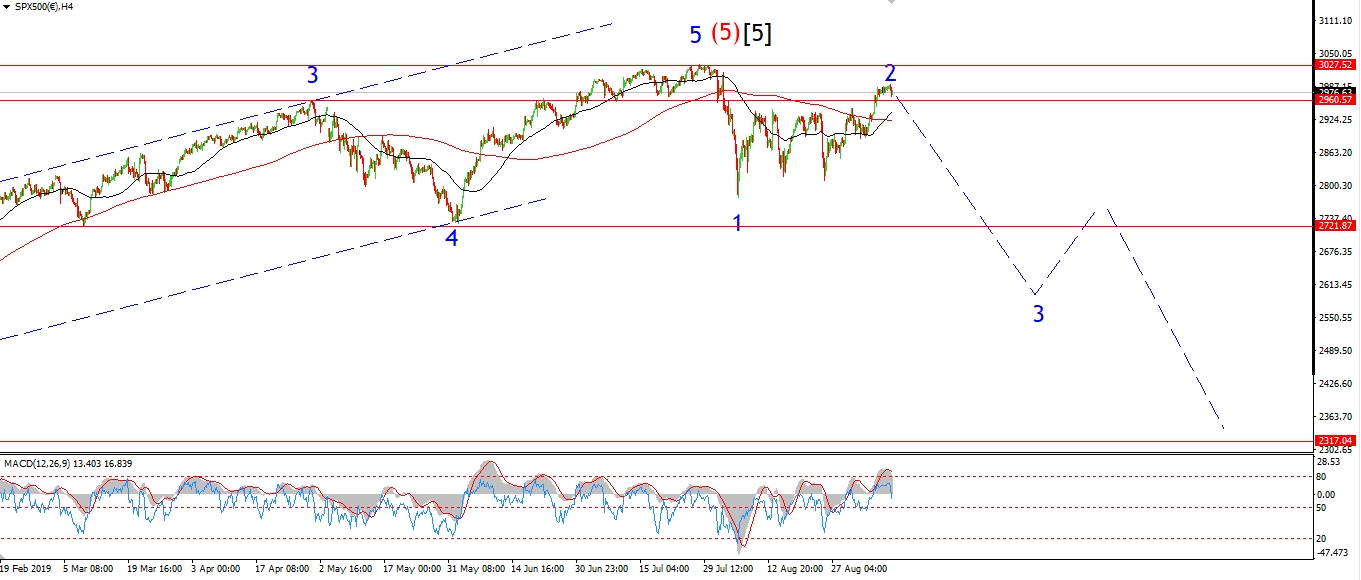 [/vc_column_text][vc_custom_heading text=”Daily” use_theme_fonts=”yes”][vc_column_text]
 [/vc_column_text][/vc_column][/vc_row]
[vc_row][vc_column][vc_column_text]
The same conundrum exists in the S&P this evening.
The market has inched higher towards 3000 again
all on weak momentum and price action.
It really feels like a rally running on the thinnest of fumes now!
Wave (c) has now hit the upper trend line again.
Wave ‘v’ of (c) is touching the trend line as I write.
So the structure has fulfilled the expectation of a second wave correction fully,
by tracing out a three wave movement,
and rallying to a point where the market fully believes in the rally.
Tomorrow;
The most important thing now is that the all time high holds firm.
Wave [ii] is done as far as I can see.
Now we need the decline to begin.
Watch for wave ‘i’ down to push below 2940 again before the end of this week.
[/vc_column_text][/vc_column][/vc_row]
[vc_row][vc_column][vc_separator border_width=”5″][/vc_column][/vc_row]