
[vc_row][vc_column][vc_separator border_width=”5″][/vc_column][/vc_row]
[vc_row][vc_column][vc_column_text]
Good evening to one and all.
[/vc_column_text][/vc_column][/vc_row]
[vc_row][vc_column][vc_separator border_width=”5″][/vc_column][/vc_row]
[vc_row][vc_column][vc_column_text]
EURUSD
[/vc_column_text][/vc_column][/vc_row]
[vc_row][vc_column][vc_separator border_width=”5″][/vc_column][/vc_row][vc_row][vc_column width=”2/3″][vc_custom_heading text=”1 hr” use_theme_fonts=”yes”][vc_column_text]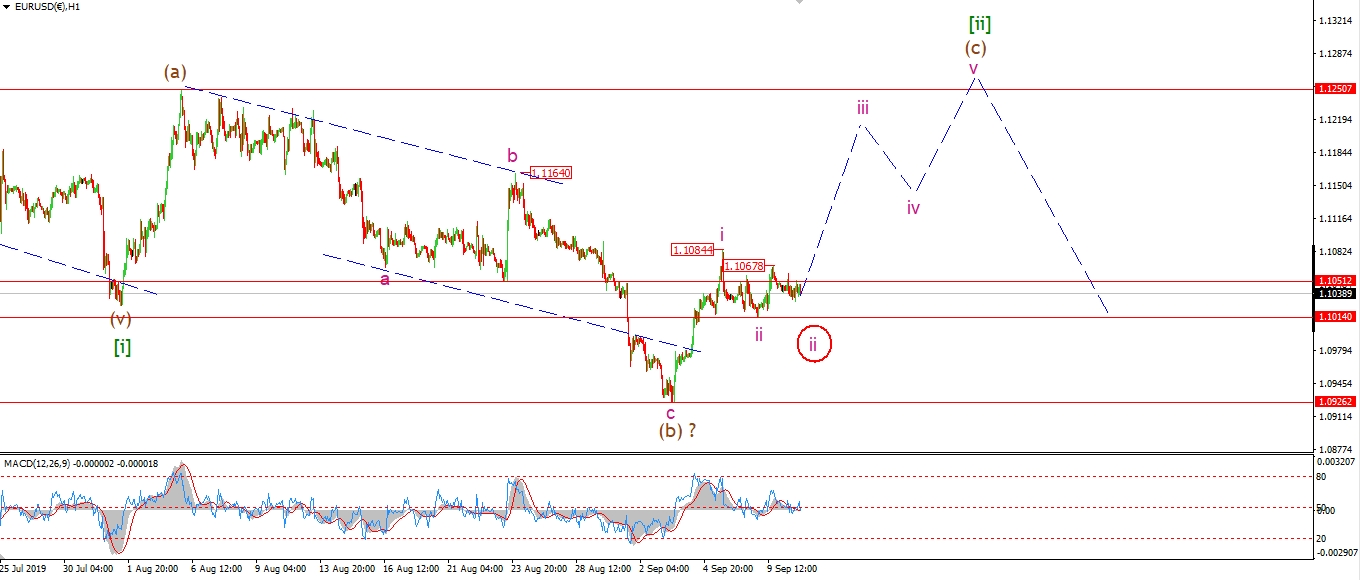 [/vc_column_text][/vc_column][vc_column width=”1/3″][vc_custom_heading text=”4 Hours” use_theme_fonts=”yes”][vc_column_text]
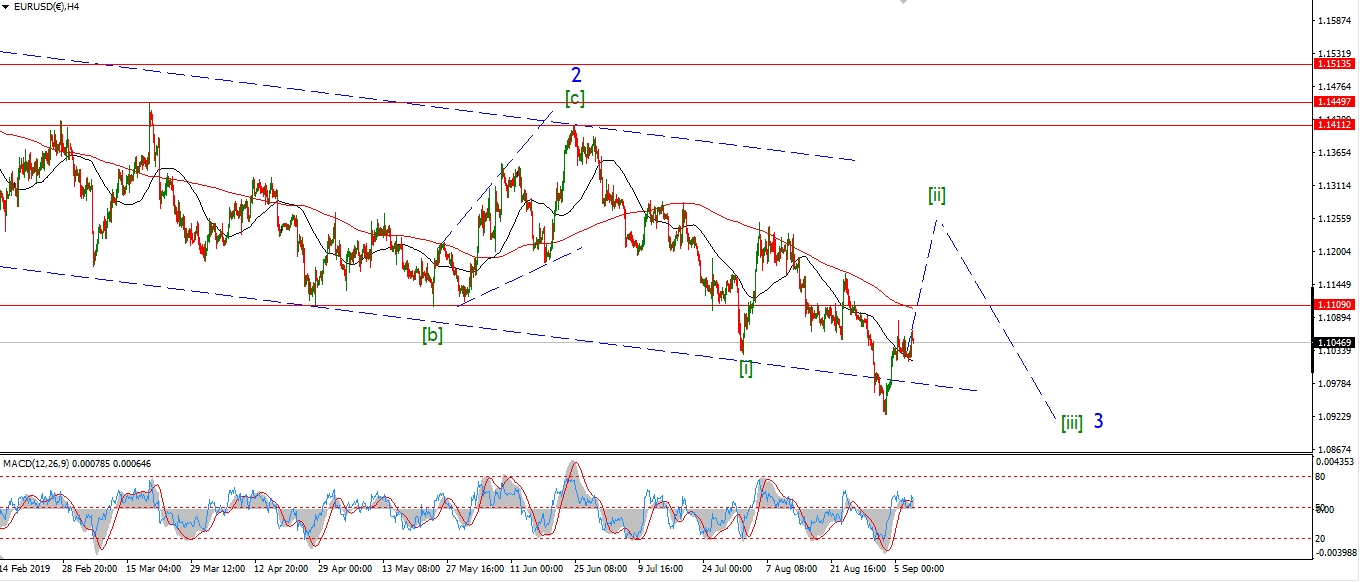 [/vc_column_text][vc_custom_heading text=”Daily” use_theme_fonts=”yes”][vc_column_text]
 [/vc_column_text][/vc_column][/vc_row]
[vc_row][vc_column][vc_column_text]
Wave ‘iii’ of (c) is still intact after a quiet trade today.
The price has merely drifted lower off Mondays high at 1.1067.
And price held above 1.1014 at wave ‘ii’.
Todays slight decline is corrective looking so far
so the idea that wave ‘iii’ is underway looks solid now.
If we see a push higher tomorrow and a break of 1.1084,
that should be enough to confirm wave ‘iii’ is underway.
Tomorrow;
Watch for 1.1014 to hold and wave ‘iii’ up to get underway properly.
Wave ‘iii’ should carry most of the way towards the target area at 1.1250.
[/vc_column_text][/vc_column][/vc_row]
[vc_row][vc_column][vc_separator border_width=”5″][/vc_column][/vc_row][vc_row][vc_column][vc_column_text]
GBPUSD
[/vc_column_text][/vc_column][/vc_row][vc_row][vc_column][vc_separator border_width=”5″][/vc_column][/vc_row][vc_row][vc_column width=”2/3″][vc_custom_heading text=”1 hr” use_theme_fonts=”yes”][vc_column_text]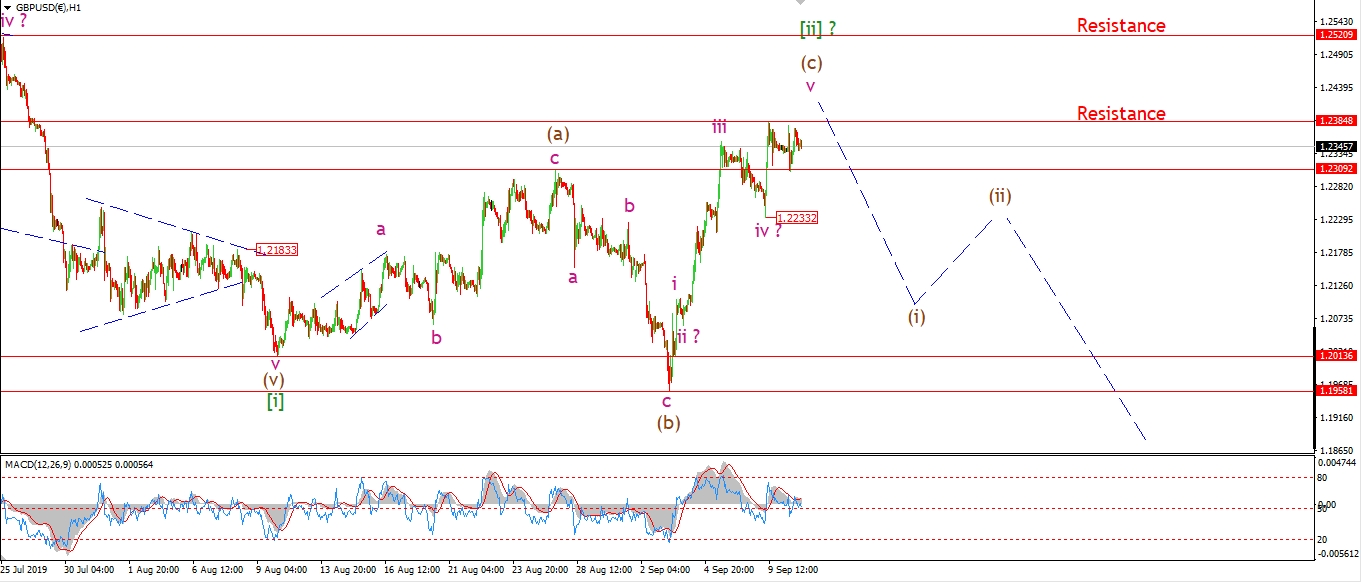 [/vc_column_text][/vc_column][vc_column width=”1/3″][vc_custom_heading text=”4 Hours” use_theme_fonts=”yes”][vc_column_text]
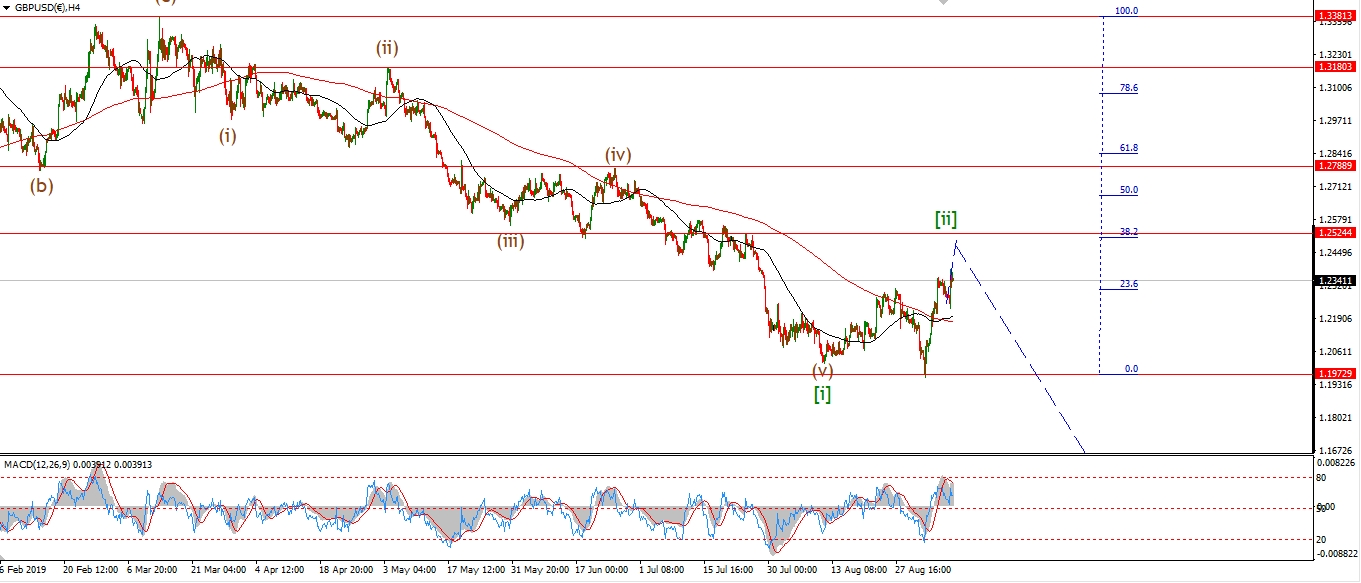 [/vc_column_text][vc_custom_heading text=”Daily” use_theme_fonts=”yes”][vc_column_text]
 [/vc_column_text][/vc_column][/vc_row]
[vc_row][vc_column][vc_column_text]
Cable is showing the same corrective sideways action as EURUSD.
The price has gone nowhere for the last few sessions.
This is now viewed as a correction within wave ‘v’ of (c).
So the spike into Mondays high at 1.2384
is now likely to be broken again as wave ‘v’ continues higher.
Tomorrow;
Watch for wave ‘v’ to push higher again towards that upper resistance at 1.2520.
We should see a five wave rally off 1.2233 at wave ‘iv’.
So wave ‘iv’ must hold for the next few sessions.
[/vc_column_text][/vc_column][/vc_row]
[vc_row][vc_column][vc_separator border_width=”5″][/vc_column][/vc_row][vc_row][vc_column][vc_column_text]
USDJPY
[/vc_column_text][/vc_column][/vc_row][vc_row][vc_column][vc_separator border_width=”5″][/vc_column][/vc_row][vc_row][vc_column width=”2/3″][vc_custom_heading text=”1 hr” use_theme_fonts=”yes”][vc_column_text]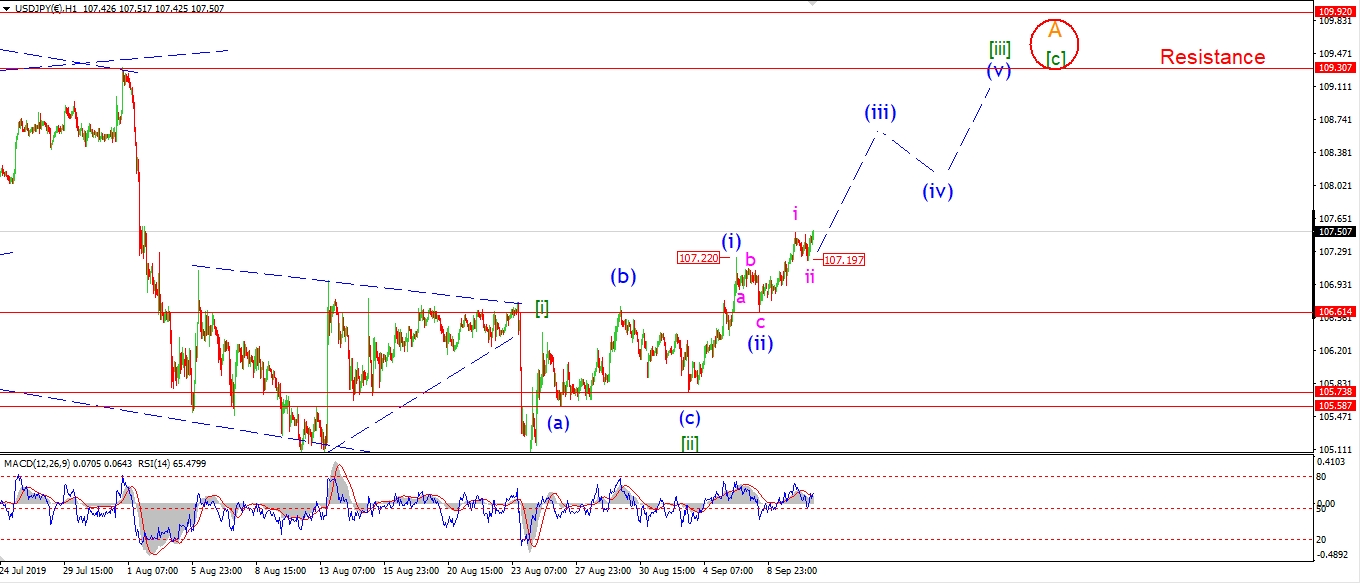 [/vc_column_text][/vc_column][vc_column width=”1/3″][vc_custom_heading text=”4 Hours” use_theme_fonts=”yes”][vc_column_text]
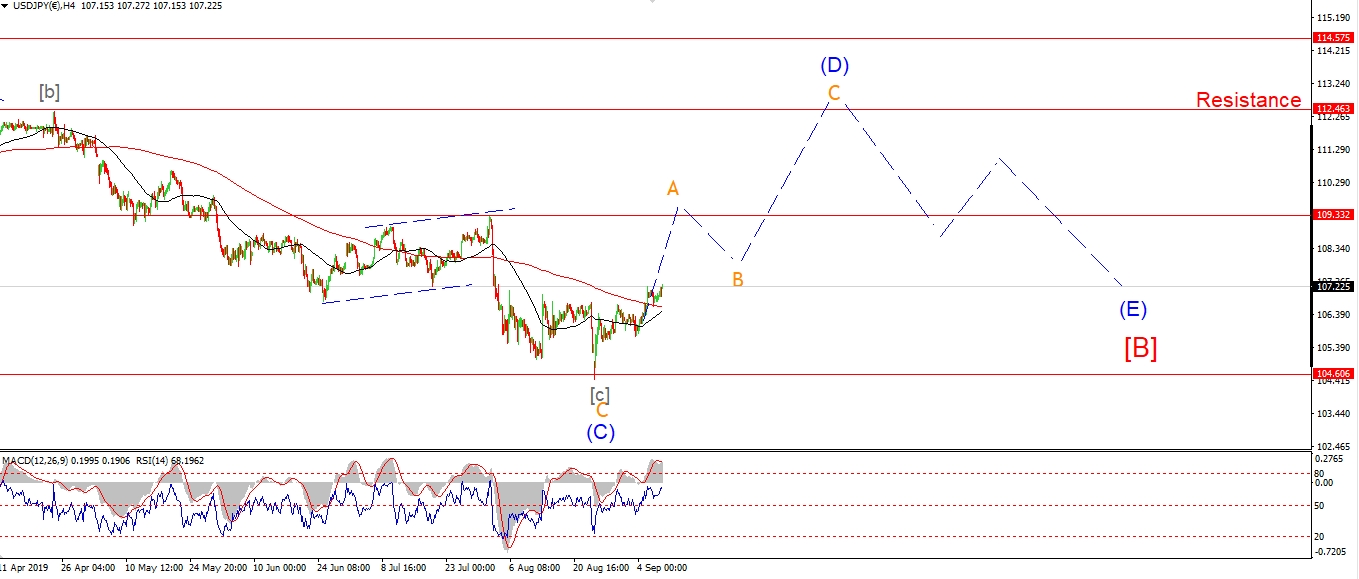 [/vc_column_text][vc_custom_heading text=”Daily” use_theme_fonts=”yes”][vc_column_text]
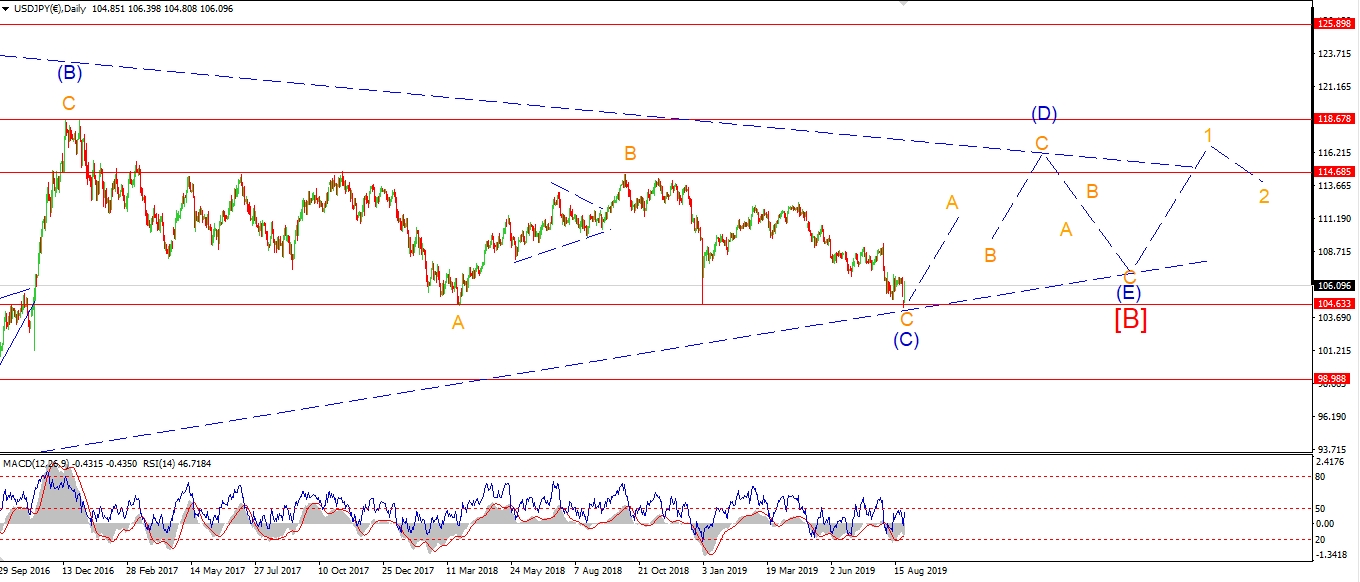 [/vc_column_text][/vc_column][/vc_row]
[vc_row][vc_column][vc_column_text]
USDJPY is looking a little more positive after todays action.
The rise off 106.61 can be viewed as a five wave rally now.
And if that is correct,
then wave (iii) is already underway.
The rise off 106.61 can be viewed as waves ‘i’ and ‘ii’ of (iii),
with wave ‘iii’ close at hand now.
If the overnight session continues higher,
That will signal that wave ‘iii’ of (iii) is now underway.
Tomorrow;
Watch for 107.19 to hold and wave ‘iii’ to continue higher overnight.
[/vc_column_text][/vc_column][/vc_row]
[vc_row][vc_column][vc_separator border_width=”5″][/vc_column][/vc_row][vc_row][vc_column][vc_column_text]
DOW JONES INDUSTRIALS
[/vc_column_text][/vc_column][/vc_row][vc_row][vc_column][vc_separator border_width=”5″][/vc_column][/vc_row][vc_row][vc_column width=”2/3″][vc_custom_heading text=”1 hr” use_theme_fonts=”yes”][vc_column_text]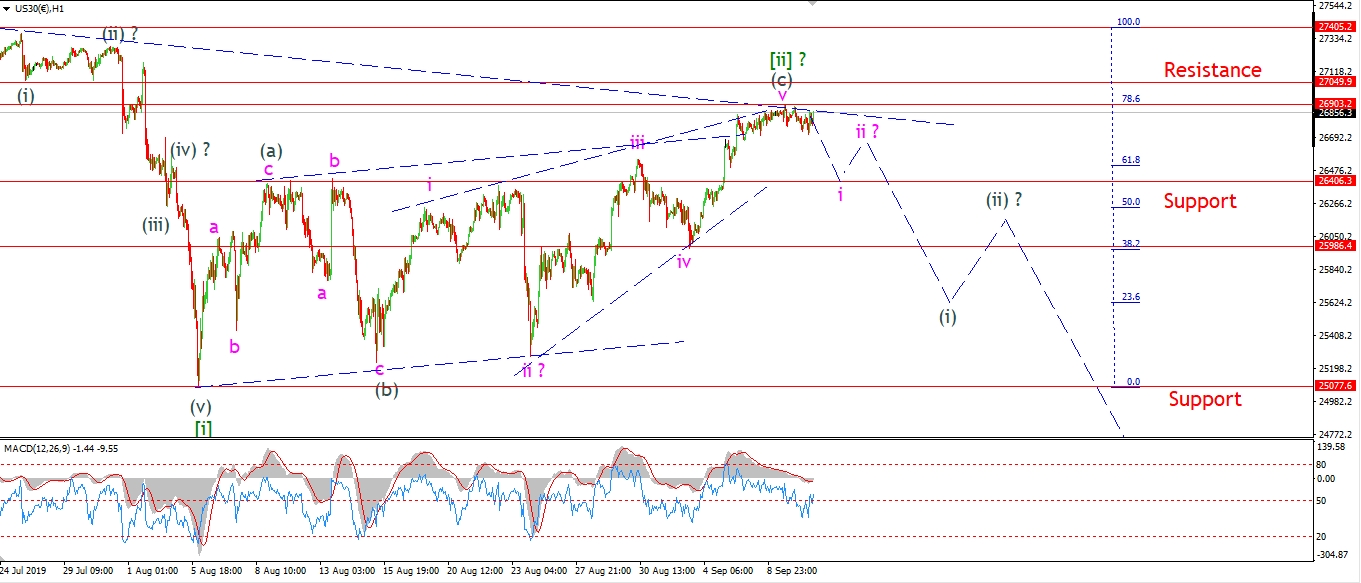 [/vc_column_text][/vc_column][vc_column width=”1/3″][vc_custom_heading text=”4 Hours” use_theme_fonts=”yes”][vc_column_text]
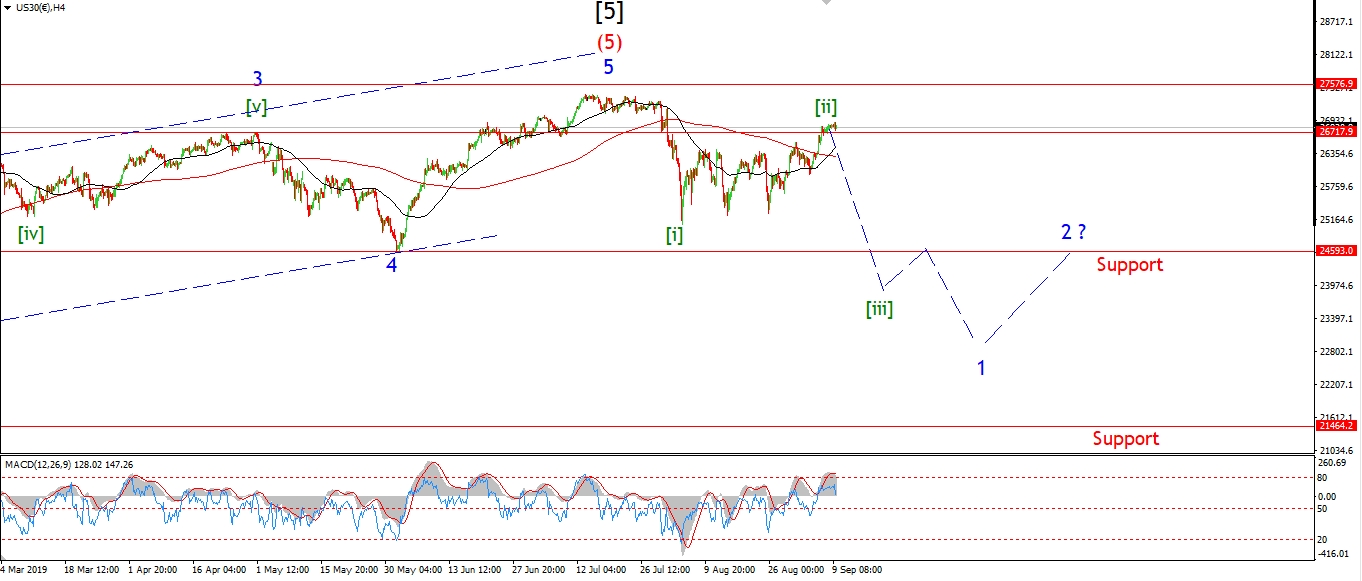 [/vc_column_text][vc_custom_heading text=”Daily” use_theme_fonts=”yes”][vc_column_text]
 [/vc_column_text][/vc_column][/vc_row]
[vc_row][vc_column][vc_column_text]
The DOW is still holding onto the highs after another indecisive session.
It is hard to call at the moment.
The rally in this correction is now quite mature,
and the appetite to buy seems to have dissipated going by the recent action.
We have a completed correction according to the wave count,
and momentum is diverging down off extreme highs as I write.
The recipe for a sharp move lower is now in place,
all we need is the actual decline to confirm all the signals!
Tomorrow;
Watch for the recent high to hold at 26900 and wave (i) down to begin with a push below 26400 at the wave (a) high.
I think we will see wave (i) underway by the end of this week.
[/vc_column_text][/vc_column][/vc_row]
[vc_row][vc_column][vc_separator border_width=”5″][/vc_column][/vc_row][vc_row][vc_column][vc_column_text]
GOLD
[/vc_column_text][/vc_column][/vc_row][vc_row][vc_column][vc_separator border_width=”5″][/vc_column][/vc_row][vc_row][vc_column width=”2/3″][vc_custom_heading text=”1 hr” use_theme_fonts=”yes”][vc_column_text]
 [/vc_column_text][/vc_column][vc_column width=”1/3″][vc_custom_heading text=”4 Hours” use_theme_fonts=”yes”][vc_column_text]
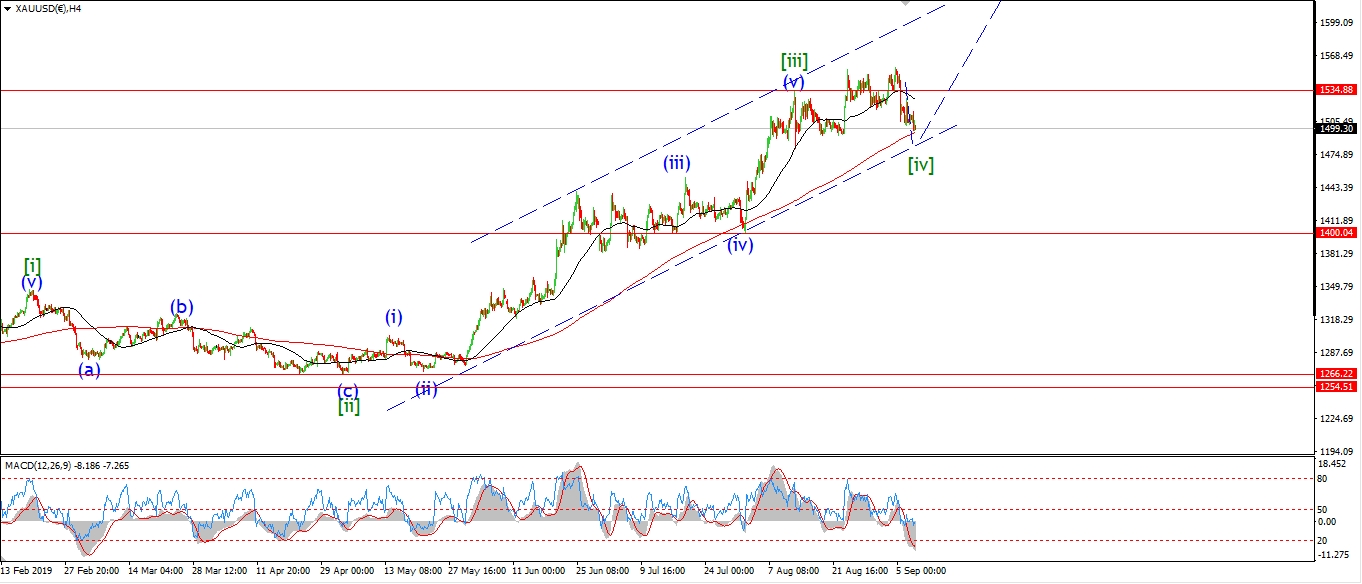 [/vc_column_text][vc_custom_heading text=”Daily” use_theme_fonts=”yes”][vc_column_text]
 [/vc_column_text][/vc_column][/vc_row]
[vc_row][vc_column][vc_column_text]
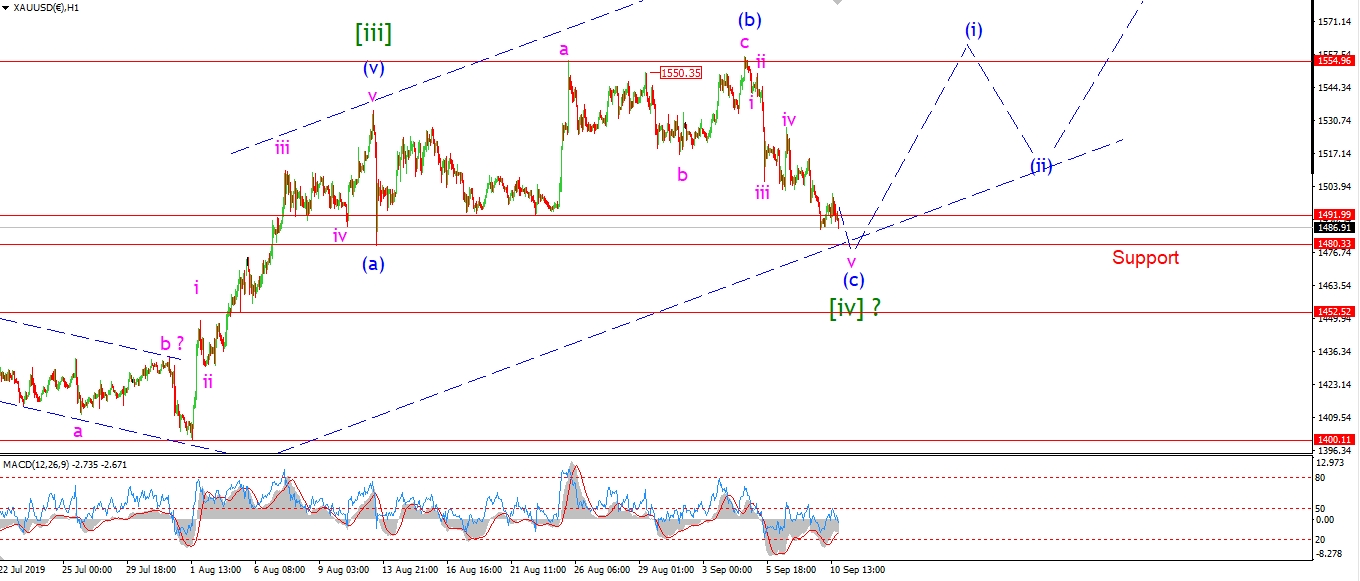
Gold is now nearing the end of wave (c) down after todays declines.
The form of the decline off the wave (b) high is now in five waves.
So wave [iv] overall has now traced out an expanded flat correction.
Wave ‘v’ of (c) is close to completing a five wave form itself.
The price continues to decline this evening in a small fifth wave within wave ‘c’
so this decline is likely to break the low of wave (a) at 1480 by tomorrow.
Tomorrow;
Watch for wave ‘v’ of (c) to complete tomorrow with a break of 1480 at a minimum.
If we see a turn higher by the end of this week,
that could signal the beginning of wave [v].
[/vc_column_text][/vc_column][/vc_row]
[vc_row][vc_column][vc_separator border_width=”5″][/vc_column][/vc_row][vc_row][vc_column][vc_column_text]
U.S CRUDE OIL
[/vc_column_text][/vc_column][/vc_row][vc_row][vc_column][vc_separator border_width=”5″][/vc_column][/vc_row][vc_row][vc_column width=”2/3″][vc_custom_heading text=”1 hr” use_theme_fonts=”yes”][vc_column_text]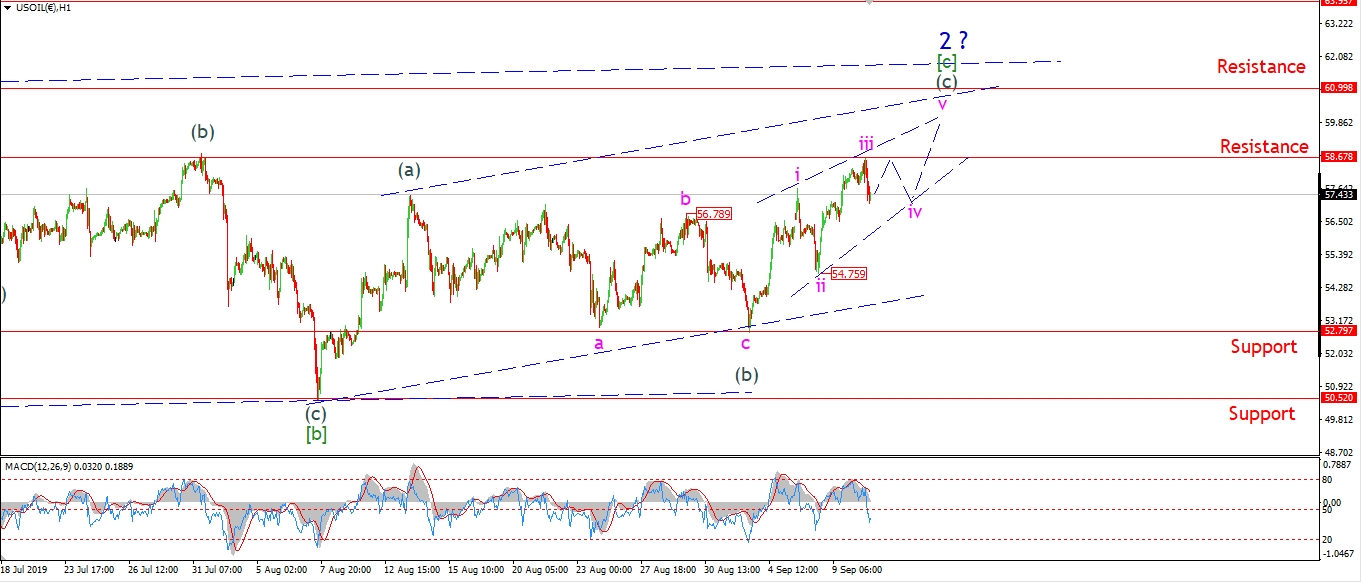 [/vc_column_text][/vc_column][vc_column width=”1/3″][vc_custom_heading text=”4 Hours” use_theme_fonts=”yes”][vc_column_text]
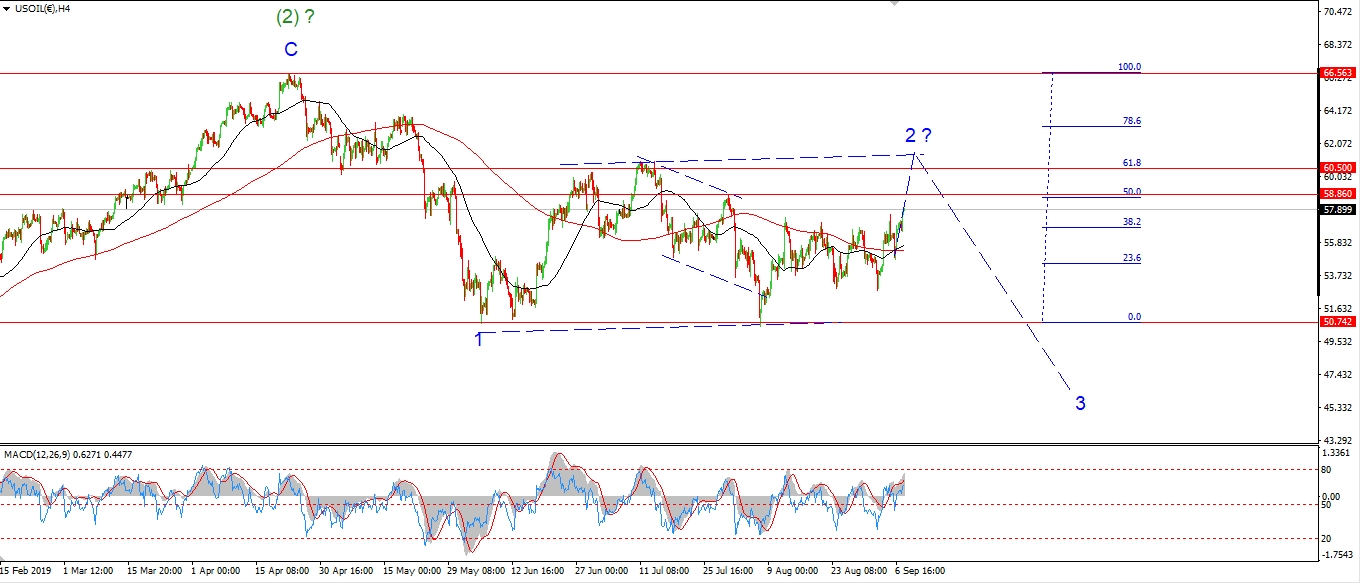 [/vc_column_text][vc_custom_heading text=”Daily” use_theme_fonts=”yes”][vc_column_text]
 [/vc_column_text][/vc_column][/vc_row]
[vc_row][vc_column][vc_column_text]
Crude hit resistance at 58.67 today and immediately failed at that level.
This action is telling,
and suggests that the rally is weaker than previously expected.
Wave (c) of [c] may be developing into an ending diagonal as shown on the short term chart.
If this is the case,
the larger wave [c] may struggle to get to the 61.00 target.
This level marks the high of wave [a].
So we may have a running flat correction on our hands for wave ‘2’.
As if the pattern couldn’t get any more complicated!
Tomorrow;
Watch for wave ‘iv’ of (c) to trace out a three wave pattern
before turning higher into wave ‘v’.
[/vc_column_text][/vc_column][/vc_row]
[vc_row][vc_column][vc_separator border_width=”5″][/vc_column][/vc_row][vc_row][vc_column][vc_column_text]
US 10 yr Treasuries.
[/vc_column_text][/vc_column][/vc_row][vc_row][vc_column][vc_separator border_width=”5″][/vc_column][/vc_row][vc_row][vc_column width=”2/3″][vc_custom_heading text=”1 hr” use_theme_fonts=”yes”][vc_column_text]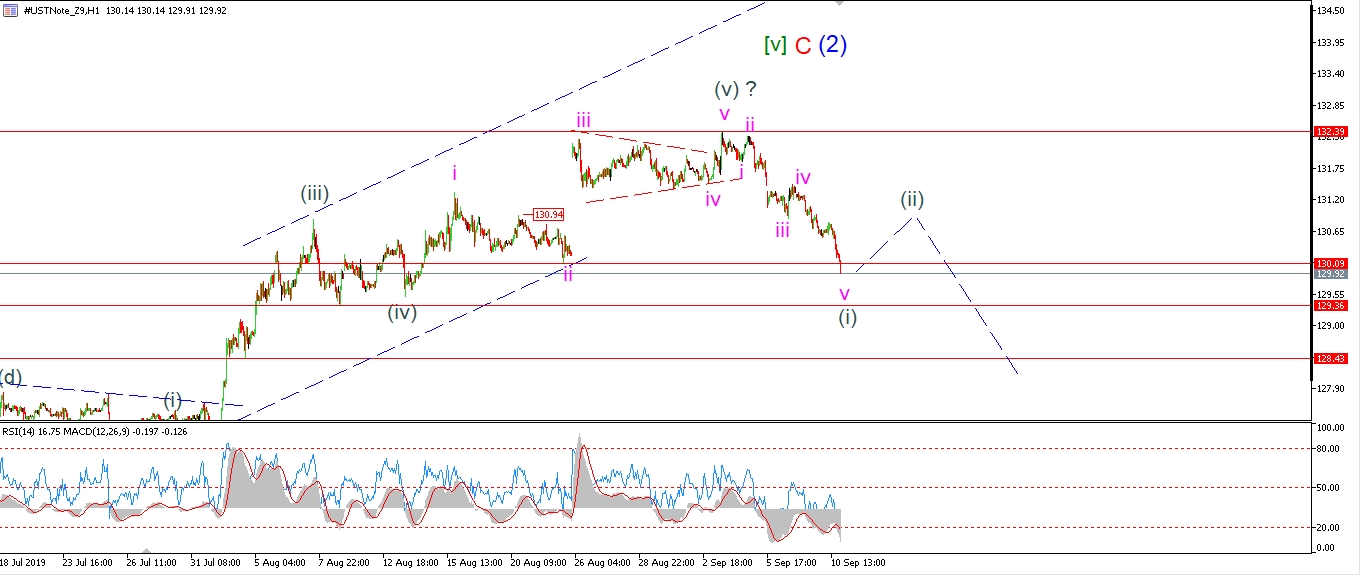 [/vc_column_text][/vc_column][vc_column width=”1/3″][vc_custom_heading text=”4 Hours” use_theme_fonts=”yes”][vc_column_text]
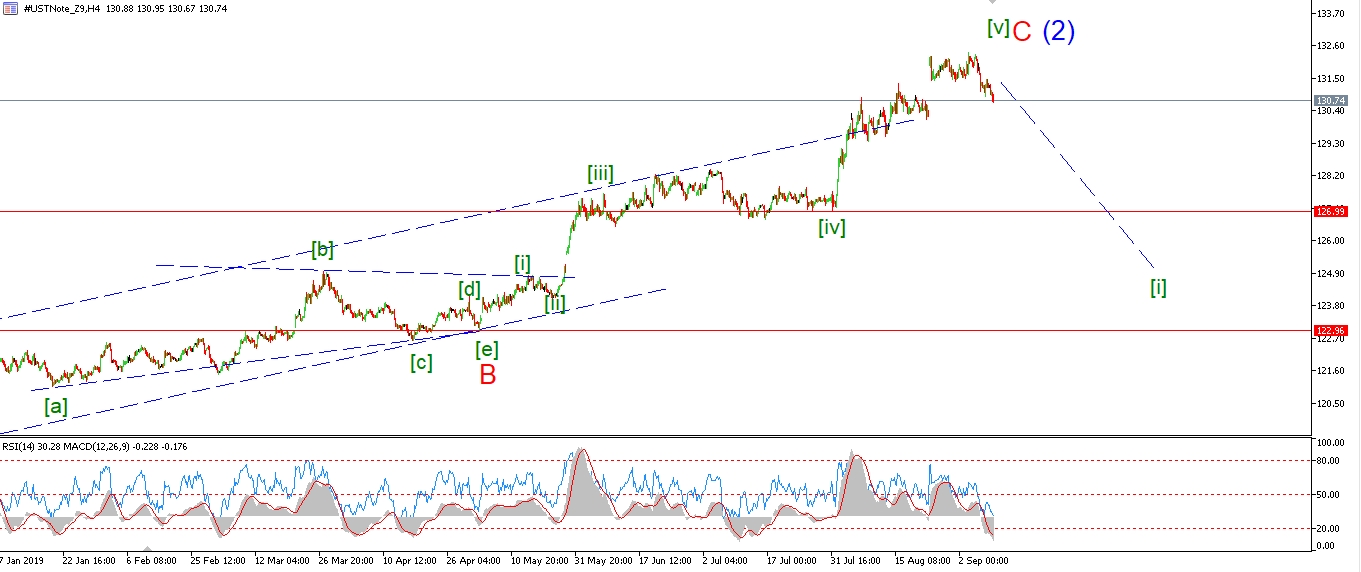 [/vc_column_text][vc_custom_heading text=”Daily” use_theme_fonts=”yes”][vc_column_text]
 [/vc_column_text][/vc_column][/vc_row]
[vc_row][vc_column][vc_column_text]
Now the story is getting interesting for bonds!
The pattern off the recent high at 132.39
is now looking like a clear five waves down.
I have labelled the decline as complete now
but we may get another push lower tomorrow in wave ‘v’ of (i).
The price has just broken the initial support level at 130.09.
this level forms the low of the previous wave ‘ii’.
This price action is close to ruling out any bullish alternate count now.
So as I said,
interesting times!
Tomorrow;
Watch for wave (i) to complete at a nearby low.
If this decline is followed by a three wave recovery,
that will create a bearish signal off the high.
[/vc_column_text][/vc_column][/vc_row]
[vc_row][vc_column][vc_separator border_width=”5″][/vc_column][/vc_row][vc_row][vc_column][vc_column_text]
SILVER
[/vc_column_text][/vc_column][/vc_row][vc_row][vc_column][vc_separator border_width=”5″][/vc_column][/vc_row][vc_row][vc_column width=”2/3″][vc_custom_heading text=”1 hr” use_theme_fonts=”yes”][vc_column_text]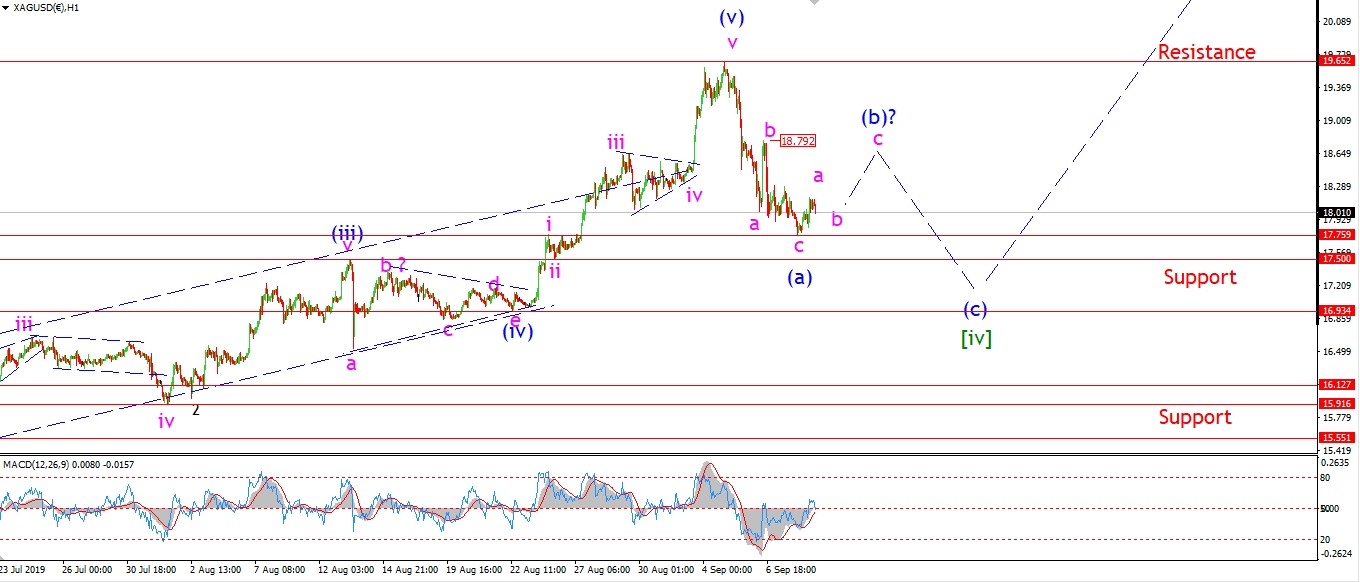 [/vc_column_text][/vc_column][vc_column width=”1/3″][vc_custom_heading text=”4 Hours” use_theme_fonts=”yes”][vc_column_text]
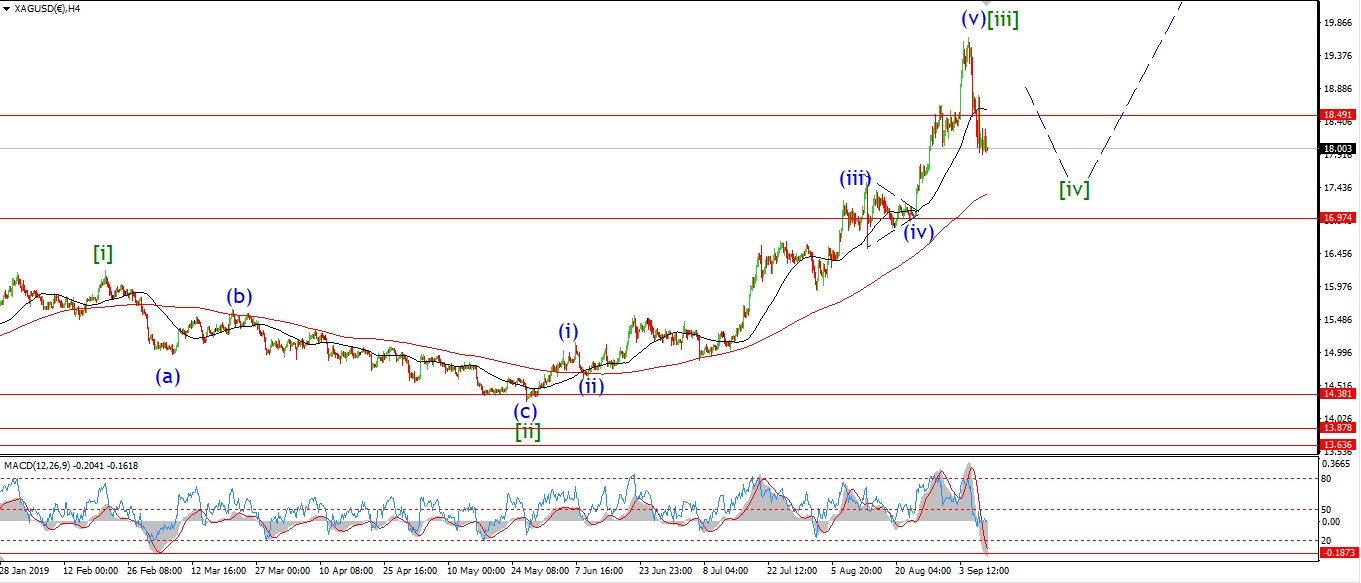 [/vc_column_text][vc_custom_heading text=”Daily” use_theme_fonts=”yes”][vc_column_text]
 [/vc_column_text][/vc_column][/vc_row]
[vc_row][vc_column][vc_column_text]
Wave (a) down is now looking like it is in the bag,
after a new low was created today at 17.75.
The recovery off the session low is labelled as wave ‘a’ of (b).
Where wave (b) will rally to a lower high in a three waves.
The recent spike high at 18.79 in wave ‘b’ of (a),
is looking like a reasonable target for wave (b) at the moment.
Tomorrow;
Watch for wave (b) to hold above 17.75 for the rest of the week as wave (b) completes.
[/vc_column_text][/vc_column][/vc_row]
[vc_row][vc_column][vc_separator border_width=”5″][/vc_column][/vc_row][vc_row][vc_column][vc_column_text]
S&P 500.
[/vc_column_text][/vc_column][/vc_row][vc_row][vc_column][vc_separator border_width=”5″][/vc_column][/vc_row][vc_row][vc_column width=”2/3″][vc_custom_heading text=”1 hr” use_theme_fonts=”yes”][vc_column_text]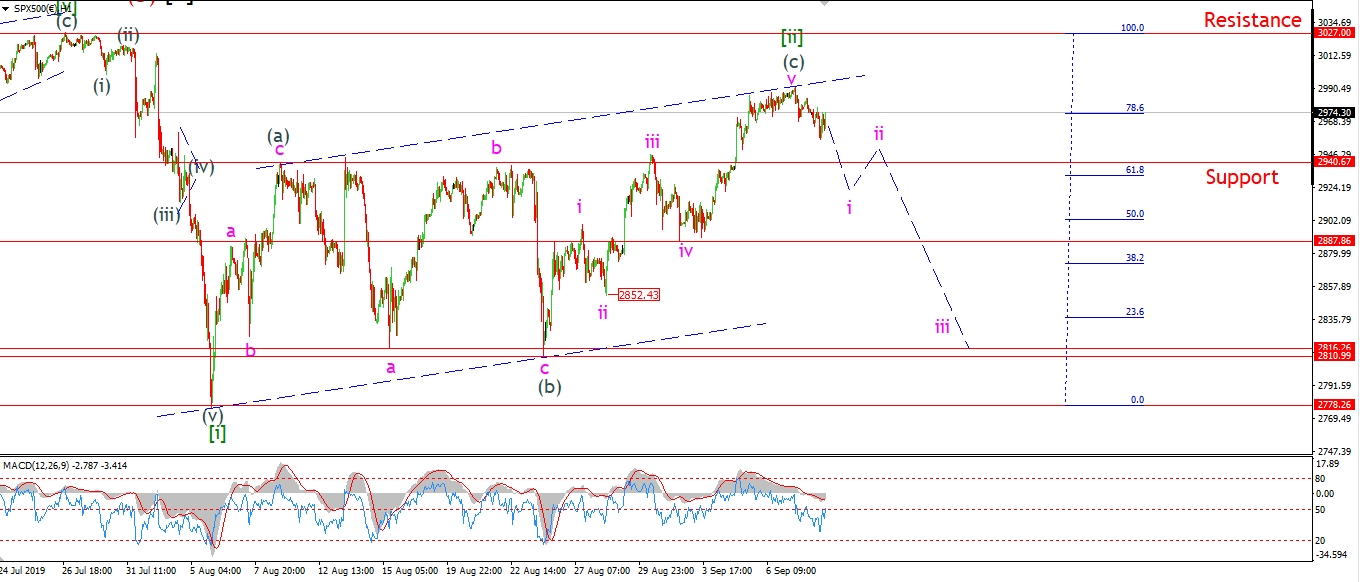 [/vc_column_text][/vc_column][vc_column width=”1/3″][vc_custom_heading text=”4 Hours” use_theme_fonts=”yes”][vc_column_text]
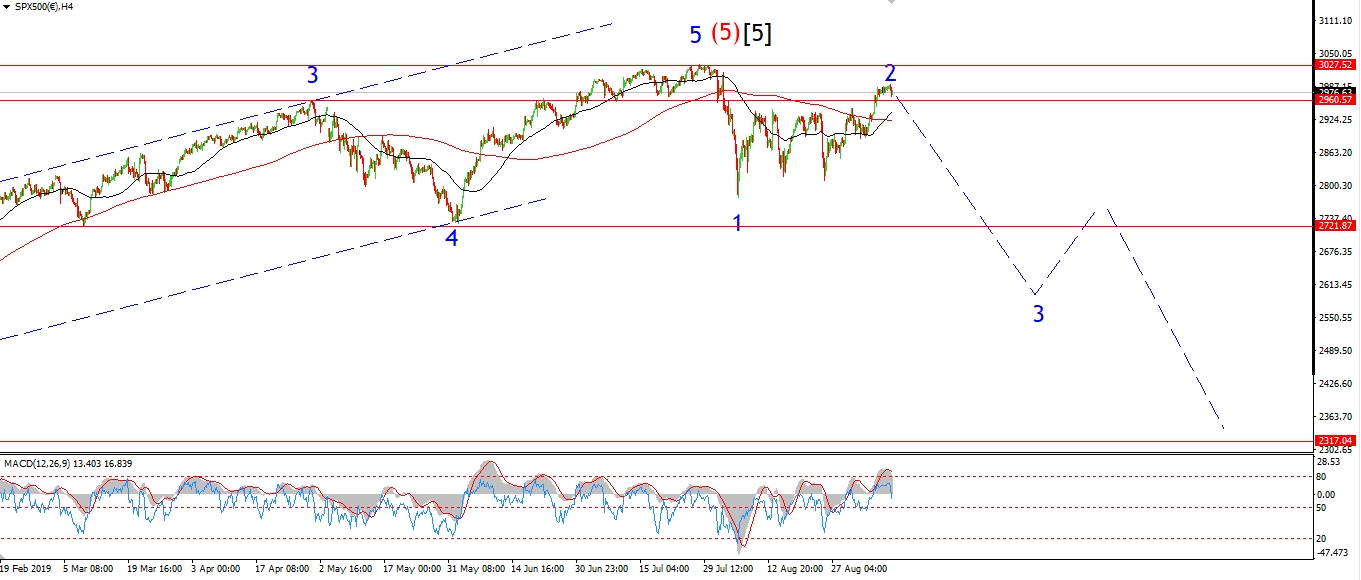 [/vc_column_text][vc_custom_heading text=”Daily” use_theme_fonts=”yes”][vc_column_text]
 [/vc_column_text][/vc_column][/vc_row]
[vc_row][vc_column][vc_column_text]
The decline in the S&P is a little more advanced than the DOW.
Although we do not have a five wave pattern off the high at all yet.
That does not mean we wont get there by the end of the week though!
Support at 2940 is the initial level to watch.
That level forms 4 previous highs over the last month.
And if we fall back below that level,
it will cast serious doubt over the strength of the rally.
Tomorrow;
I am in ‘patiently waiting’ mode at the moment.
The decline should continue tomorrow and wave ‘i’ down is set to break initial support.
Watch for a possible five wave pattern to complete by tomorrow evening.
[/vc_column_text][/vc_column][/vc_row]
[vc_row][vc_column][vc_separator border_width=”5″][/vc_column][/vc_row]