
[vc_row][vc_column][vc_separator border_width=”5″][/vc_column][/vc_row]
[vc_row][vc_column][vc_column_text]
Good evening folks, welcome back to a new week.
[/vc_column_text][/vc_column][/vc_row]
[vc_row][vc_column][vc_separator border_width=”5″][/vc_column][/vc_row]
[vc_row][vc_column][vc_column_text]
EURUSD
[/vc_column_text][/vc_column][/vc_row]
[vc_row][vc_column][vc_separator border_width=”5″][/vc_column][/vc_row][vc_row][vc_column width=”2/3″][vc_custom_heading text=”1 hr” use_theme_fonts=”yes”][vc_column_text]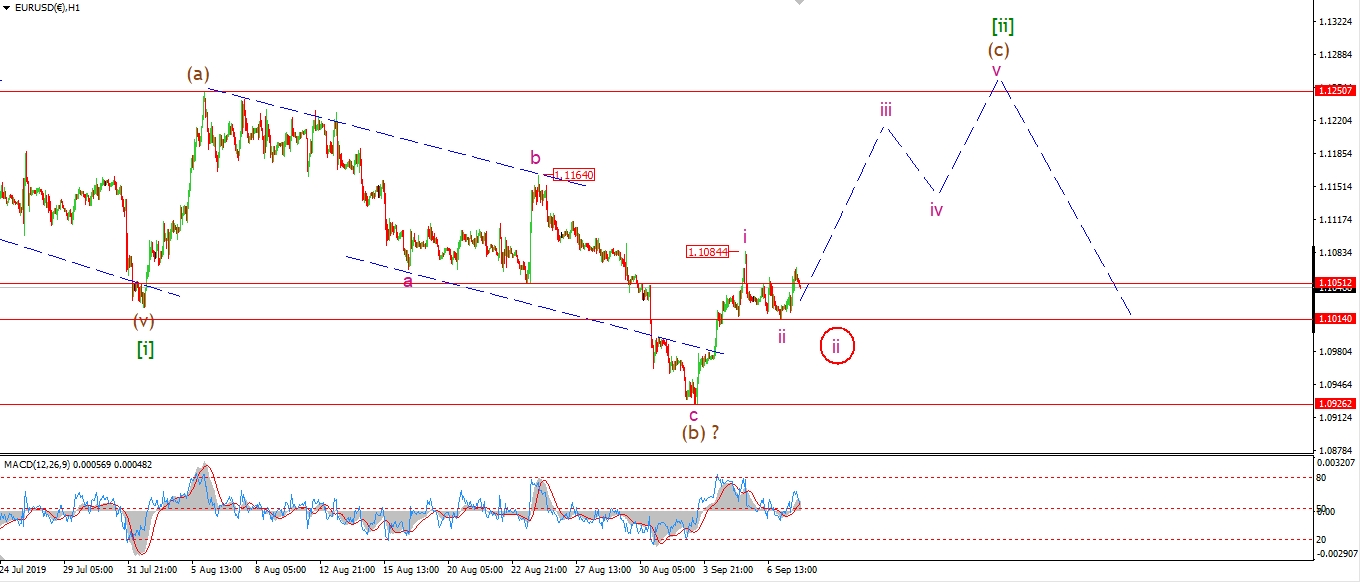 [/vc_column_text][/vc_column][vc_column width=”1/3″][vc_custom_heading text=”4 Hours” use_theme_fonts=”yes”][vc_column_text]
 [/vc_column_text][vc_custom_heading text=”Daily” use_theme_fonts=”yes”][vc_column_text]
 [/vc_column_text][/vc_column][/vc_row]
[vc_row][vc_column][vc_column_text]
EURUSD has edged higher out of a three wave correction.
It is hard to know if wave ‘ii’ is not done at the low of 1.1014 as a simple zigzag correction.
Or if wave ‘ii’ will develop further tomorrow as shown in the alternate count.
If the price continues higher tomorrow and breaks 1.1084,
that will be a good signal that wave ‘iii’ has begun.
But 1.1014 must hold in that case.
Tomorrow;
In both cases shown wave ‘iii’ up is expected this week,
and the larger wave (c) hosuld top out in the area of 1.1250.
Watch for 1.1014 to hold and wave ‘iii’ to push higher.
[/vc_column_text][/vc_column][/vc_row]
[vc_row][vc_column][vc_separator border_width=”5″][/vc_column][/vc_row][vc_row][vc_column][vc_column_text]
GBPUSD
[/vc_column_text][/vc_column][/vc_row][vc_row][vc_column][vc_separator border_width=”5″][/vc_column][/vc_row][vc_row][vc_column width=”2/3″][vc_custom_heading text=”1 hr” use_theme_fonts=”yes”][vc_column_text]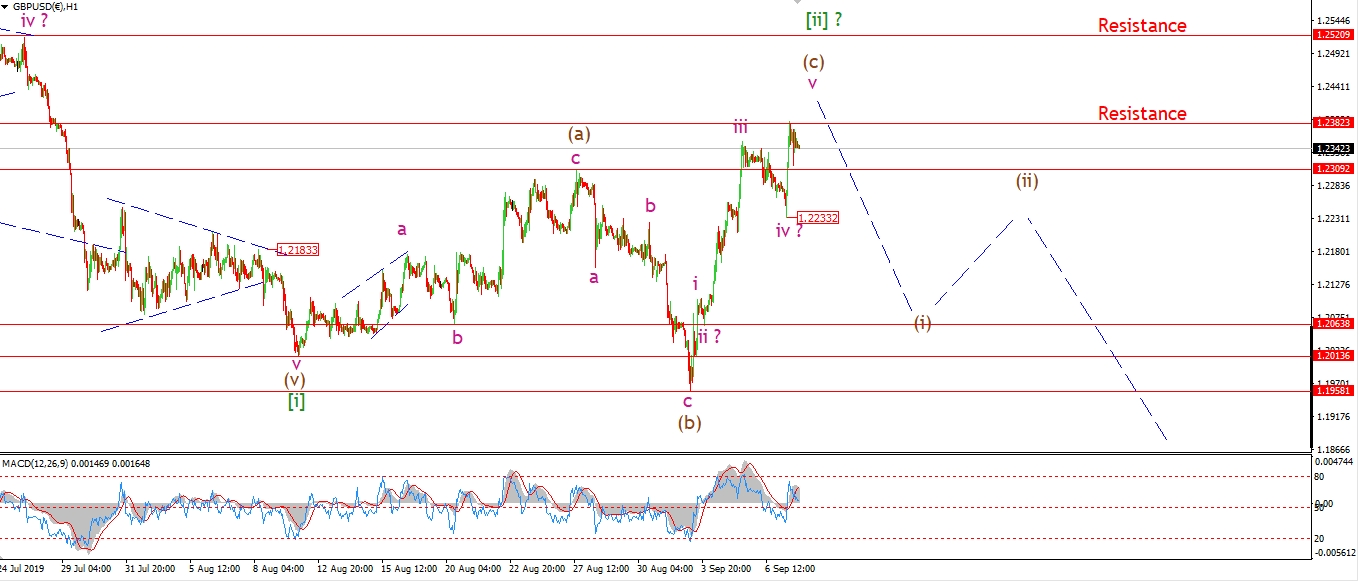 [/vc_column_text][/vc_column][vc_column width=”1/3″][vc_custom_heading text=”4 Hours” use_theme_fonts=”yes”][vc_column_text]
 [/vc_column_text][vc_custom_heading text=”Daily” use_theme_fonts=”yes”][vc_column_text]
 [/vc_column_text][/vc_column][/vc_row]
[vc_row][vc_column][vc_column_text]
Cable did give us another spike higher off a corrective wave ‘iv’ low this morning.
The price hit a weak resistance level at 1.2382
and has failed at that level so far.
so wave (c) is now looking near the end of its ride higher.
The only way the upper resistance level can be reached in wave (c) now,
is if wave ‘v’ of (c) creates an extension higher.
The low at wave ‘iv’ of 1.2233 must hold for that to happen.
Tomorrow.
I will be vigilant now in cable,
If 1.2233 breaks it will signal the end of this rally in wave (c) and wave [ii].
so that level is now key in the short term.
Watch for 1.2233 to hold and a break of resistance again if the extension in wave ‘v’ is to come.
[/vc_column_text][/vc_column][/vc_row]
[vc_row][vc_column][vc_separator border_width=”5″][/vc_column][/vc_row][vc_row][vc_column][vc_column_text]
USDJPY
[/vc_column_text][/vc_column][/vc_row][vc_row][vc_column][vc_separator border_width=”5″][/vc_column][/vc_row][vc_row][vc_column width=”2/3″][vc_custom_heading text=”1 hr” use_theme_fonts=”yes”][vc_column_text]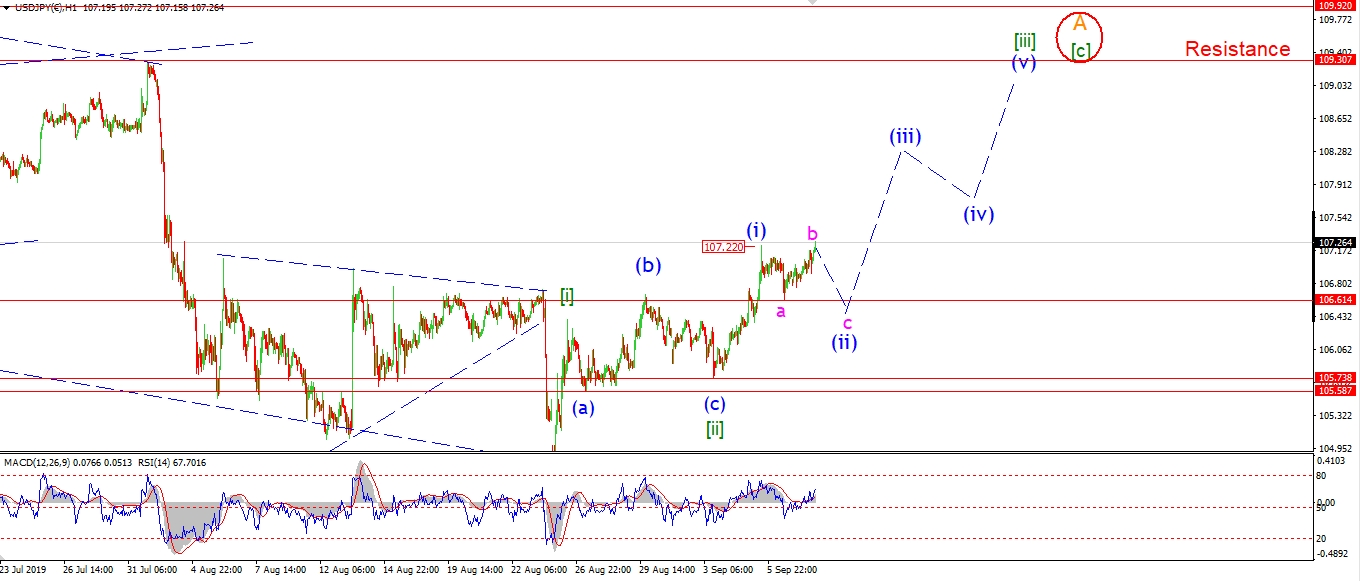 [/vc_column_text][/vc_column][vc_column width=”1/3″][vc_custom_heading text=”4 Hours” use_theme_fonts=”yes”][vc_column_text]
 [/vc_column_text][vc_custom_heading text=”Daily” use_theme_fonts=”yes”][vc_column_text]
 [/vc_column_text][/vc_column][/vc_row]
[vc_row][vc_column][vc_column_text]
USDJPY is higher off a three wave decline also today,
but the rise is not very impulsive looking at the moment.
I have shown the possibility of a larger correction in wave (ii) now underway.
With today’s high being wave ‘b’ of a flat correction.
If that is the case,
wave ‘c’ will fall below 106.61 again to complete wave (ii)
and then wave (iii) should begin with a break of 107.22.
Tomorrow;
Watch for wave ‘c’ of (ii) to complete with one more drop to 106.60.
105.73 must hold from now on.
[/vc_column_text][/vc_column][/vc_row]
[vc_row][vc_column][vc_separator border_width=”5″][/vc_column][/vc_row][vc_row][vc_column][vc_column_text]
DOW JONES INDUSTRIALS
[/vc_column_text][/vc_column][/vc_row][vc_row][vc_column][vc_separator border_width=”5″][/vc_column][/vc_row][vc_row][vc_column width=”2/3″][vc_custom_heading text=”1 hr” use_theme_fonts=”yes”][vc_column_text] [/vc_column_text][/vc_column][vc_column width=”1/3″][vc_custom_heading text=”4 Hours” use_theme_fonts=”yes”][vc_column_text]
 [/vc_column_text][vc_custom_heading text=”Daily” use_theme_fonts=”yes”][vc_column_text]
 [/vc_column_text][/vc_column][/vc_row]
[vc_row][vc_column][vc_column_text]
The DOW is lower off the final high for wave (c) this evening.
The price is ready to move sharply lower into wave [iii] now,
but first we need an impulsive decline to the downside
to signal the top is in for wave [ii].
Wave (i) down should begin this week
and I expect a decline back below 26000 in that move alone.
Wave ‘iv’ of (c) lies just below 26000,
so a break of that level should break the back of the rally!
Upside momentum has disappeared over the last few sessions.
With 4hr momentum topped out and beginning to turn down off an extreme level.
This should herald in the initial turn into wave (i).
Tomorrow;
Watch for wave ‘i’ of (i) to spike lower and end this correction in wave [ii] finally.
[/vc_column_text][/vc_column][/vc_row]
[vc_row][vc_column][vc_separator border_width=”5″][/vc_column][/vc_row][vc_row][vc_column][vc_column_text]
GOLD
[/vc_column_text][/vc_column][/vc_row][vc_row][vc_column][vc_separator border_width=”5″][/vc_column][/vc_row][vc_row][vc_column width=”2/3″][vc_custom_heading text=”1 hr” use_theme_fonts=”yes”][vc_column_text]
 [/vc_column_text][/vc_column][vc_column width=”1/3″][vc_custom_heading text=”4 Hours” use_theme_fonts=”yes”][vc_column_text]
 [/vc_column_text][vc_custom_heading text=”Daily” use_theme_fonts=”yes”][vc_column_text]
 [/vc_column_text][/vc_column][/vc_row]
[vc_row][vc_column][vc_column_text]
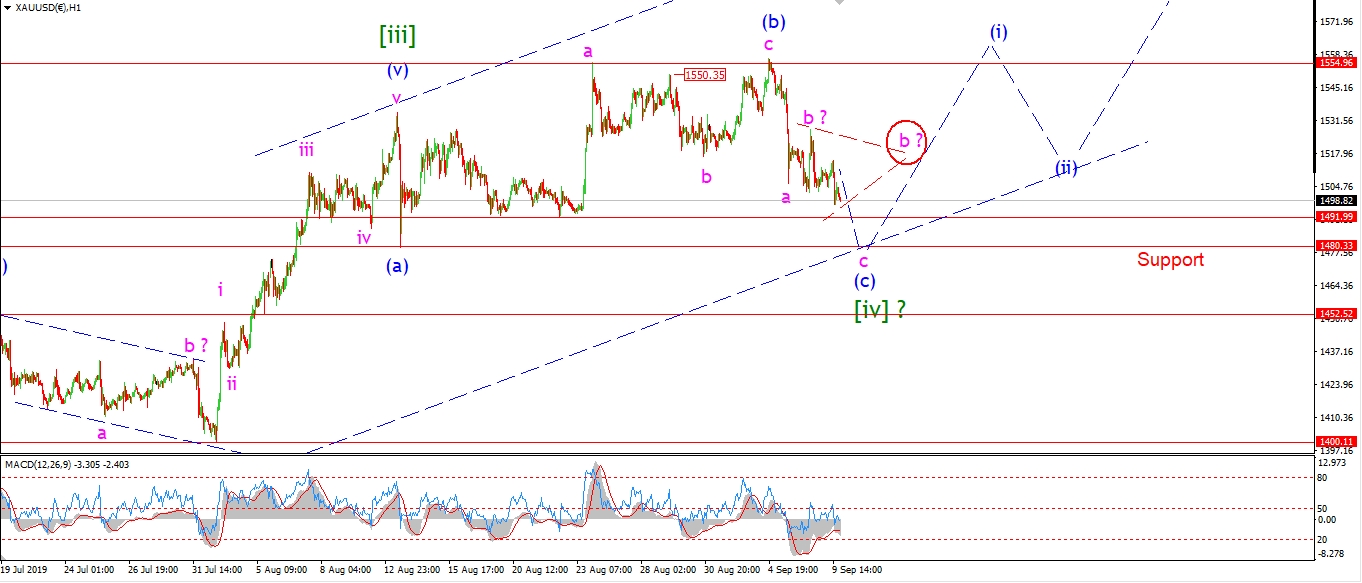
Gold moved lower today off the high set last Friday.
The price is now likely moving lower in wave ‘c’ of (c),
with the initial target set at 1480
where wave (c) will reach the low of wave (a).
So far the move off wave ‘b’ pink is in three waves,
so this leaves open the possibility that wave ‘b’ is still moving sideways in a triangle.
I have shown this option as the alternate count now.
Tomorrow;
Watch for wave ‘c’ to continue lower towards 1480 to complete the correction in wave [iv] over the coming days.
If we see a sideways trade tomorrow,
that will signal wave ‘b’ is tracing out a triangle.
[/vc_column_text][/vc_column][/vc_row]
[vc_row][vc_column][vc_separator border_width=”5″][/vc_column][/vc_row][vc_row][vc_column][vc_column_text]
U.S CRUDE OIL
[/vc_column_text][/vc_column][/vc_row][vc_row][vc_column][vc_separator border_width=”5″][/vc_column][/vc_row][vc_row][vc_column width=”2/3″][vc_custom_heading text=”1 hr” use_theme_fonts=”yes”][vc_column_text]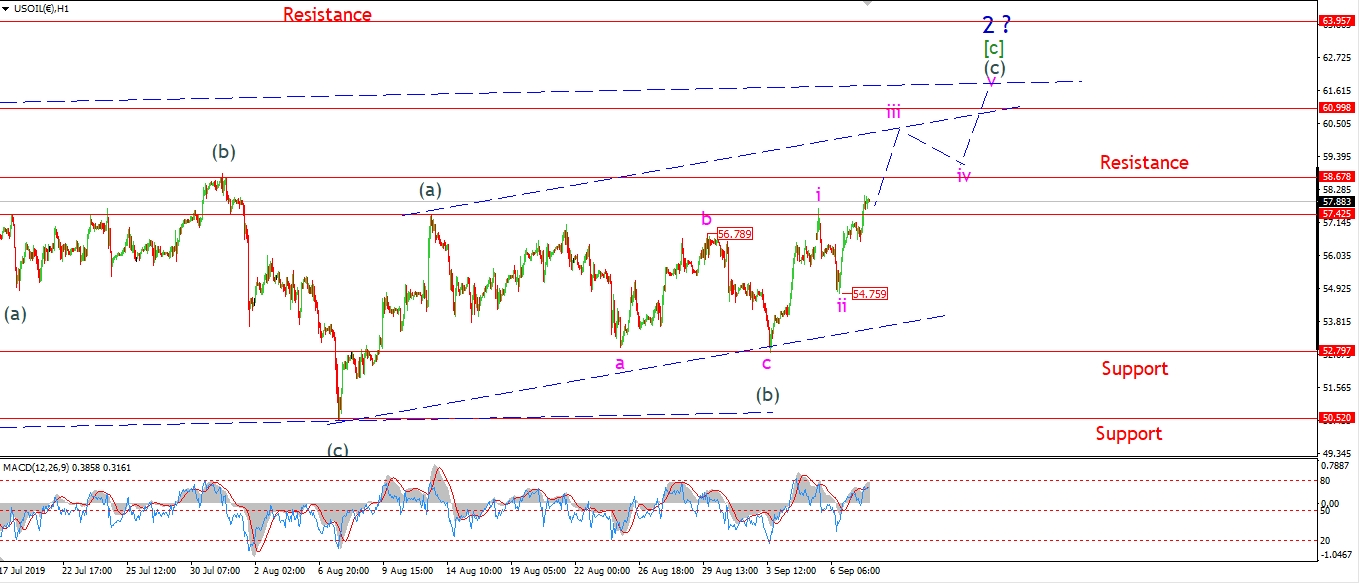 [/vc_column_text][/vc_column][vc_column width=”1/3″][vc_custom_heading text=”4 Hours” use_theme_fonts=”yes”][vc_column_text]
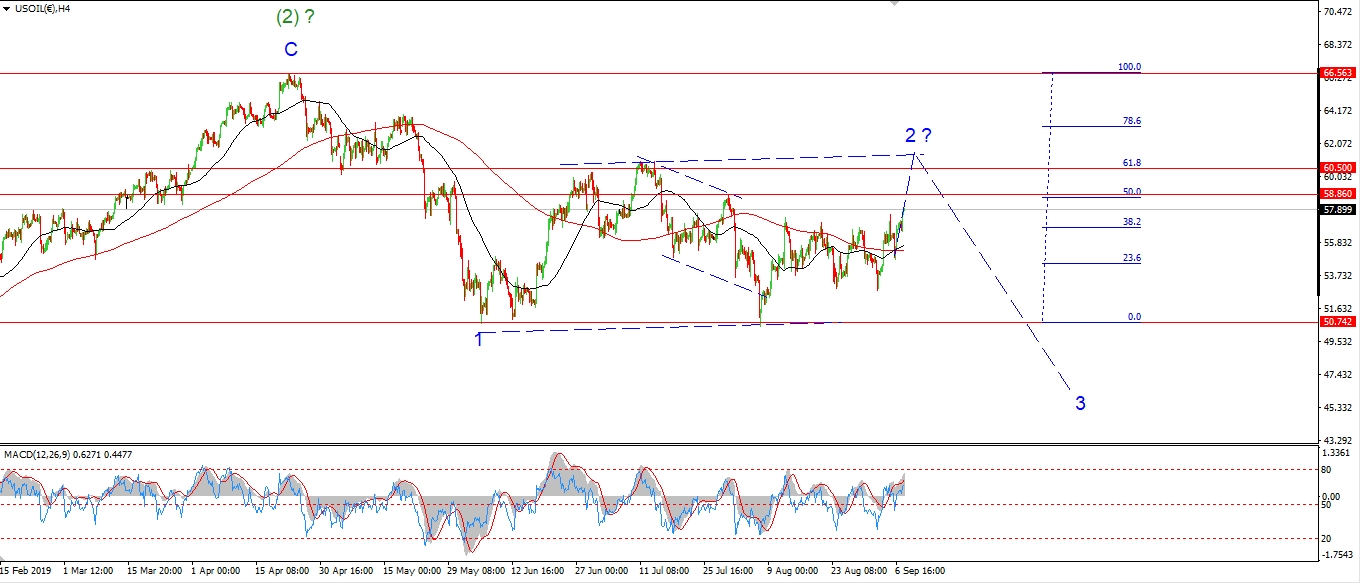 [/vc_column_text][vc_custom_heading text=”Daily” use_theme_fonts=”yes”][vc_column_text]
 [/vc_column_text][/vc_column][/vc_row]
[vc_row][vc_column][vc_column_text]
Wave ‘iii’ of (c) moved sharply higher off Fridays wave ‘ii’ low today.
This move also brought the price above the wave (a) high at 57.40.
This is the minimum target for wave (c) to complete,
but I do expect wave (c) to continue for the next few sessions yet.
If the short term count is correct,
then wave ‘iii’ of (c) is now set to carry price up to about 60.00 over the coming days.
Once we hit that level,
I will begin to look for another top to form in wave [c] of ‘2’ as shown.
The top in wave ‘2’ should lead to a long protracted decline in wave ‘3’ blue for the rest of the year.
Tomorrow;
Watch for wave ‘iii’ to continue towards the upper trend channel line.
Price must hold above 54.75 to stay bullish in the short term.
[/vc_column_text][/vc_column][/vc_row]
[vc_row][vc_column][vc_separator border_width=”5″][/vc_column][/vc_row][vc_row][vc_column][vc_column_text]
US 10 yr Treasuries.
[/vc_column_text][/vc_column][/vc_row][vc_row][vc_column][vc_separator border_width=”5″][/vc_column][/vc_row][vc_row][vc_column width=”2/3″][vc_custom_heading text=”1 hr” use_theme_fonts=”yes”][vc_column_text]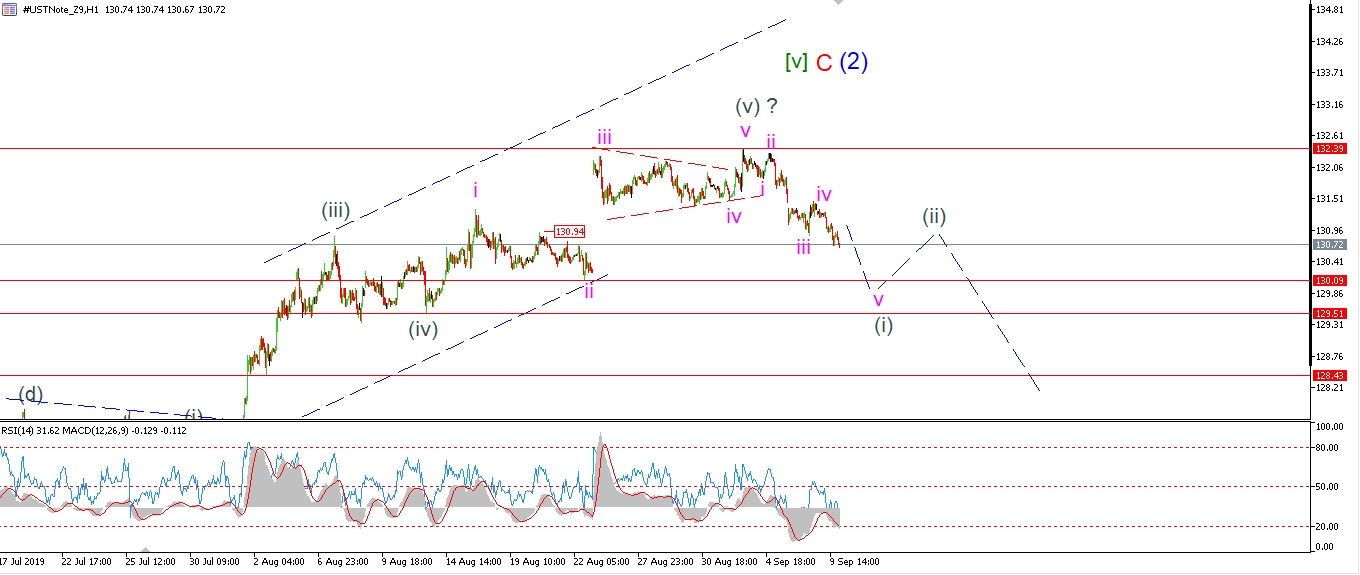 [/vc_column_text][/vc_column][vc_column width=”1/3″][vc_custom_heading text=”4 Hours” use_theme_fonts=”yes”][vc_column_text]
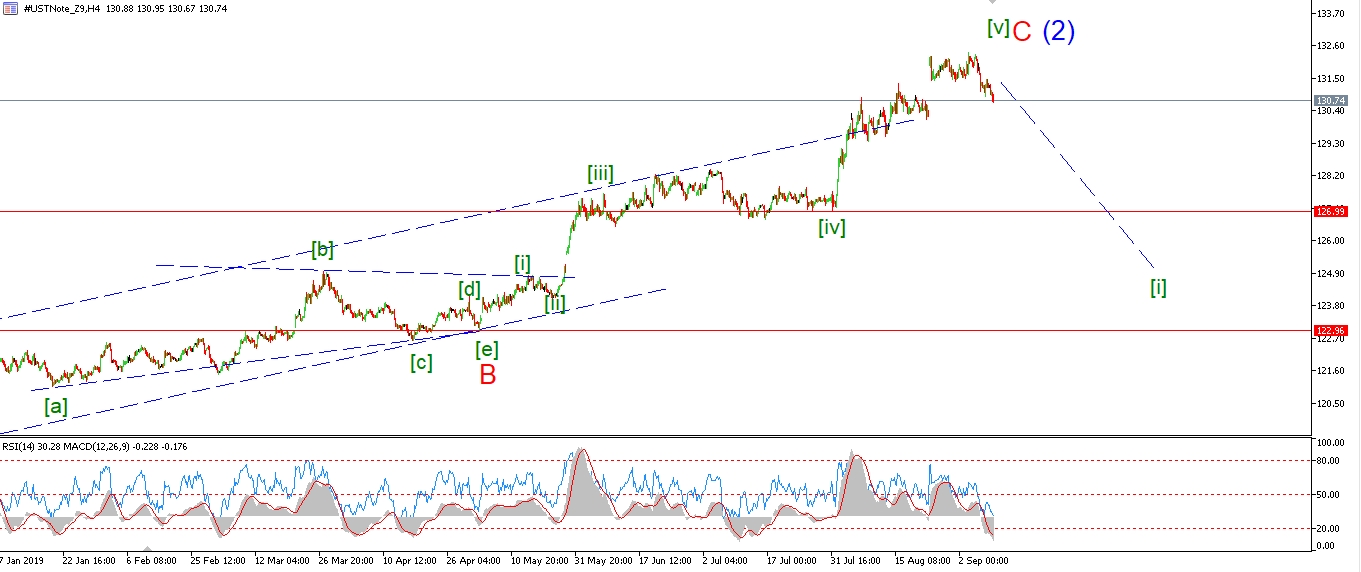 [/vc_column_text][vc_custom_heading text=”Daily” use_theme_fonts=”yes”][vc_column_text]
 [/vc_column_text][/vc_column][/vc_row]
[vc_row][vc_column][vc_column_text]
Bonds are lower again this evening which favors the bearish count for the moment.
I would like to see wave (i) continue lower to break 130.00 again this week.
That would break the low labelled wave ‘ii’ and rule out a larger five wave move higher in wave (v).
And then we might be onto something!
For now,
it is still a waiting game to see if a bearish signal forms off the recent top in waves (i) and (ii).
Tomorrow;
Watch for wave ‘v’ of (i) to break below 130.00 again.
[/vc_column_text][/vc_column][/vc_row]
[vc_row][vc_column][vc_separator border_width=”5″][/vc_column][/vc_row][vc_row][vc_column][vc_column_text]
SILVER
[/vc_column_text][/vc_column][/vc_row][vc_row][vc_column][vc_separator border_width=”5″][/vc_column][/vc_row][vc_row][vc_column width=”2/3″][vc_custom_heading text=”1 hr” use_theme_fonts=”yes”][vc_column_text]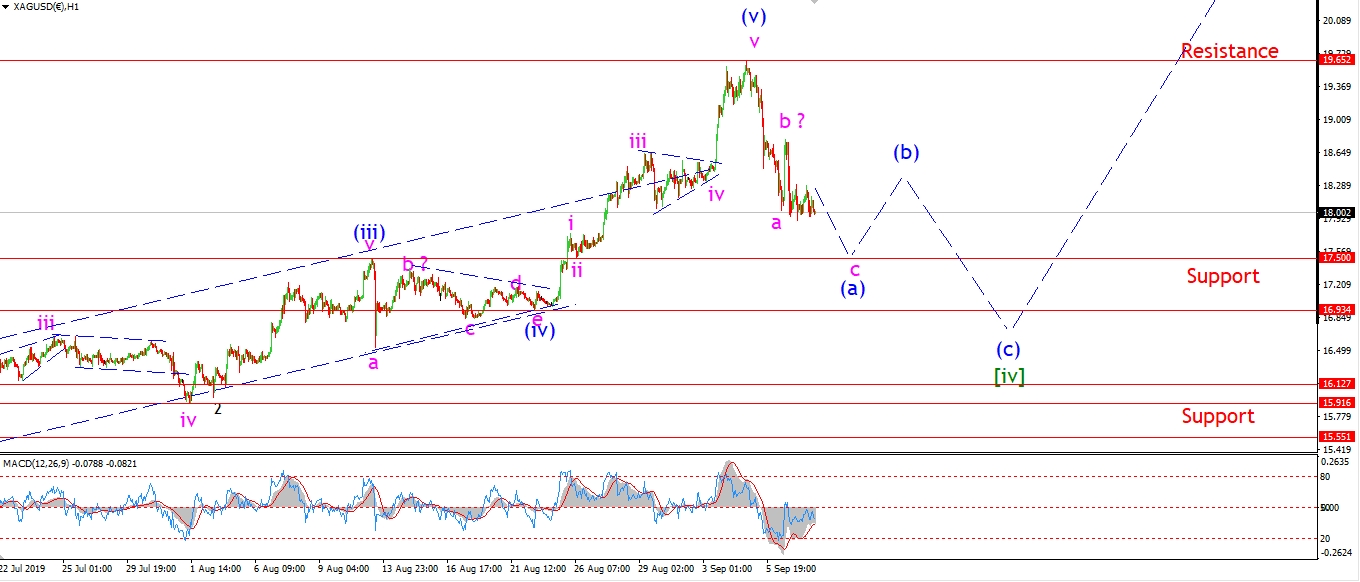 [/vc_column_text][/vc_column][vc_column width=”1/3″][vc_custom_heading text=”4 Hours” use_theme_fonts=”yes”][vc_column_text]
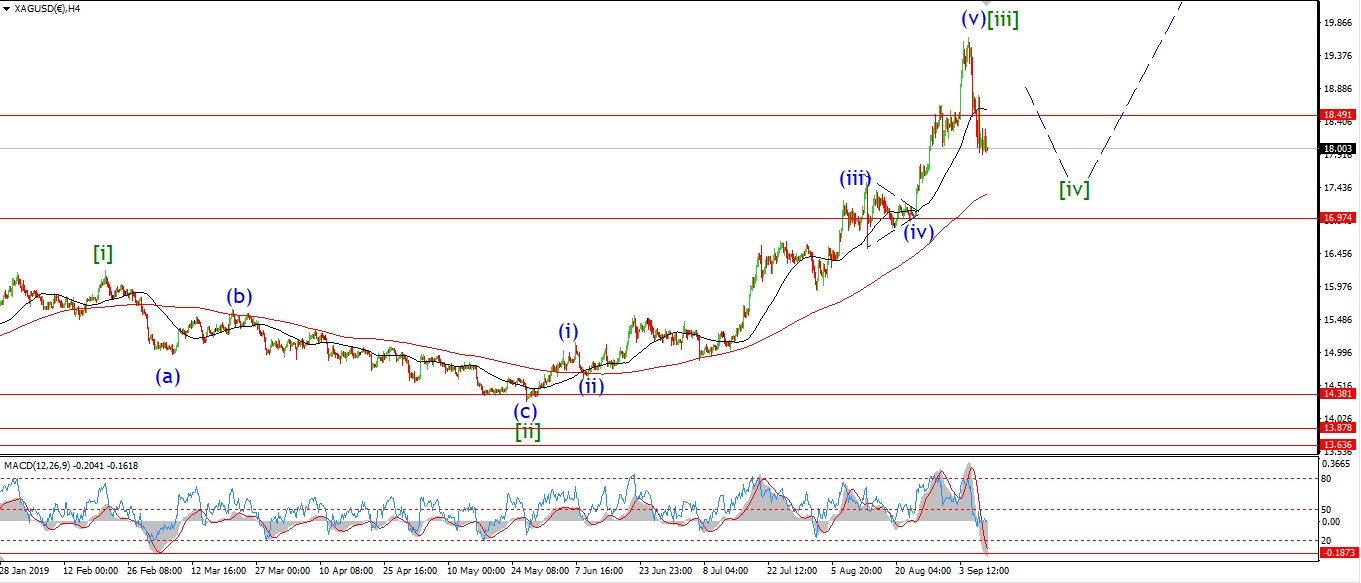 [/vc_column_text][vc_custom_heading text=”Daily” use_theme_fonts=”yes”][vc_column_text]
 [/vc_column_text][/vc_column][/vc_row]
[vc_row][vc_column][vc_column_text]
Silver is lower today off a possible wave ‘b’ high set on Friday.
I think wave ‘c’ should continue lower for the next few days in a three wave form at least.
This will complete wave (a) of [iv].
And wave (b) will then rally again to a lower high as shown.
It is still early days in wave [iv] and there is no clear path yet for the action.
But the action this week should be enough give us a better idea
of what form wave [iv] will take.
Tomorrow;
Watch for wave ‘c’ of (a) to continue towards support at 17.50.
[/vc_column_text][/vc_column][/vc_row]
[vc_row][vc_column][vc_separator border_width=”5″][/vc_column][/vc_row][vc_row][vc_column][vc_column_text]
S&P 500.
[/vc_column_text][/vc_column][/vc_row][vc_row][vc_column][vc_separator border_width=”5″][/vc_column][/vc_row][vc_row][vc_column width=”2/3″][vc_custom_heading text=”1 hr” use_theme_fonts=”yes”][vc_column_text]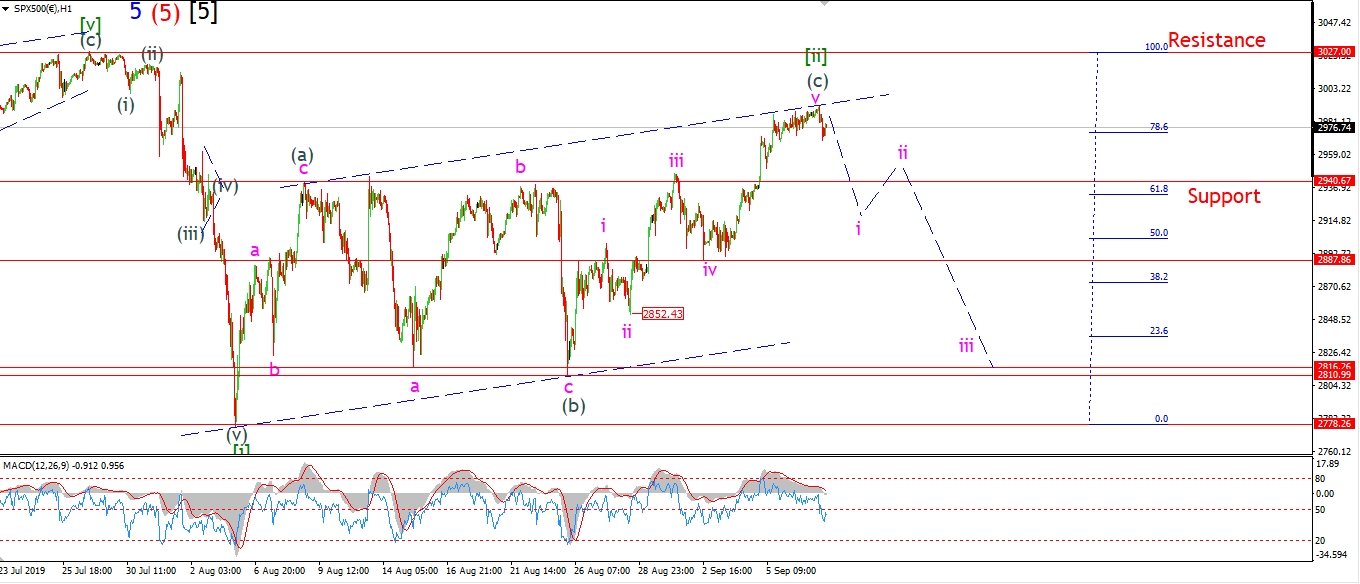 [/vc_column_text][/vc_column][vc_column width=”1/3″][vc_custom_heading text=”4 Hours” use_theme_fonts=”yes”][vc_column_text]
 [/vc_column_text][vc_custom_heading text=”Daily” use_theme_fonts=”yes”][vc_column_text]
 [/vc_column_text][/vc_column][/vc_row]
[vc_row][vc_column][vc_column_text]
Prices have brushed up against the upper trend channel line today to complete wave ‘v’ of (c).
This rally is exhausted now,
and this is best illustrated by the 4hr momentum indicators.
Both RSI and MACD have topped out at extremes
and are moving lower again over the last few days.
Prices have moved lower this evening off that high.
If I am correct here,
this should be the first move lower in wave ‘i’ of (i) of [iii].
If this decline continues tomorrow and breaks 2940 again,
that will strongly favor the idea that a top is in for wave [ii].
Tomorrow;
Watch for wave ‘i’ down to continue in five waves.
lets see if 2940 breaks before completing a lower high in wave ‘ii’ by the middle of the week.
[/vc_column_text][/vc_column][/vc_row]
[vc_row][vc_column][vc_separator border_width=”5″][/vc_column][/vc_row]