
[vc_row][vc_column][vc_separator border_width=”5″][/vc_column][/vc_row]
[vc_row][vc_column][vc_column_text]
Good evening folks,
The video is done and posted so have a look at that if you are not heading to the pub!
Down to business.
[/vc_column_text][/vc_column][/vc_row]
[vc_row][vc_column][vc_separator border_width=”5″][/vc_column][/vc_row]
[vc_row][vc_column][vc_column_text]
EURUSD
[/vc_column_text][/vc_column][/vc_row]
[vc_row][vc_column][vc_separator border_width=”5″][/vc_column][/vc_row][vc_row][vc_column width=”2/3″][vc_custom_heading text=”1 hr” use_theme_fonts=”yes”][vc_column_text]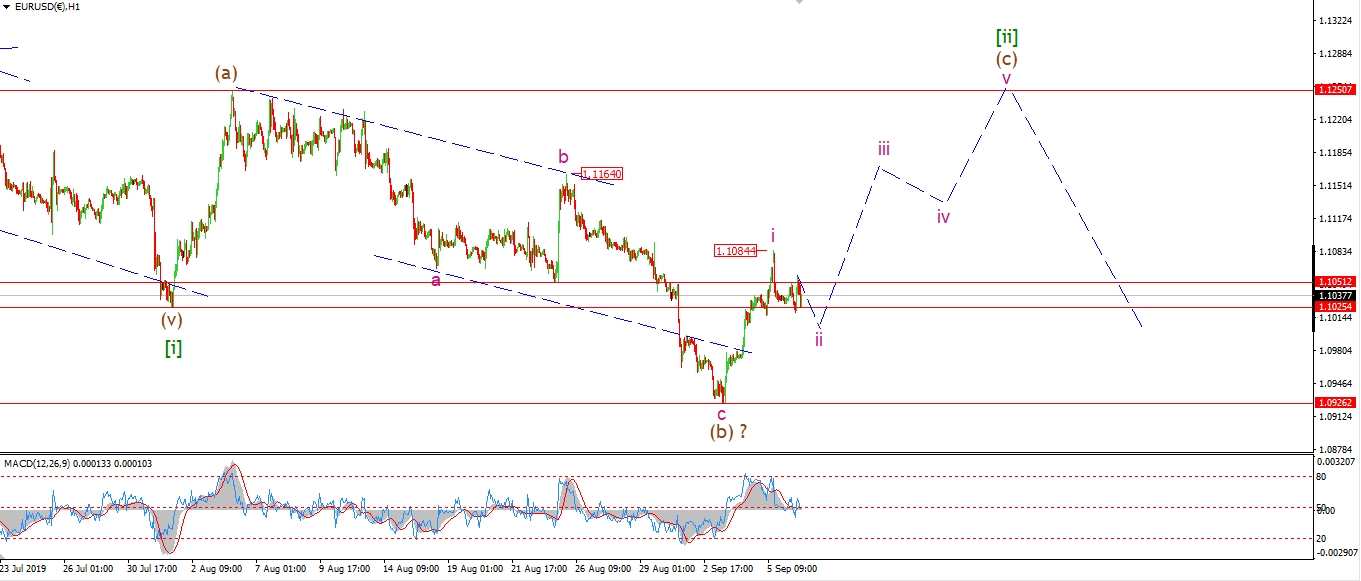 [/vc_column_text][/vc_column][vc_column width=”1/3″][vc_custom_heading text=”4 Hours” use_theme_fonts=”yes”][vc_column_text]
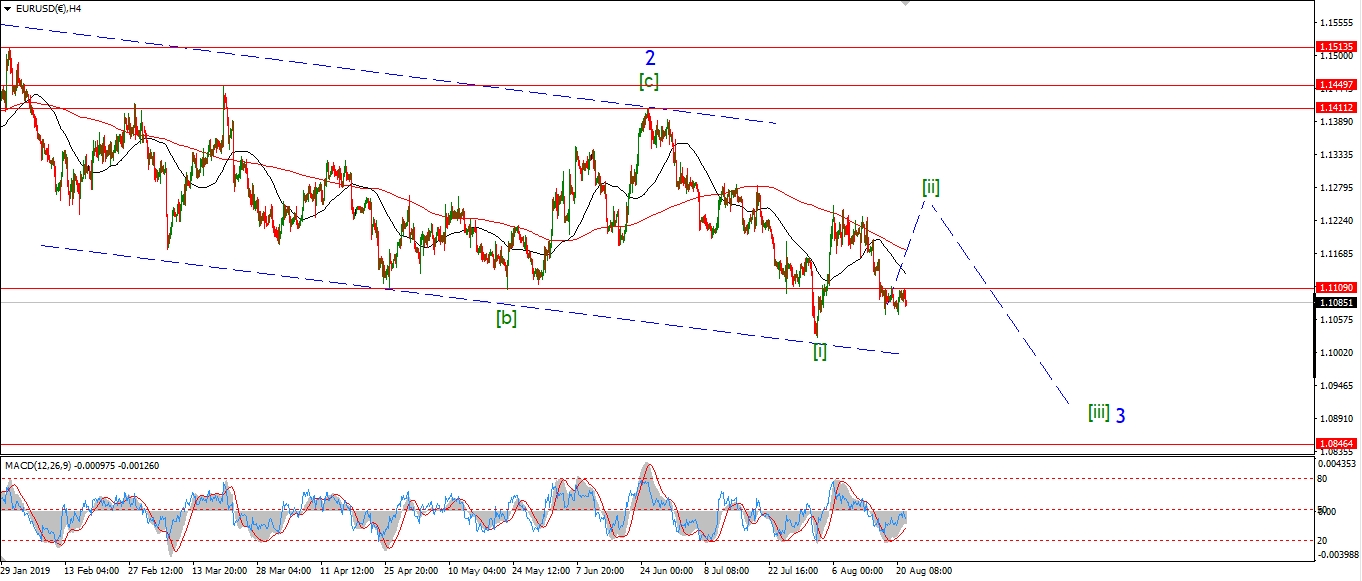 [/vc_column_text][vc_custom_heading text=”Daily” use_theme_fonts=”yes”][vc_column_text]
 [/vc_column_text][/vc_column][/vc_row]
[vc_row][vc_column][vc_column_text]
Wave ‘ii’ is well underway now off Thursdays high.
I dont think the three wave pattern is done just yet.
Price seems to be falling again as we approach the end of the session,
so one more low at about 109.80 will do the trick.
That will complete an impulse wave higher and setup for wave ‘iii’ to begin on Monday.
Next week;
Watch for wave ‘ii’ to complete and wave ‘iii’ to return higher again on Monday.
A break of 1.1084 will confirm wave ‘iii’ has begun.
1.0926 must hold.
[/vc_column_text][/vc_column][/vc_row]
[vc_row][vc_column][vc_separator border_width=”5″][/vc_column][/vc_row][vc_row][vc_column][vc_column_text]
GBPUSD
[/vc_column_text][/vc_column][/vc_row][vc_row][vc_column][vc_separator border_width=”5″][/vc_column][/vc_row][vc_row][vc_column width=”2/3″][vc_custom_heading text=”1 hr” use_theme_fonts=”yes”][vc_column_text]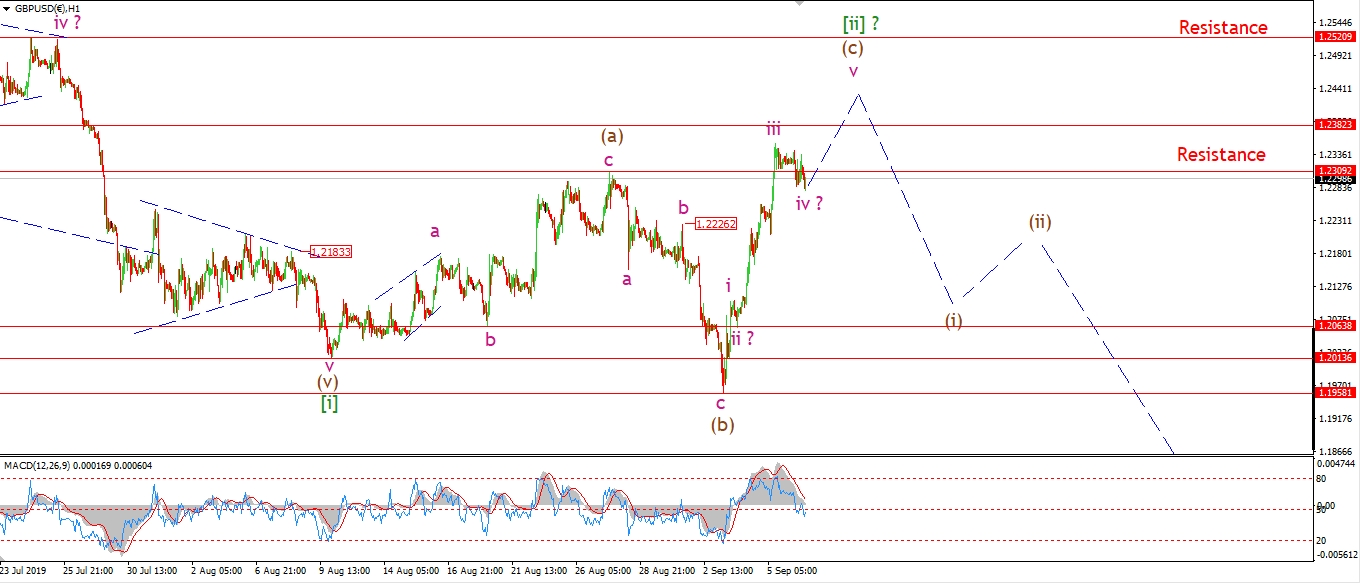 [/vc_column_text][/vc_column][vc_column width=”1/3″][vc_custom_heading text=”4 Hours” use_theme_fonts=”yes”][vc_column_text]
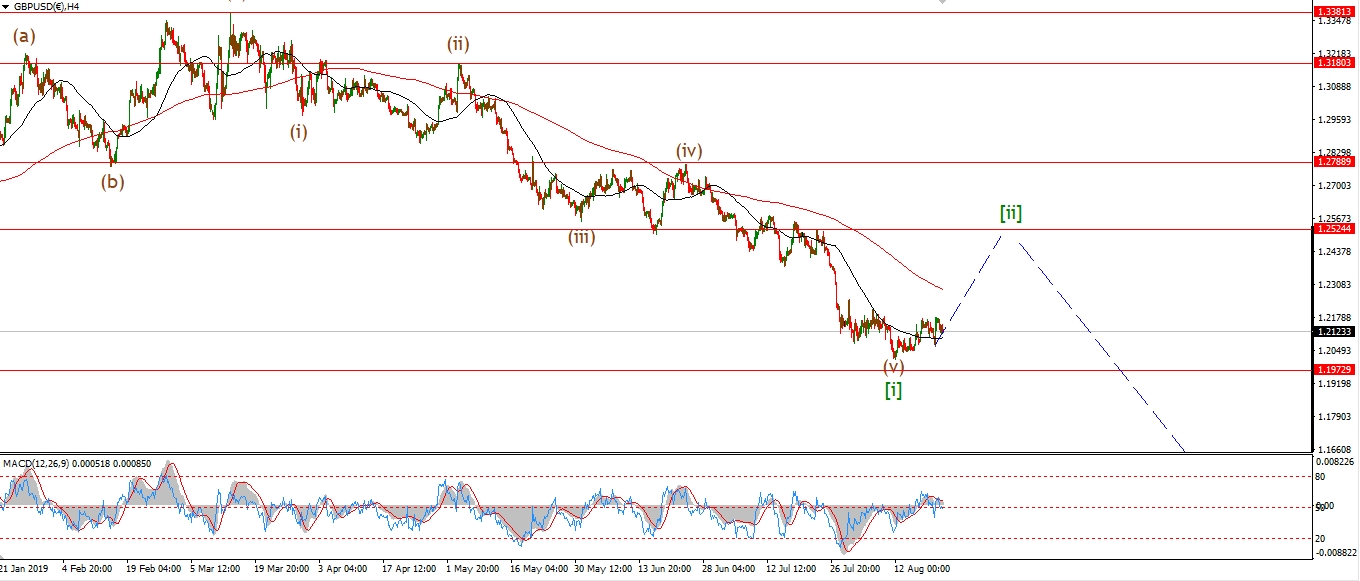 [/vc_column_text][vc_custom_heading text=”Daily” use_theme_fonts=”yes”][vc_column_text]
 [/vc_column_text][/vc_column][/vc_row]
[vc_row][vc_column][vc_column_text]
Cable has just drifted sideways over the last few sessions,
this indicates wave (c) is incomplete just yet.
So we should see a further rally on Monday in wave ‘v’ of (c).
1.2520 is still an attractive level in my mind,
as this is right in the area of a triangle within the previous decline,
and it is just above the 38.2% retracement level of wave [i].
Monday;
Watch for wave (c) to continue higher in wave ‘v’ of (c).
Wave ‘iv’ should complete around 1.2226.
[/vc_column_text][/vc_column][/vc_row]
[vc_row][vc_column][vc_separator border_width=”5″][/vc_column][/vc_row][vc_row][vc_column][vc_column_text]
USDJPY
[/vc_column_text][/vc_column][/vc_row][vc_row][vc_column][vc_separator border_width=”5″][/vc_column][/vc_row][vc_row][vc_column width=”2/3″][vc_custom_heading text=”1 hr” use_theme_fonts=”yes”][vc_column_text]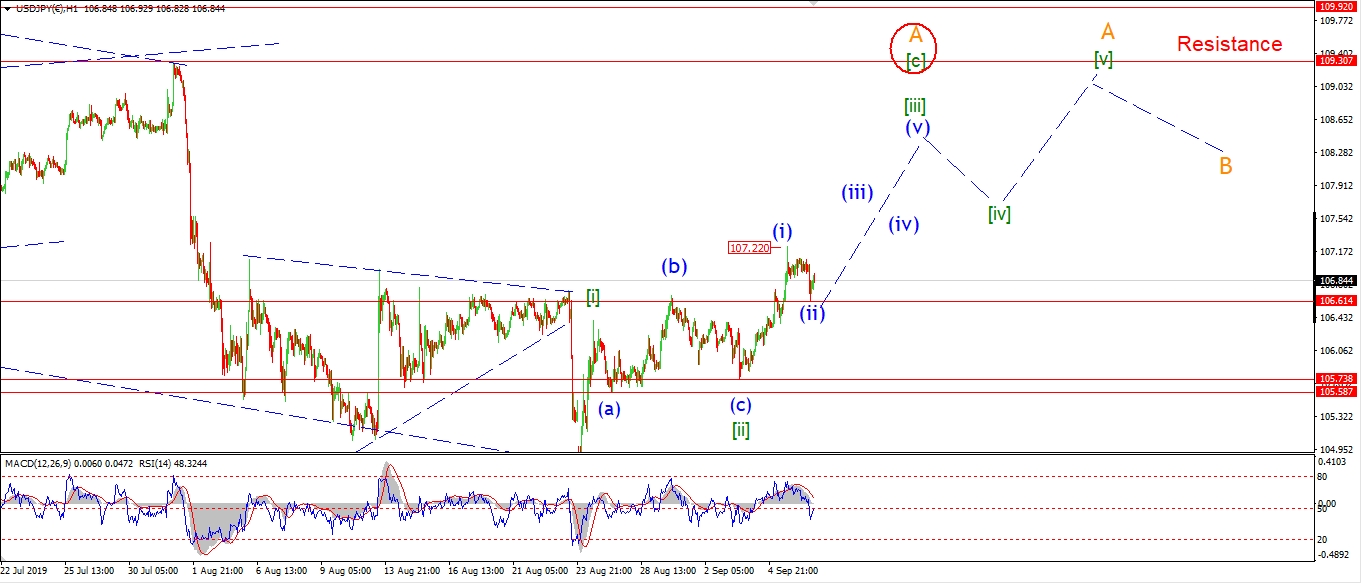 [/vc_column_text][/vc_column][vc_column width=”1/3″][vc_custom_heading text=”4 Hours” use_theme_fonts=”yes”][vc_column_text]
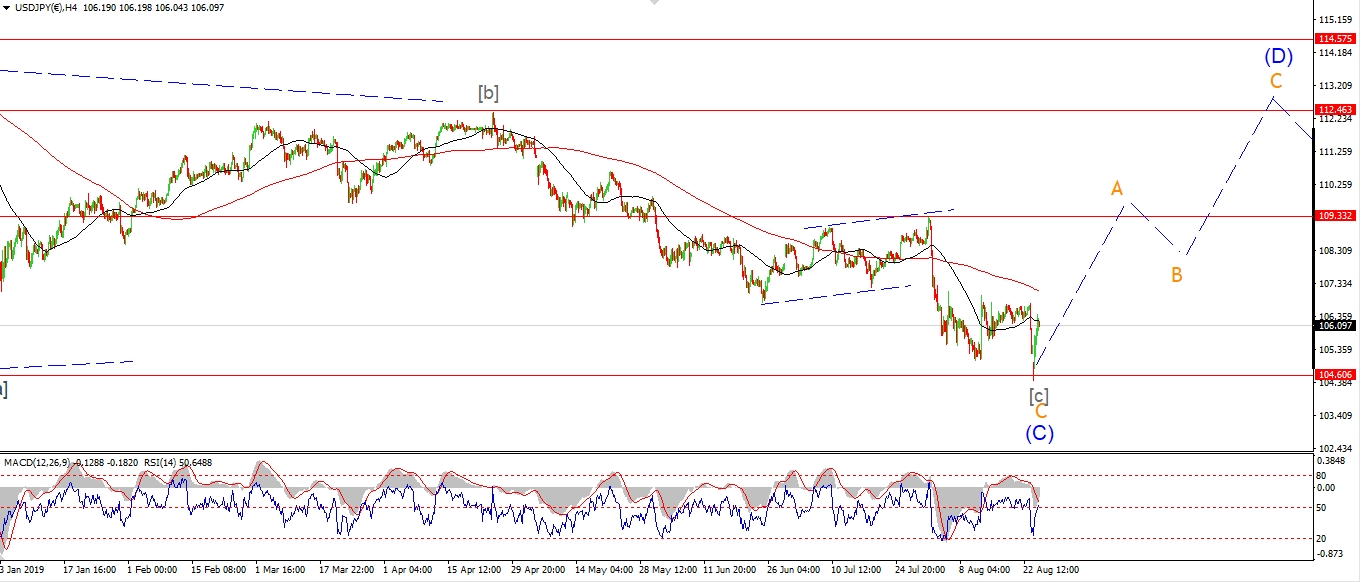 [/vc_column_text][vc_custom_heading text=”Daily” use_theme_fonts=”yes”][vc_column_text]
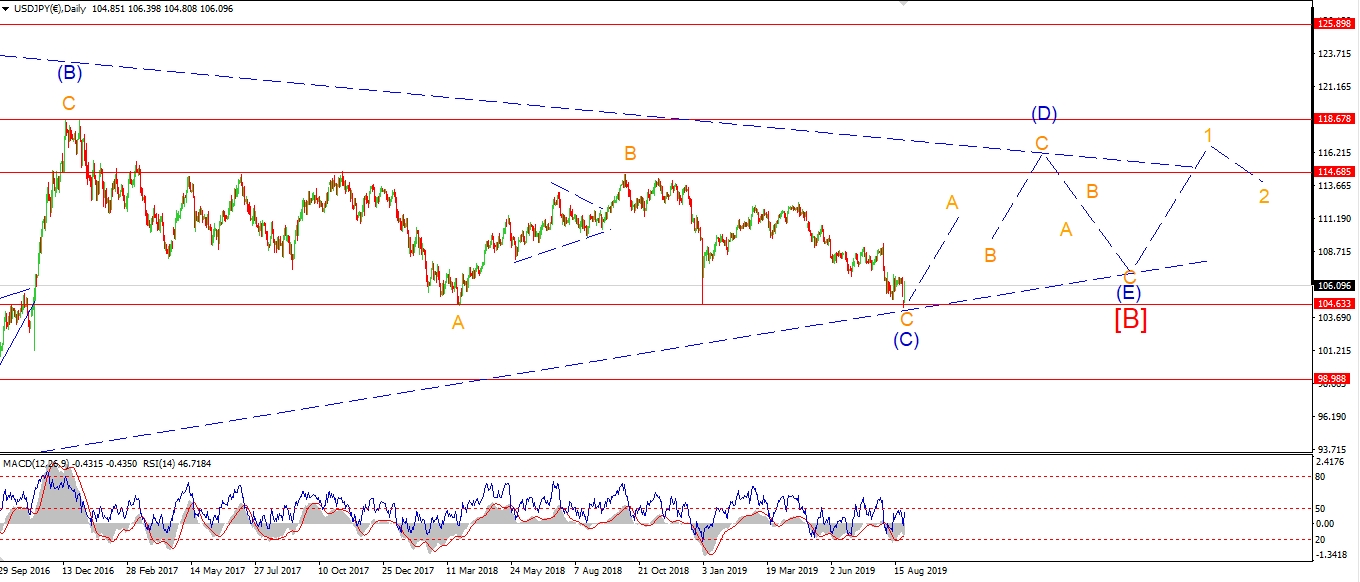 [/vc_column_text][/vc_column][/vc_row]
[vc_row][vc_column][vc_column_text]
I have shown the alternate wave count on the short term chart.
It is simply a variation of the pattern higher in wave (D).
Where wave ‘A’ of (D) traces out a three wave rally rather than a five wave rally.
Both counts call for a continuation higher over the coming weeks in wave (D),
so it does not change the outlook.
The price has fallen today in a three wave form in wave (ii) blue.
And again we have seen a spike off the low,
it is possible that wave (iii) is now underway off the session low.
Monday;
watch for 106.61 to hold and for price to break 107.22 to confirm wave (iii).
[/vc_column_text][/vc_column][/vc_row]
[vc_row][vc_column][vc_separator border_width=”5″][/vc_column][/vc_row][vc_row][vc_column][vc_column_text]
DOW JONES INDUSTRIALS
[/vc_column_text][/vc_column][/vc_row][vc_row][vc_column][vc_separator border_width=”5″][/vc_column][/vc_row][vc_row][vc_column width=”2/3″][vc_custom_heading text=”1 hr” use_theme_fonts=”yes”][vc_column_text]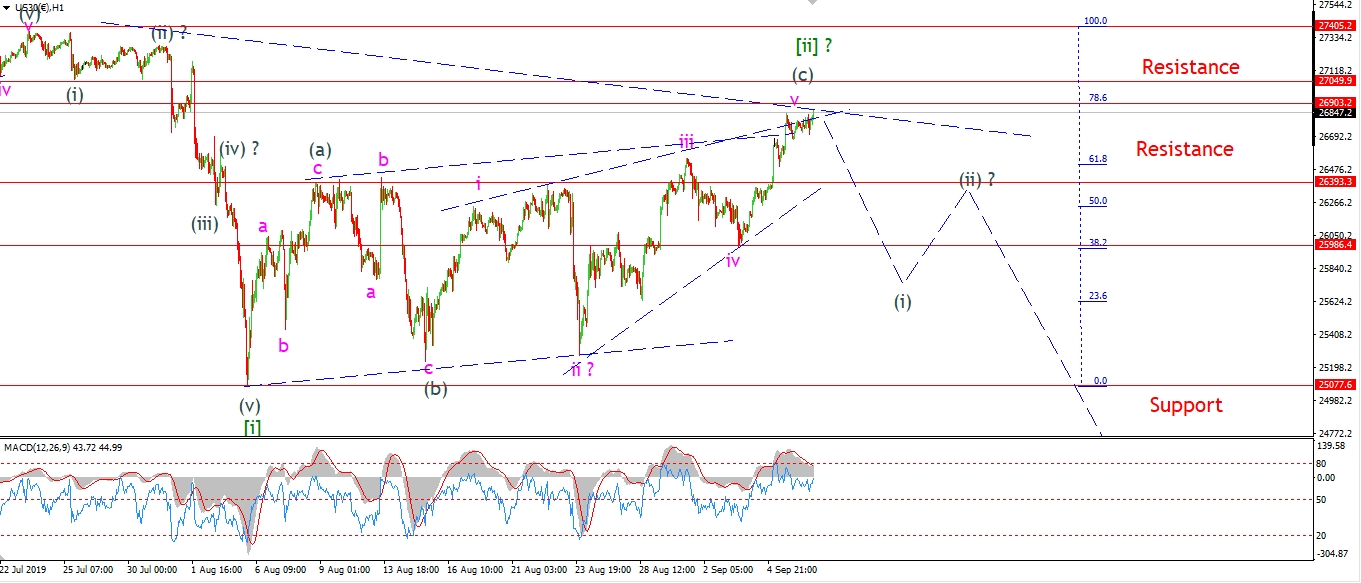 [/vc_column_text][/vc_column][vc_column width=”1/3″][vc_custom_heading text=”4 Hours” use_theme_fonts=”yes”][vc_column_text]
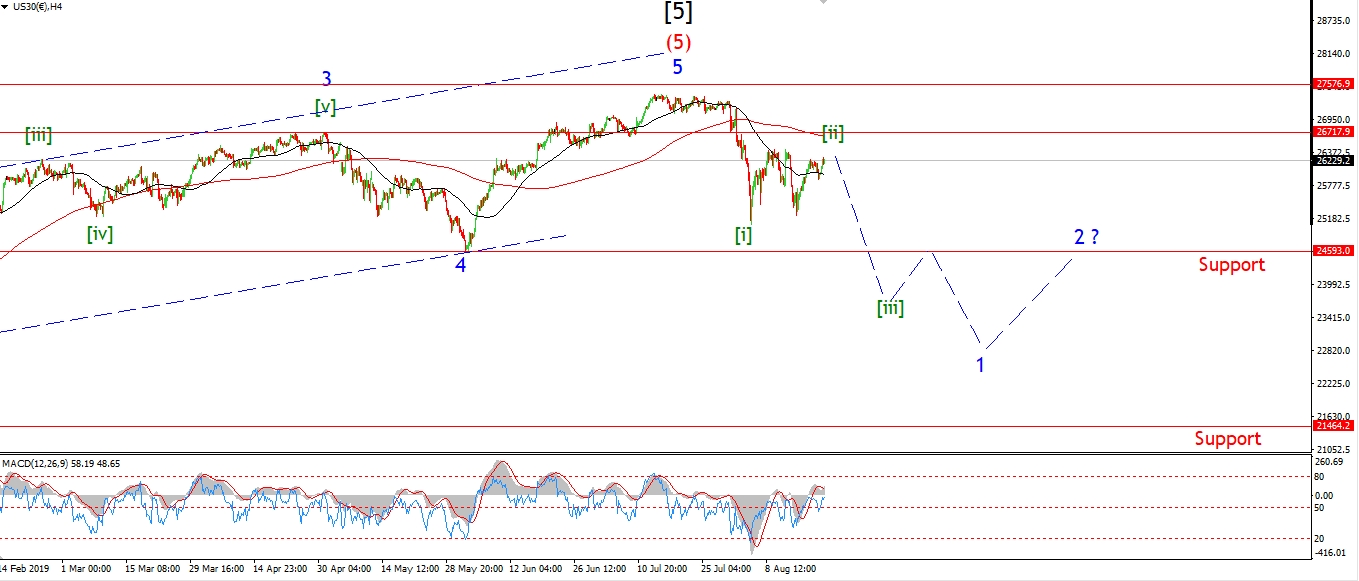 [/vc_column_text][vc_custom_heading text=”Daily” use_theme_fonts=”yes”][vc_column_text]
 [/vc_column_text][/vc_column][/vc_row]
[vc_row][vc_column][vc_column_text]
Just to clarify,
I think this rally is a correction higher in wave [ii].
And I am as sure about that as you can be in the markets!
So wave [iii] down is going to be a heart breaker for the bulls.
This evening I have switched to the wave count I showed on the video earlier today.
There is no material difference in the outlook,
but the larger ending diagonal does fit the action a little better.
Wave (c) has stalled today and upside momentum has dropped markedly.
On the hourly chart,
you can see the divergence in momentum developing before your eyes since wave ‘iii’ of (c).
The price is now in the territory of the 78.6% retracement of wave [i] down.
And now wave [iii] is calling.
Next week.
This correction has gone on far too long in my estimation
and it is about time we saw a serious decline in wave [iii].
Watch for wave (i) of [iii] to begin early next week.
A break of 26000 should confirm wave (i) has begun.
[/vc_column_text][/vc_column][/vc_row]
[vc_row][vc_column][vc_separator border_width=”5″][/vc_column][/vc_row][vc_row][vc_column][vc_column_text]
GOLD
[/vc_column_text][/vc_column][/vc_row][vc_row][vc_column][vc_separator border_width=”5″][/vc_column][/vc_row][vc_row][vc_column width=”2/3″][vc_custom_heading text=”1 hr” use_theme_fonts=”yes”][vc_column_text]
 [/vc_column_text][/vc_column][vc_column width=”1/3″][vc_custom_heading text=”4 Hours” use_theme_fonts=”yes”][vc_column_text]
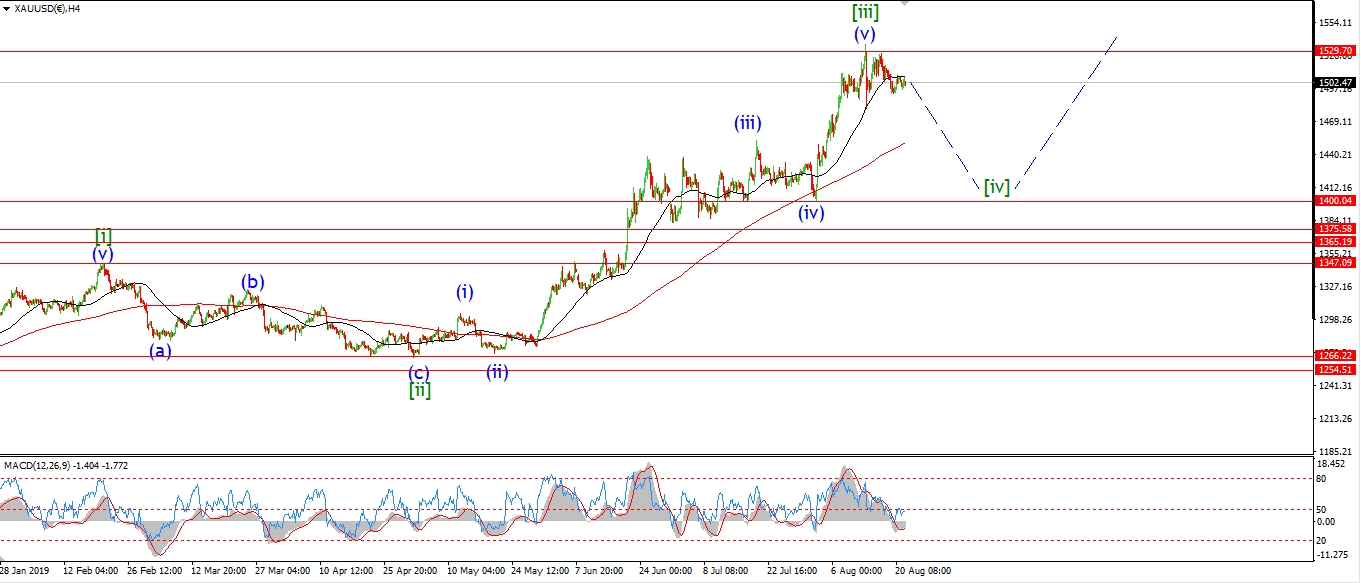 [/vc_column_text][vc_custom_heading text=”Daily” use_theme_fonts=”yes”][vc_column_text]
 [/vc_column_text][/vc_column][/vc_row]
[vc_row][vc_column][vc_column_text]
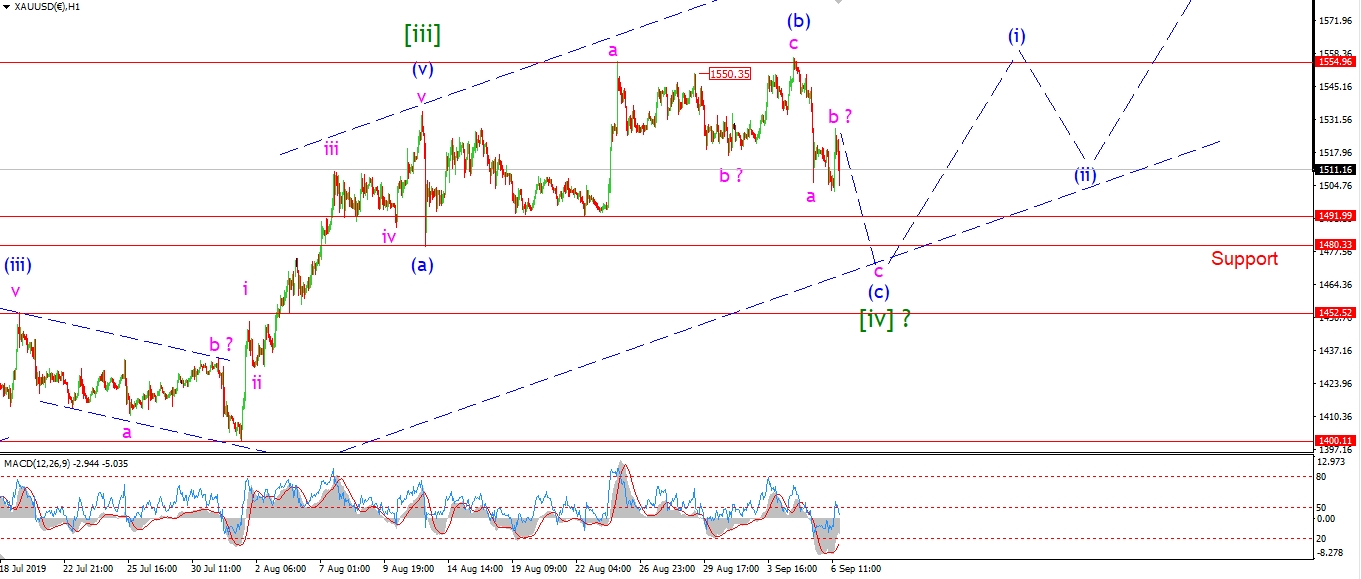
As always with corrections,
they are darn hard to nail down!
After a short relief rally today,
Gold is selling off again this evening
and this selloff should continue into next week.
I have also switched to an another interpretation for wave (c) this evening.
This involves a three wave decline in wave (c)
rather than a simple five wave drop.
In this interpretation wave [iv] is tracing out a complex flat correction.
Todays upside correction is labelled wave ‘b’ of (c),
and this should be followed on Monday by wave ‘c’ of (c).
Monday;
Wave (c) should complete early next week.
And if the larger wave [iv] is done at that point,
then wave [v] should begin next week also.
Watch for wave [iv] to complete in the area of 1480 early next week.
[/vc_column_text][/vc_column][/vc_row]
[vc_row][vc_column][vc_separator border_width=”5″][/vc_column][/vc_row][vc_row][vc_column][vc_column_text]
U.S CRUDE OIL
[/vc_column_text][/vc_column][/vc_row][vc_row][vc_column][vc_separator border_width=”5″][/vc_column][/vc_row][vc_row][vc_column width=”2/3″][vc_custom_heading text=”1 hr” use_theme_fonts=”yes”][vc_column_text]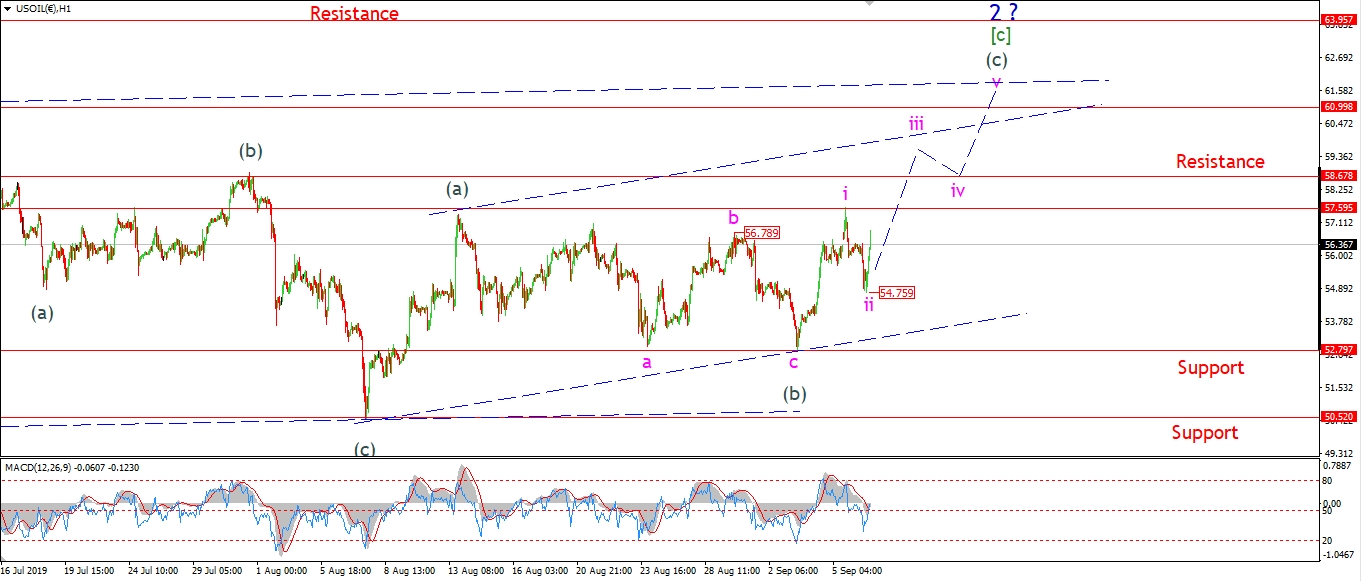 [/vc_column_text][/vc_column][vc_column width=”1/3″][vc_custom_heading text=”4 Hours” use_theme_fonts=”yes”][vc_column_text]
 [/vc_column_text][vc_custom_heading text=”Daily” use_theme_fonts=”yes”][vc_column_text]
 [/vc_column_text][/vc_column][/vc_row]
[vc_row][vc_column][vc_column_text]
Crude oil completed a three wave decline to a higher low at 54.75 this afternoon.
The price has rallied off that low this evening,
and this should be the beginning of wave ‘iii’ of (c) which should continue higher next week.
Wave (c) is set to rally up to about 61.00 again over the coming week,
and that rally should be enough to complete a large wave ‘2’ blue as shown.
Monday;
watch for price to hold above the wave ‘ii’ low.
Wave ‘iii’ will be confirmed with a break of 57.60 again.
[/vc_column_text][/vc_column][/vc_row]
[vc_row][vc_column][vc_separator border_width=”5″][/vc_column][/vc_row][vc_row][vc_column][vc_column_text]
US 10 yr Treasuries.
[/vc_column_text][/vc_column][/vc_row][vc_row][vc_column][vc_separator border_width=”5″][/vc_column][/vc_row][vc_row][vc_column width=”2/3″][vc_custom_heading text=”1 hr” use_theme_fonts=”yes”][vc_column_text]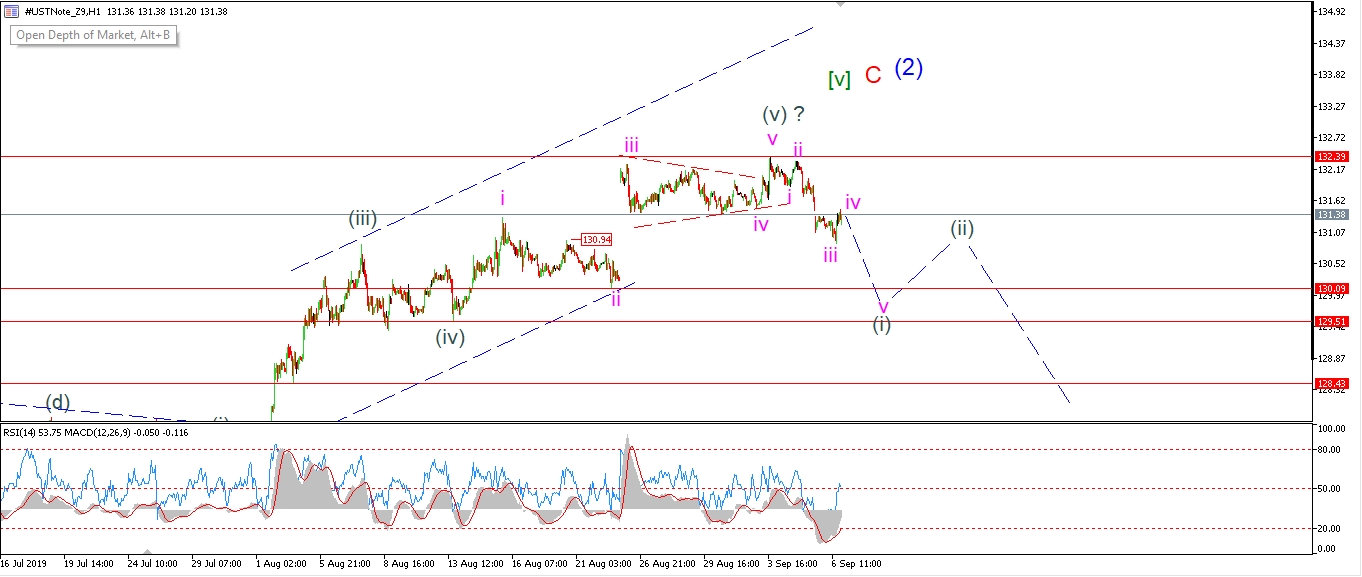 [/vc_column_text][/vc_column][vc_column width=”1/3″][vc_custom_heading text=”4 Hours” use_theme_fonts=”yes”][vc_column_text]
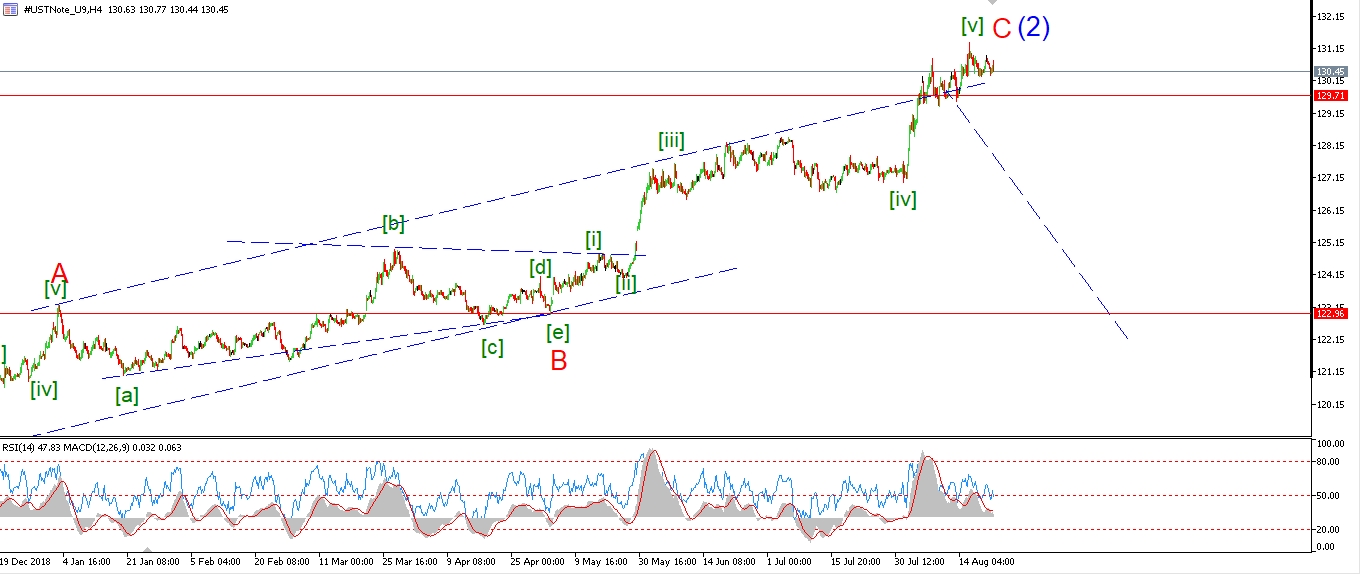 [/vc_column_text][vc_custom_heading text=”Daily” use_theme_fonts=”yes”][vc_column_text]
 [/vc_column_text][/vc_column][/vc_row]
[vc_row][vc_column][vc_column_text]
The action today favors a small correction sideways in wave (i) down.
Possibly wave ‘iv’ of one now complete at todays high.
If this is correct,
then next week should begin with a further decline in wave ‘v’ of (i).
So we may be lining up for a full five waves down by the middle of next week.
I would like to see a break of 130.00 at a minimum in order to rule out any further rally.
Monday;
Wave ‘iv’ should complete fairly soon,
wave for a spike lower late Monday to complete five waves down.
[/vc_column_text][/vc_column][/vc_row]
[vc_row][vc_column][vc_separator border_width=”5″][/vc_column][/vc_row][vc_row][vc_column][vc_column_text]
SILVER
[/vc_column_text][/vc_column][/vc_row][vc_row][vc_column][vc_separator border_width=”5″][/vc_column][/vc_row][vc_row][vc_column width=”2/3″][vc_custom_heading text=”1 hr” use_theme_fonts=”yes”][vc_column_text]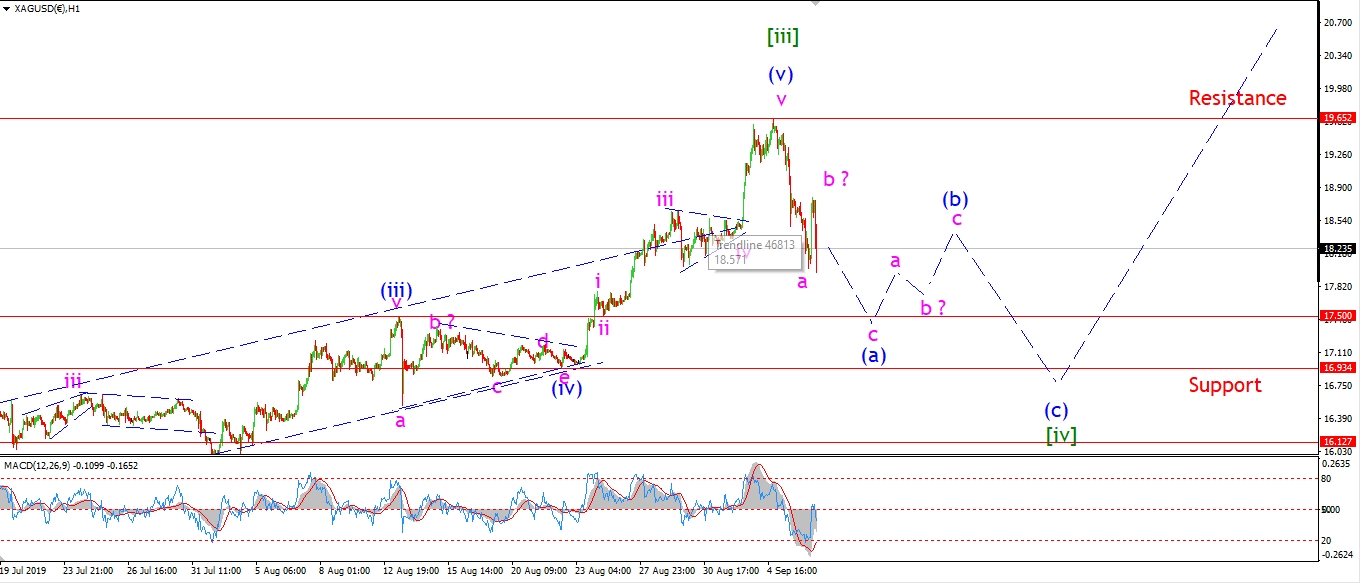 [/vc_column_text][/vc_column][vc_column width=”1/3″][vc_custom_heading text=”4 Hours” use_theme_fonts=”yes”][vc_column_text]
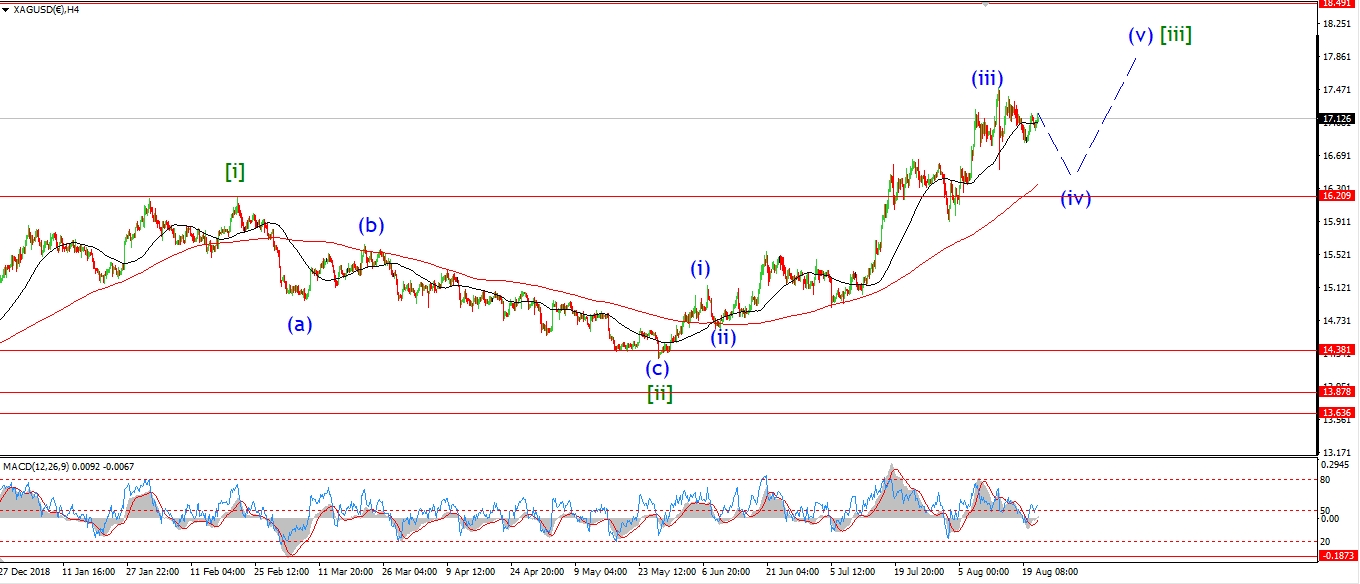 [/vc_column_text][vc_custom_heading text=”Daily” use_theme_fonts=”yes”][vc_column_text]
 [/vc_column_text][/vc_column][/vc_row]
[vc_row][vc_column][vc_column_text]
I have shown a slightly different labeling this evening also for Silver.
This involves the same three wave decline in wave (a) as in Gold.
The price has sold off again this evening off a correction in wave ‘b’,
so this should be the start of wave ‘c’ now underway.
Wave (a) should bring us back down below 18.00 again possibly down to 17.50
if wave ‘c’ equals wave ‘a’ in length.
Monday;
watch for wave ‘c’ to find support at or above 17.50.
Wave (b) should rally to a lower high next week.
[/vc_column_text][/vc_column][/vc_row]
[vc_row][vc_column][vc_separator border_width=”5″][/vc_column][/vc_row][vc_row][vc_column][vc_column_text]
S&P 500.
[/vc_column_text][/vc_column][/vc_row][vc_row][vc_column][vc_separator border_width=”5″][/vc_column][/vc_row][vc_row][vc_column width=”2/3″][vc_custom_heading text=”1 hr” use_theme_fonts=”yes”][vc_column_text]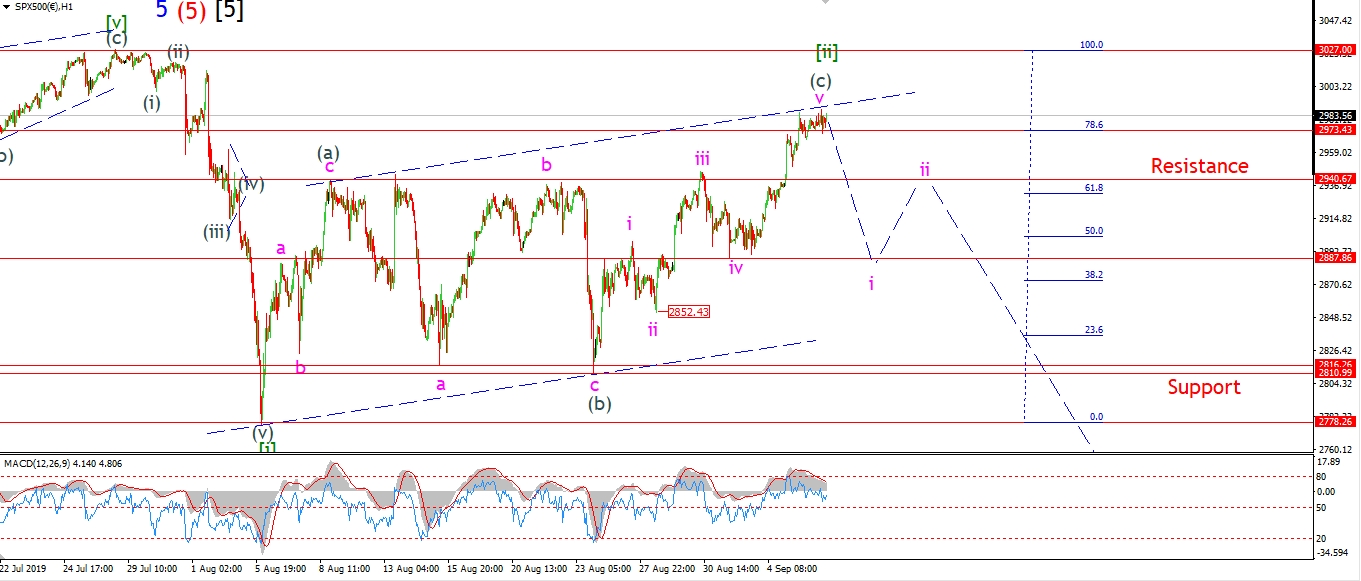 [/vc_column_text][/vc_column][vc_column width=”1/3″][vc_custom_heading text=”4 Hours” use_theme_fonts=”yes”][vc_column_text]
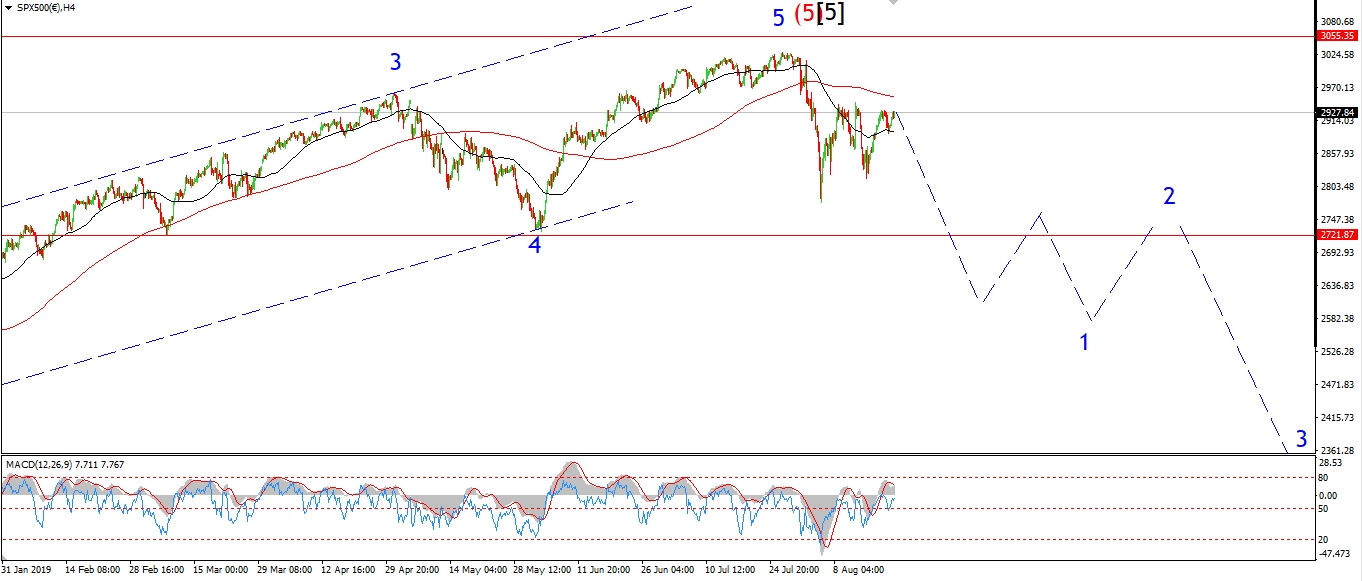 [/vc_column_text][vc_custom_heading text=”Daily” use_theme_fonts=”yes”][vc_column_text]
 [/vc_column_text][/vc_column][/vc_row]
[vc_row][vc_column][vc_column_text]
The S&P is dragging its heels this evening and just will not give up the rally on a Friday!
Wave (c) seems to have come to a halt though,
as the action was completely dead today.
Just like the DOW,
Momentum divergence on the hourly chart is in full swing.
This should result in an initial move lower on Monday off these highs,
in wave ‘i’ of (i).
4hr momentum indicates a seriously overbought condition also right now.
This is occurring at a lower high in price off the all time high.
Again another precarious situation.
Monday;
all the signs are in place for a reversal to happen soon.
If the decline to come is a third wave,
then we should see fireworks in the market soon.
Watch for wave (i) of [iii] to begin with a drop back below 2900 again.
Wishing you all a great weekend,
God bless and God’s speed to you all.
Back on Monday,
Enda.
[/vc_column_text][/vc_column][/vc_row]
[vc_row][vc_column][vc_separator border_width=”5″][/vc_column][/vc_row]