
[vc_row][vc_column][vc_separator border_width=”5″][/vc_column][/vc_row]
[vc_row][vc_column][vc_column_text]
Good evening.
[/vc_column_text][/vc_column][/vc_row]
[vc_row][vc_column][vc_separator border_width=”5″][/vc_column][/vc_row]
[vc_row][vc_column][vc_column_text]
EURUSD
[/vc_column_text][/vc_column][/vc_row]
[vc_row][vc_column][vc_separator border_width=”5″][/vc_column][/vc_row][vc_row][vc_column width=”2/3″][vc_custom_heading text=”1 hr” use_theme_fonts=”yes”][vc_column_text]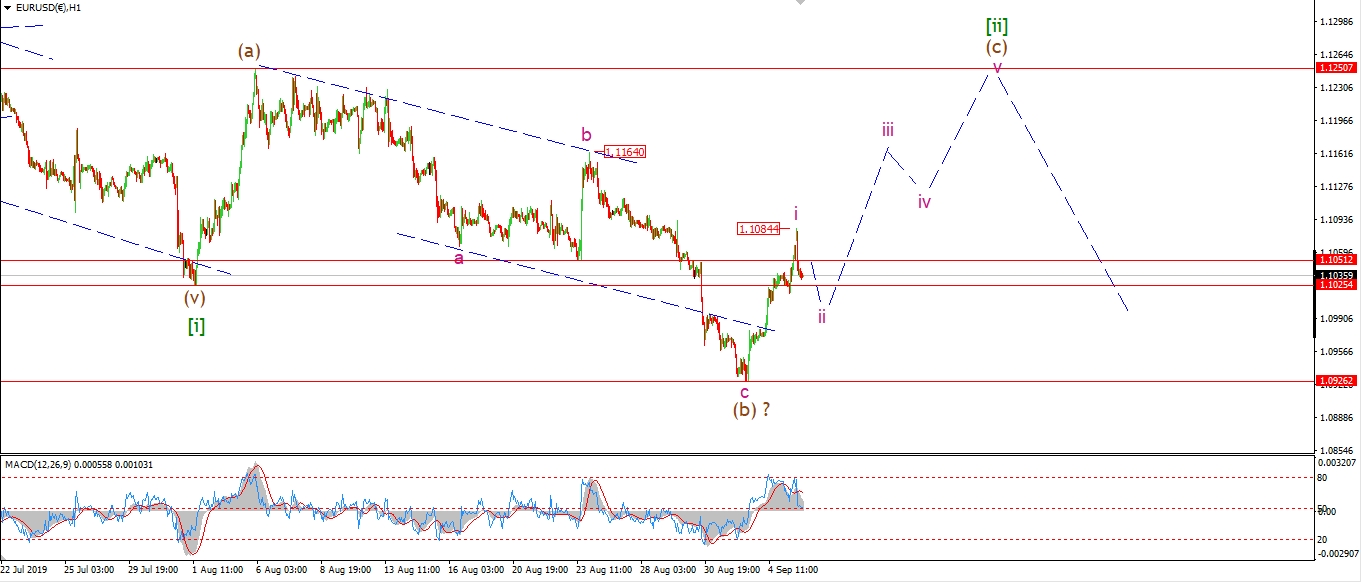 [/vc_column_text][/vc_column][vc_column width=”1/3″][vc_custom_heading text=”4 Hours” use_theme_fonts=”yes”][vc_column_text]
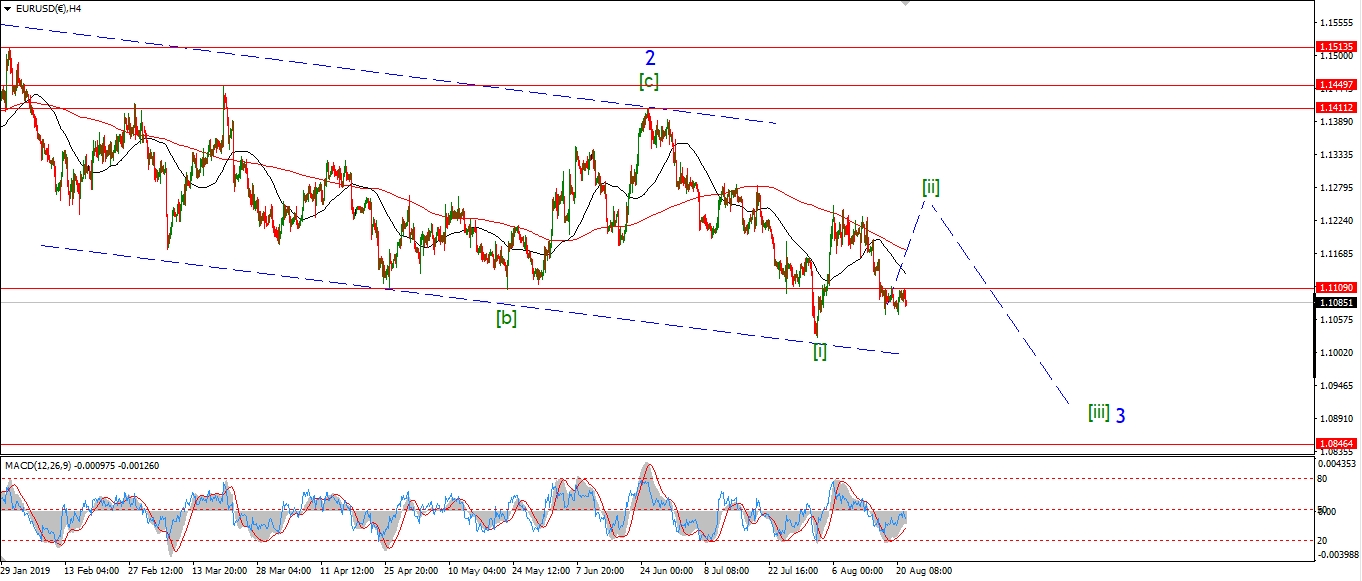 [/vc_column_text][vc_custom_heading text=”Daily” use_theme_fonts=”yes”][vc_column_text]
 [/vc_column_text][/vc_column][/vc_row]
[vc_row][vc_column][vc_column_text]
Wave ‘i’ of (c) seems to have extended a little higher today and pushed above the initial resistance zone at 1.1050.
Todays top reached 1.1084, and that level now takes the wave ‘i’ label.
Wave ‘ii’ has begun with a sharp decline off the high.
We will likely see a three wave decline back below 1.1025 tomorrow in wave ‘ii’.
And when that completes,
we will have a bullish higher low in place,
and the expectation that wave ‘iii’ of (c) will rally for the rest of next week.
Tomorrow;
Watch for wave ‘ii’ to complete in three waves.
1.0926 must hold.
[/vc_column_text][/vc_column][/vc_row]
[vc_row][vc_column][vc_separator border_width=”5″][/vc_column][/vc_row][vc_row][vc_column][vc_column_text]
GBPUSD
[/vc_column_text][/vc_column][/vc_row][vc_row][vc_column][vc_separator border_width=”5″][/vc_column][/vc_row][vc_row][vc_column width=”2/3″][vc_custom_heading text=”1 hr” use_theme_fonts=”yes”][vc_column_text]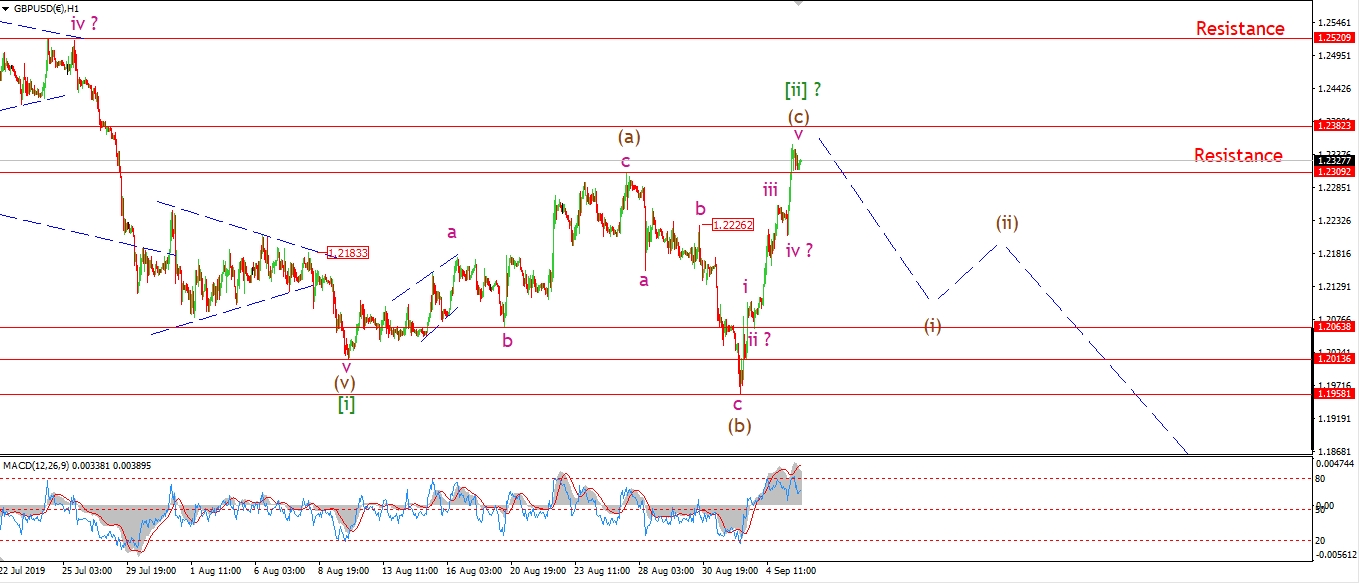 [/vc_column_text][/vc_column][vc_column width=”1/3″][vc_custom_heading text=”4 Hours” use_theme_fonts=”yes”][vc_column_text]
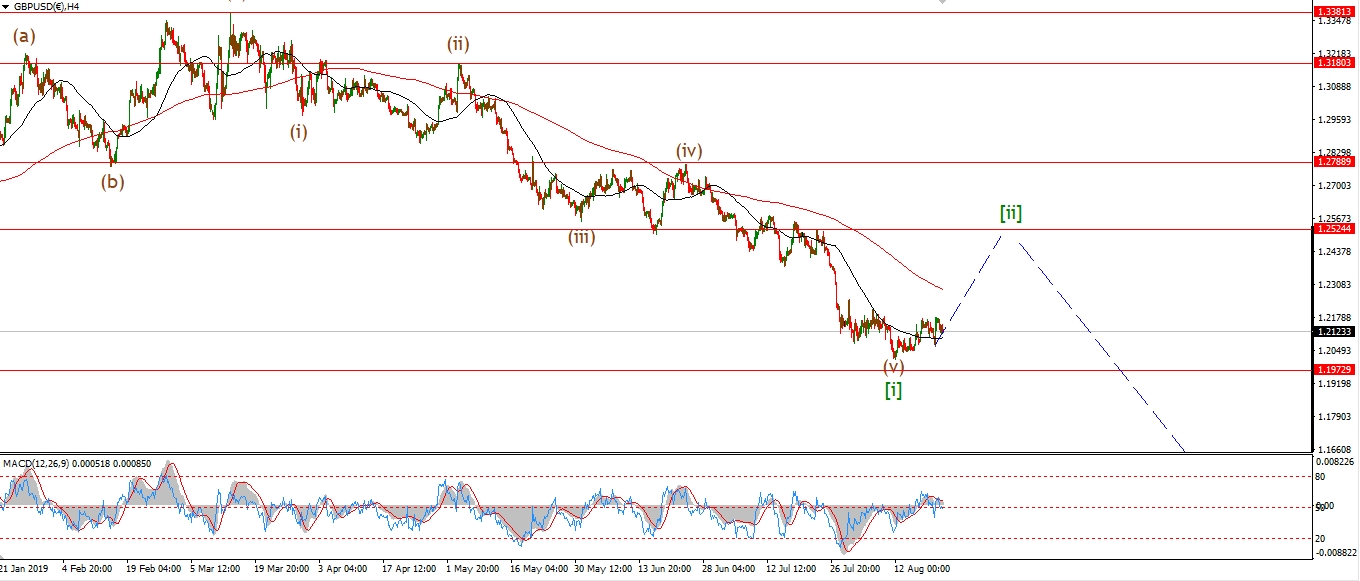 [/vc_column_text][vc_custom_heading text=”Daily” use_theme_fonts=”yes”][vc_column_text]
 [/vc_column_text][/vc_column][/vc_row]
[vc_row][vc_column][vc_column_text]
The continued rally today has triggered the alternate count.
The whole correction in wave [ii] is now labelled as an expanded flat correction.
Wave (c) has now broken above the minimum target at wave (a) of 1.2309.
This does suggest that we are approaching the end of wave (c) now.
There is one more interesting level a little higher above us now.
That level lies at the previous fourth wave within wave (v) of [i] at 1.2520.
That level also corresponds well with the 38.2% retracement level at 1.2510.
So I am open to this rally in wave (c) continuing.
Tomorrow;
If the higher target is to be met,
then we will need another rally from here.
lets see what form this evenings decline takes from here.
[/vc_column_text][/vc_column][/vc_row]
[vc_row][vc_column][vc_separator border_width=”5″][/vc_column][/vc_row][vc_row][vc_column][vc_column_text]
USDJPY
[/vc_column_text][/vc_column][/vc_row][vc_row][vc_column][vc_separator border_width=”5″][/vc_column][/vc_row][vc_row][vc_column width=”2/3″][vc_custom_heading text=”1 hr” use_theme_fonts=”yes”][vc_column_text]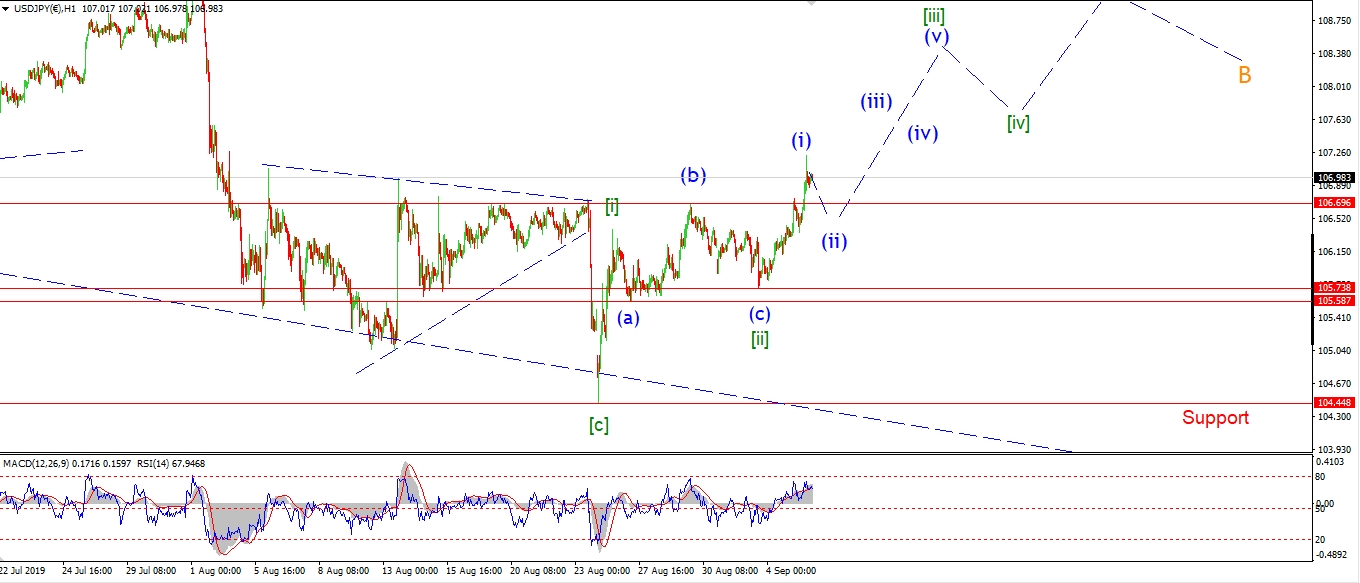 [/vc_column_text][/vc_column][vc_column width=”1/3″][vc_custom_heading text=”4 Hours” use_theme_fonts=”yes”][vc_column_text]
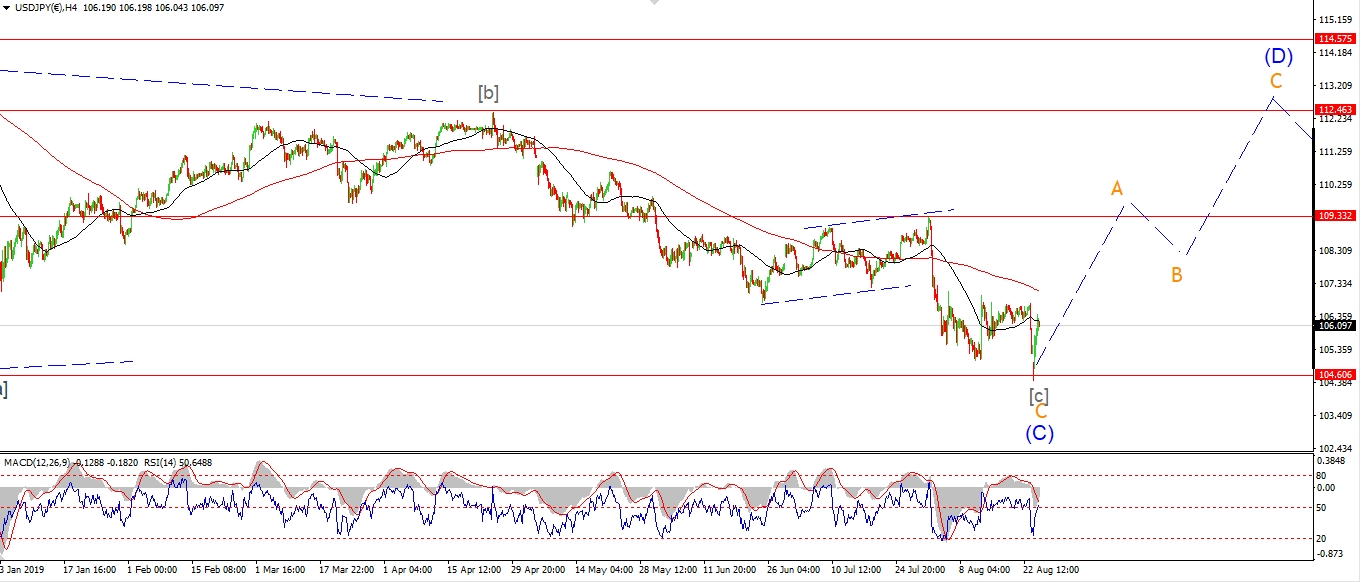 [/vc_column_text][vc_custom_heading text=”Daily” use_theme_fonts=”yes”][vc_column_text]
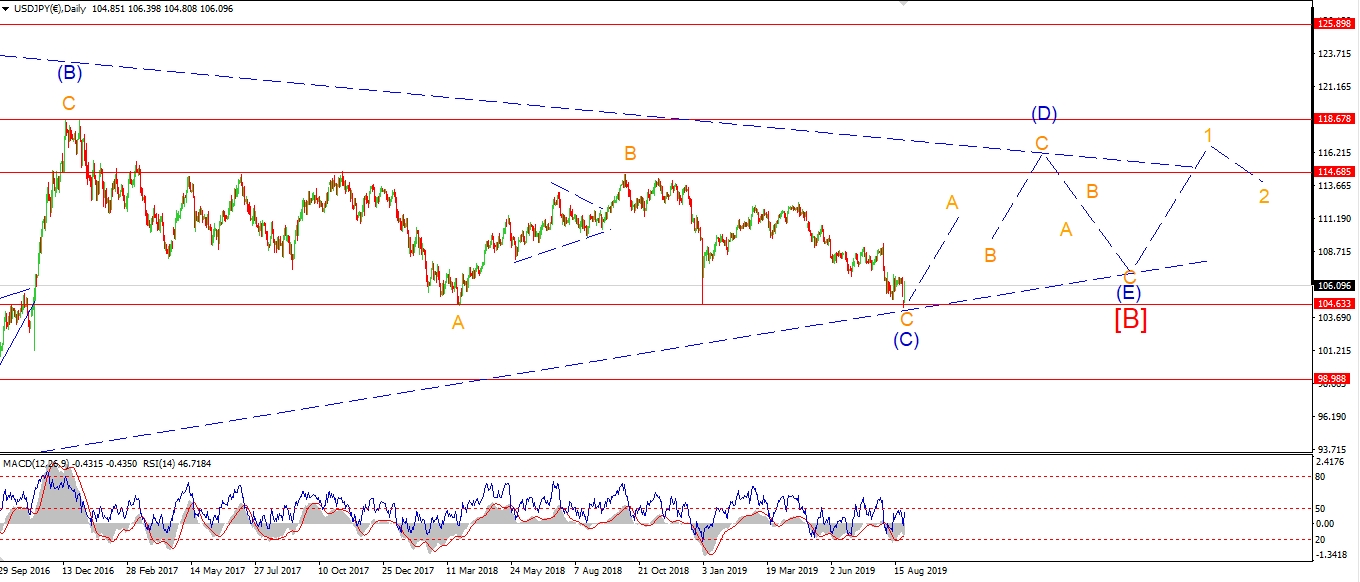 [/vc_column_text][/vc_column][/vc_row]
[vc_row][vc_column][vc_column_text]
USDJPY has pushed out above initial resistance at 106.69 today.
I have labelled this rally as wave (i) of [iii],
and this suggests a correction should begin tomorrow in wave (ii) of [iii].
If this short term count is correct,
then next week will bring a rally in wave (iii) of [iii].
Tomorrow;
Watch for the overnight action to continue a correction in wave (ii) which should complete tomorrow.
105.74 must hold.
[/vc_column_text][/vc_column][/vc_row]
[vc_row][vc_column][vc_separator border_width=”5″][/vc_column][/vc_row][vc_row][vc_column][vc_column_text]
DOW JONES INDUSTRIALS
[/vc_column_text][/vc_column][/vc_row][vc_row][vc_column][vc_separator border_width=”5″][/vc_column][/vc_row][vc_row][vc_column width=”2/3″][vc_custom_heading text=”1 hr” use_theme_fonts=”yes”][vc_column_text]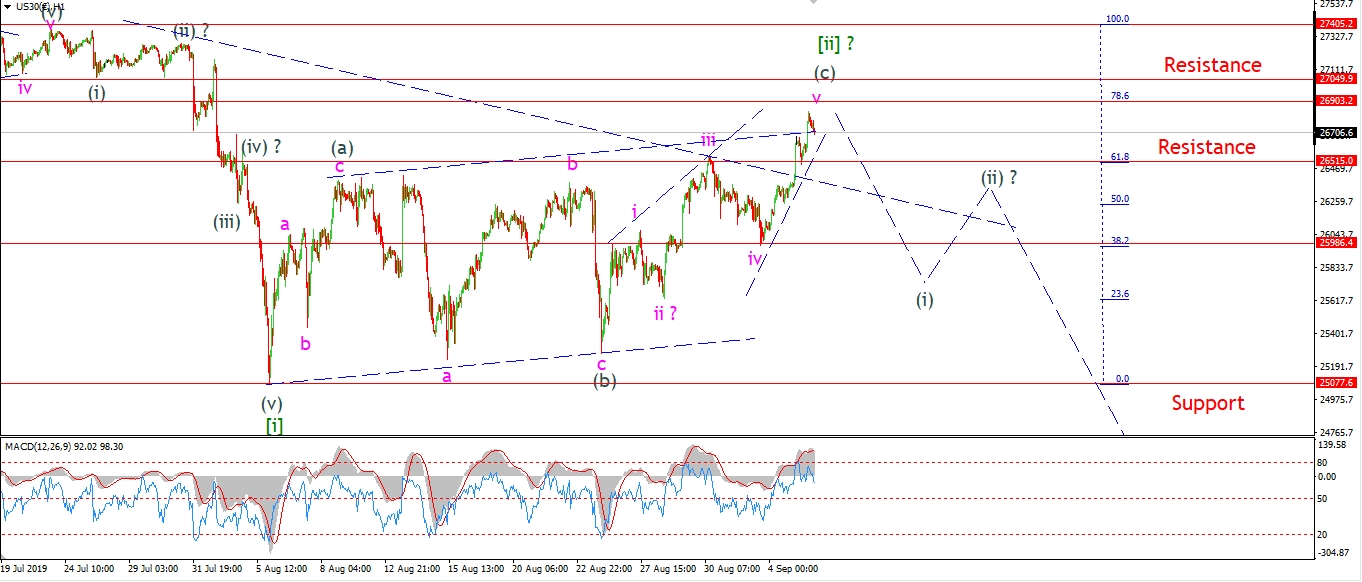 [/vc_column_text][/vc_column][vc_column width=”1/3″][vc_custom_heading text=”4 Hours” use_theme_fonts=”yes”][vc_column_text]
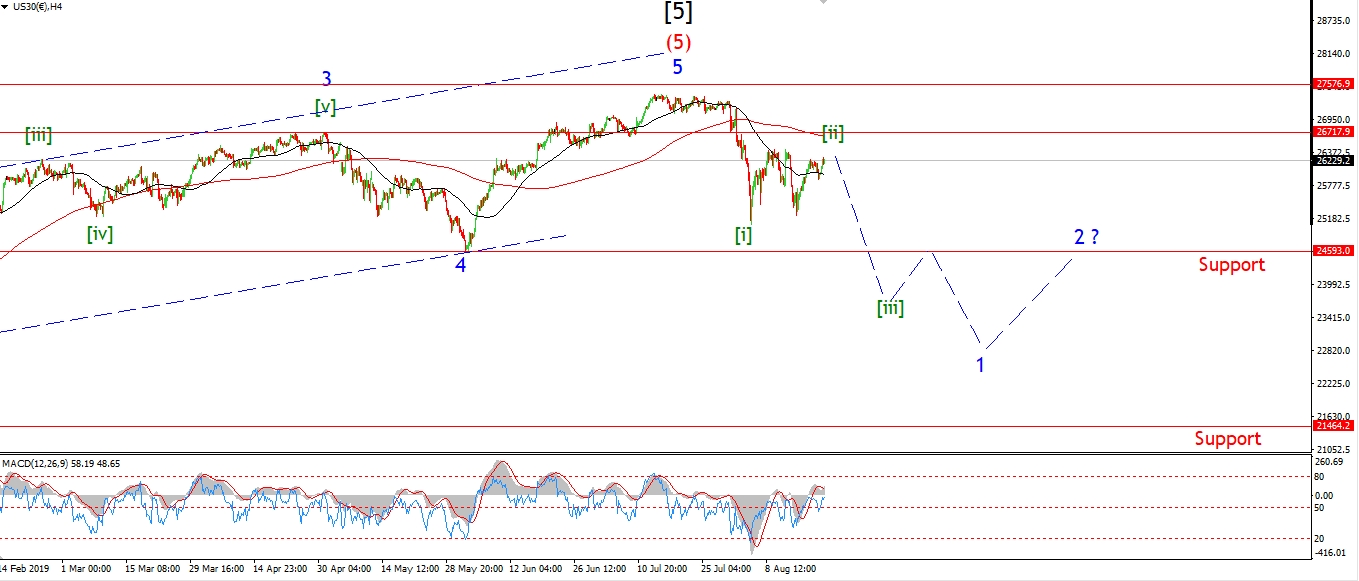 [/vc_column_text][vc_custom_heading text=”Daily” use_theme_fonts=”yes”][vc_column_text]
 [/vc_column_text][/vc_column][/vc_row]
[vc_row][vc_column][vc_column_text]
Another alternate count triggered for the DOW.
I continue to maintain that the action over the last month is corrective to the upside in a large second wave.
The rally this week has now completed an ending diagonal wave (c) of [ii].
Wave (c) has broken up over the upper trend channel line in a small throw-over this evening.
The price is now very close to the 78.6% retracement level of the previous decline in wave [i].
So this correction is again at a typical inflection point.
If that is true,
we should see the initial turn lower soon, possibly tomorrow.
Each turn down over the last few weeks has been a disappointment,
The next one will not!
Tomorrow;
Watch for wave (c) to complete now and begin to turn lower into wave (i) by tomorrow evening.
The next time we break 26000 should be the last.
[/vc_column_text][/vc_column][/vc_row]
[vc_row][vc_column][vc_separator border_width=”5″][/vc_column][/vc_row][vc_row][vc_column][vc_column_text]
GOLD
[/vc_column_text][/vc_column][/vc_row][vc_row][vc_column][vc_separator border_width=”5″][/vc_column][/vc_row][vc_row][vc_column width=”2/3″][vc_custom_heading text=”1 hr” use_theme_fonts=”yes”][vc_column_text]
 [/vc_column_text][/vc_column][vc_column width=”1/3″][vc_custom_heading text=”4 Hours” use_theme_fonts=”yes”][vc_column_text]
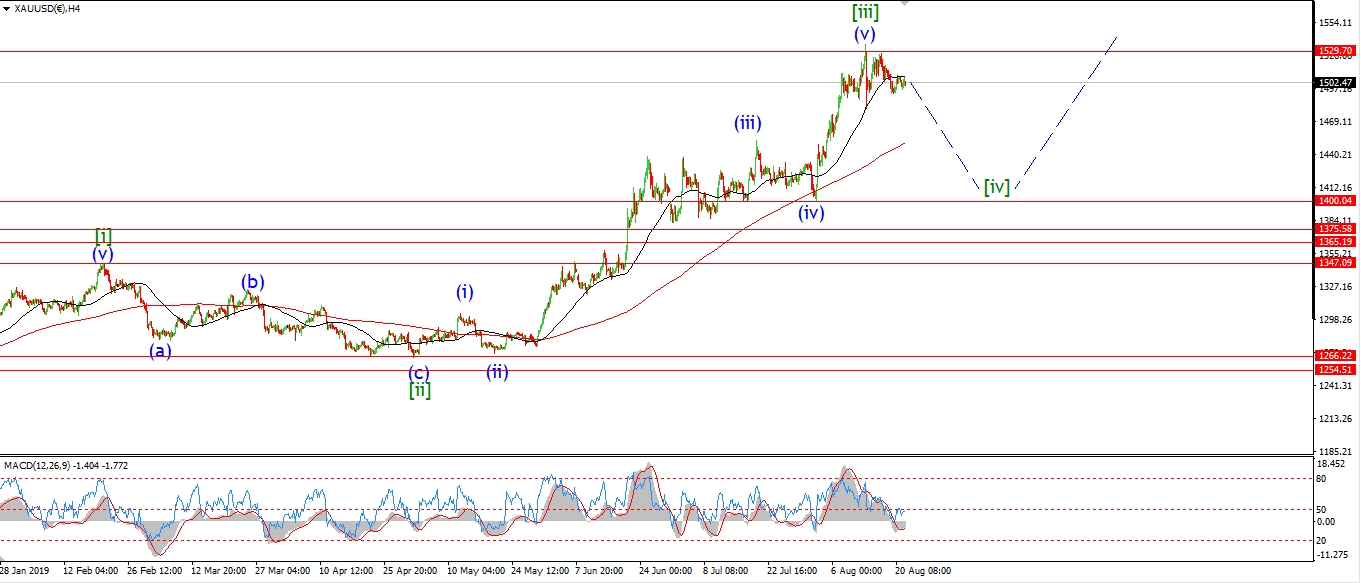 [/vc_column_text][vc_custom_heading text=”Daily” use_theme_fonts=”yes”][vc_column_text]
 [/vc_column_text][/vc_column][/vc_row]
[vc_row][vc_column][vc_column_text]
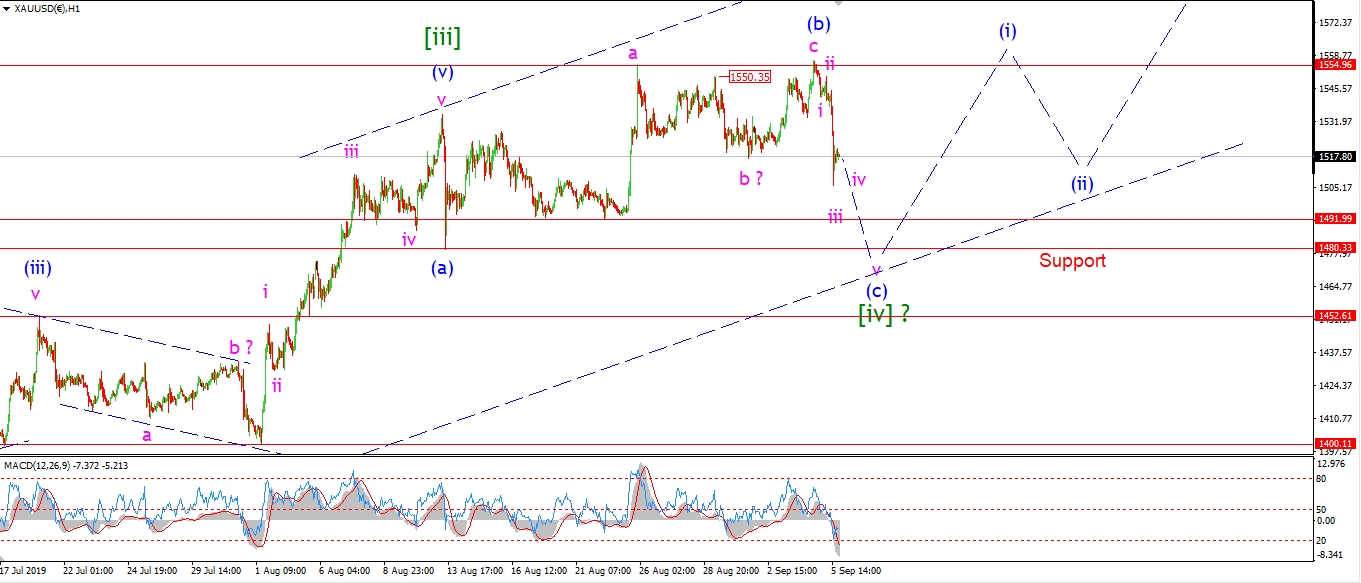
As always with corrections,
they are darn hard to nail down!
GOLD took a serious hit today which has out the previous short term count.
Todays decline puts the larger expanded flat correction for wave [iv] back in play.
Wave (c) of [iv] should now continue lower to break the wave (a) low of 1480.
The next lower support for wave [iv] lies at 1452,
so we should see wave (c) complete in that area somewhere.
Tomorrow;
Watch for wave (c) of [iv] to continue lower in five waves for the next few sessions.
[/vc_column_text][/vc_column][/vc_row]
[vc_row][vc_column][vc_separator border_width=”5″][/vc_column][/vc_row][vc_row][vc_column][vc_column_text]
U.S CRUDE OIL
[/vc_column_text][/vc_column][/vc_row][vc_row][vc_column][vc_separator border_width=”5″][/vc_column][/vc_row][vc_row][vc_column width=”2/3″][vc_custom_heading text=”1 hr” use_theme_fonts=”yes”][vc_column_text]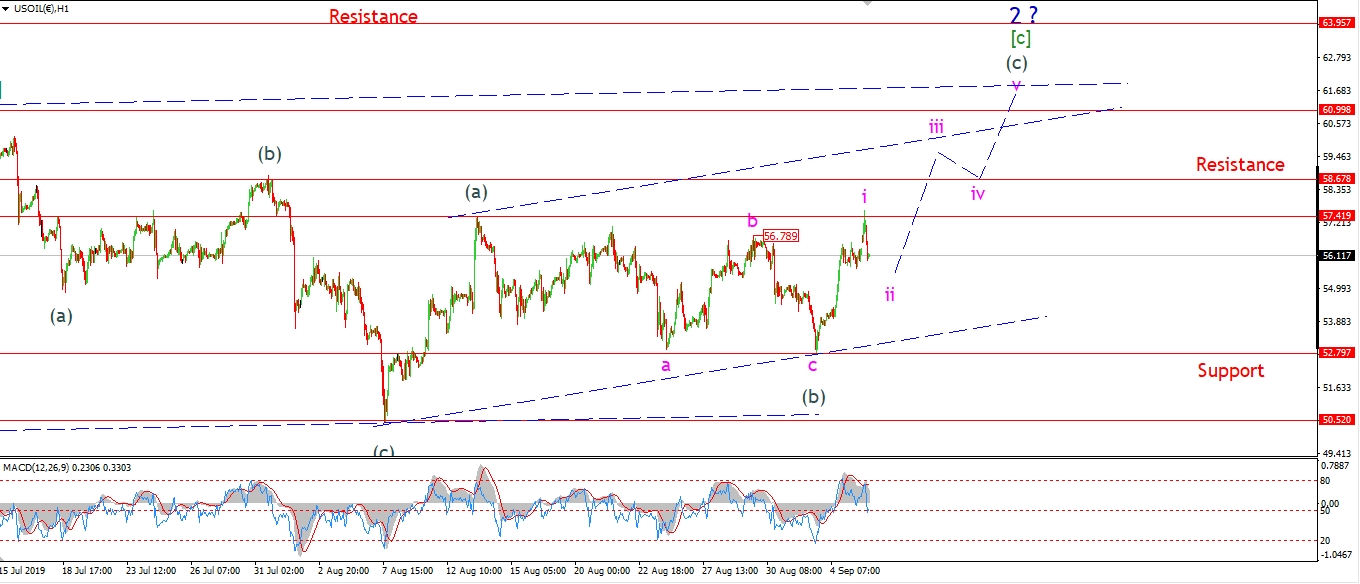 [/vc_column_text][/vc_column][vc_column width=”1/3″][vc_custom_heading text=”4 Hours” use_theme_fonts=”yes”][vc_column_text]
 [/vc_column_text][vc_custom_heading text=”Daily” use_theme_fonts=”yes”][vc_column_text]
 [/vc_column_text][/vc_column][/vc_row]
[vc_row][vc_column][vc_column_text]
Crude did break 57.41 today which confirms that wave (c) of [c] is now underway in the alternate count.
And just as the price hit that high,
it turned around and spiked lower again.
This evenings decline is viewed as wave ‘ii’ of (c),
where wave (a) is likely to trace out a five wave rally.
The target for wave [c] and wave ‘2’ lies back up at the 61.00 handle,
this is where wave [c] will equal wave [a] and the price will hit the upper trend channel.
Todays action is short term bullish,
but only in the context of a corrective rally to the upside.
And the next major move in the oil market is down heavily in wave ‘3’.
Tomorrow;
Watch for wave ‘ii’ to complete a higher low above 52.79,
before turning higher again in wave ‘iii’.
[/vc_column_text][/vc_column][/vc_row]
[vc_row][vc_column][vc_separator border_width=”5″][/vc_column][/vc_row][vc_row][vc_column][vc_column_text]
US 10 yr Treasuries.
[/vc_column_text][/vc_column][/vc_row][vc_row][vc_column][vc_separator border_width=”5″][/vc_column][/vc_row][vc_row][vc_column width=”2/3″][vc_custom_heading text=”1 hr” use_theme_fonts=”yes”][vc_column_text]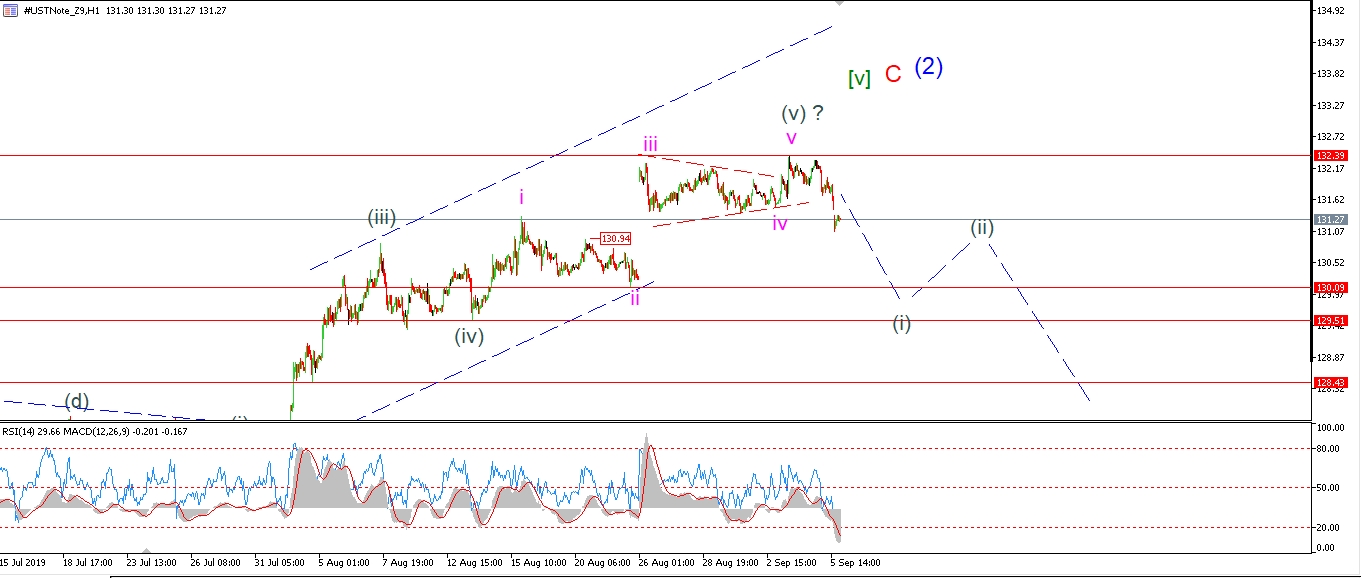 [/vc_column_text][/vc_column][vc_column width=”1/3″][vc_custom_heading text=”4 Hours” use_theme_fonts=”yes”][vc_column_text]
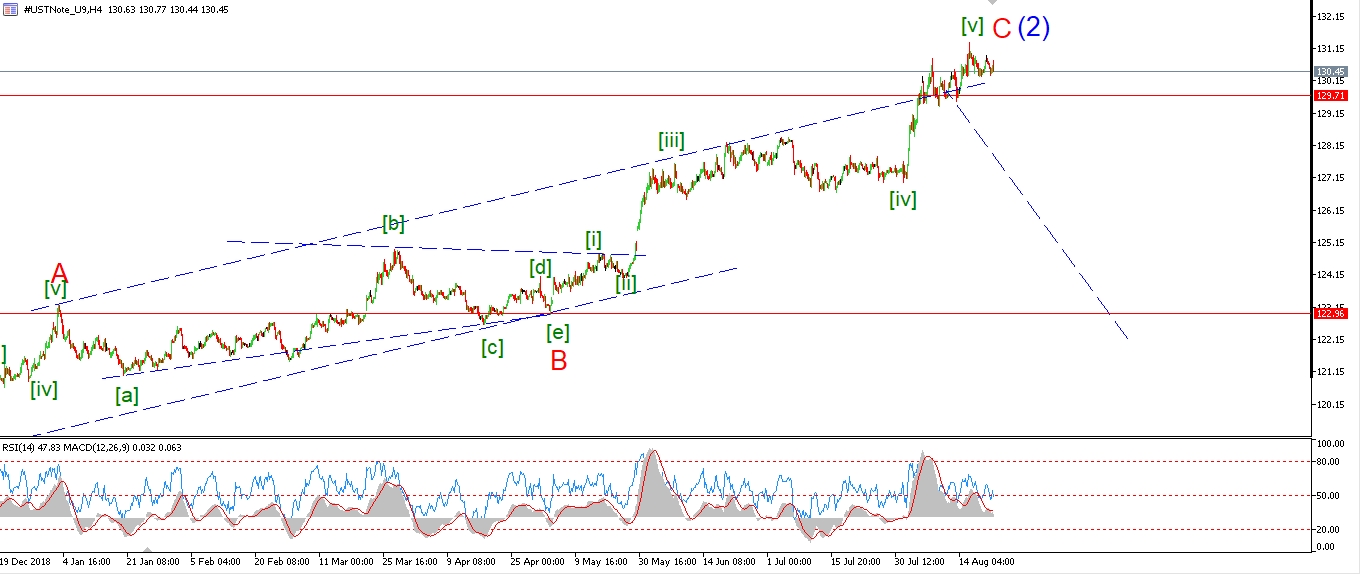 [/vc_column_text][vc_custom_heading text=”Daily” use_theme_fonts=”yes”][vc_column_text]
 [/vc_column_text][/vc_column][/vc_row]
[vc_row][vc_column][vc_column_text]
After todays decline off the 132.39 high,
we are again faced with the possibility that the rally in wave (2) is done.
so for the next few sessions I will be looking for a five wave decline to trace out in wave (i).
And I would like to see wave (i) break below the 130 level
and begin to take out at least one of the recent shoulders of support
within the previous rally.
Again it is a waiting game in the bond market.
The form of todays drop is impulsive looking for sure,
so I will take that as a positive.
Tomorrow;
Watch for wave (i) down to continue to trace out five waves over the coming days.
[/vc_column_text][/vc_column][/vc_row]
[vc_row][vc_column][vc_separator border_width=”5″][/vc_column][/vc_row][vc_row][vc_column][vc_column_text]
SILVER
[/vc_column_text][/vc_column][/vc_row][vc_row][vc_column][vc_separator border_width=”5″][/vc_column][/vc_row][vc_row][vc_column width=”2/3″][vc_custom_heading text=”1 hr” use_theme_fonts=”yes”][vc_column_text]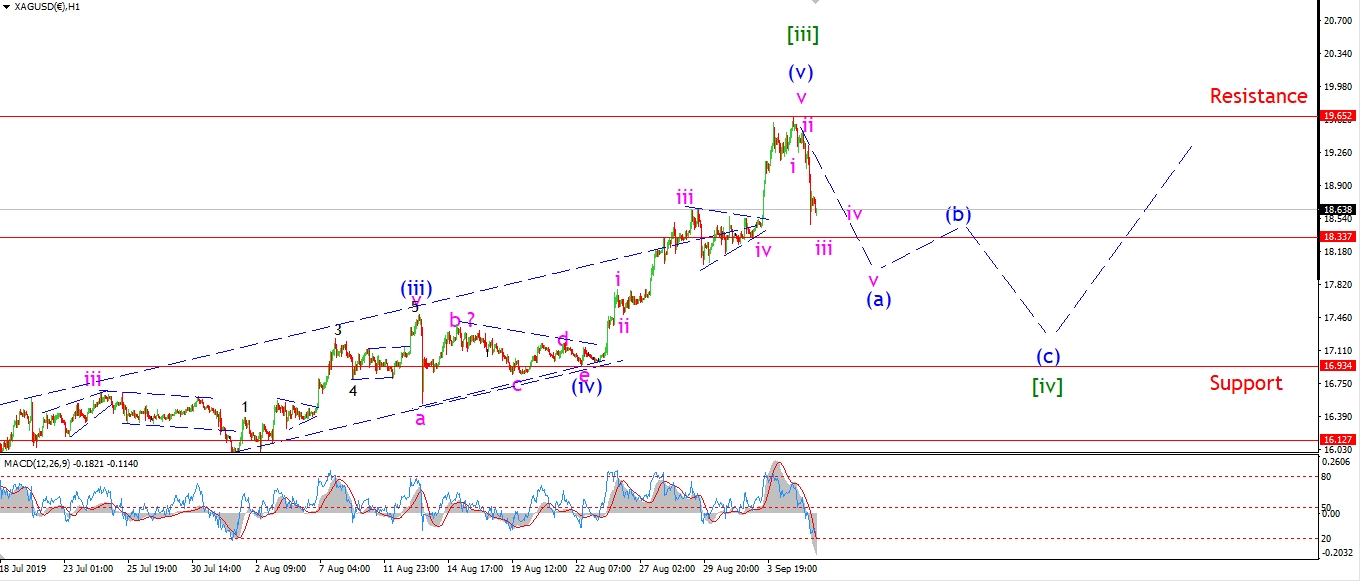 [/vc_column_text][/vc_column][vc_column width=”1/3″][vc_custom_heading text=”4 Hours” use_theme_fonts=”yes”][vc_column_text]
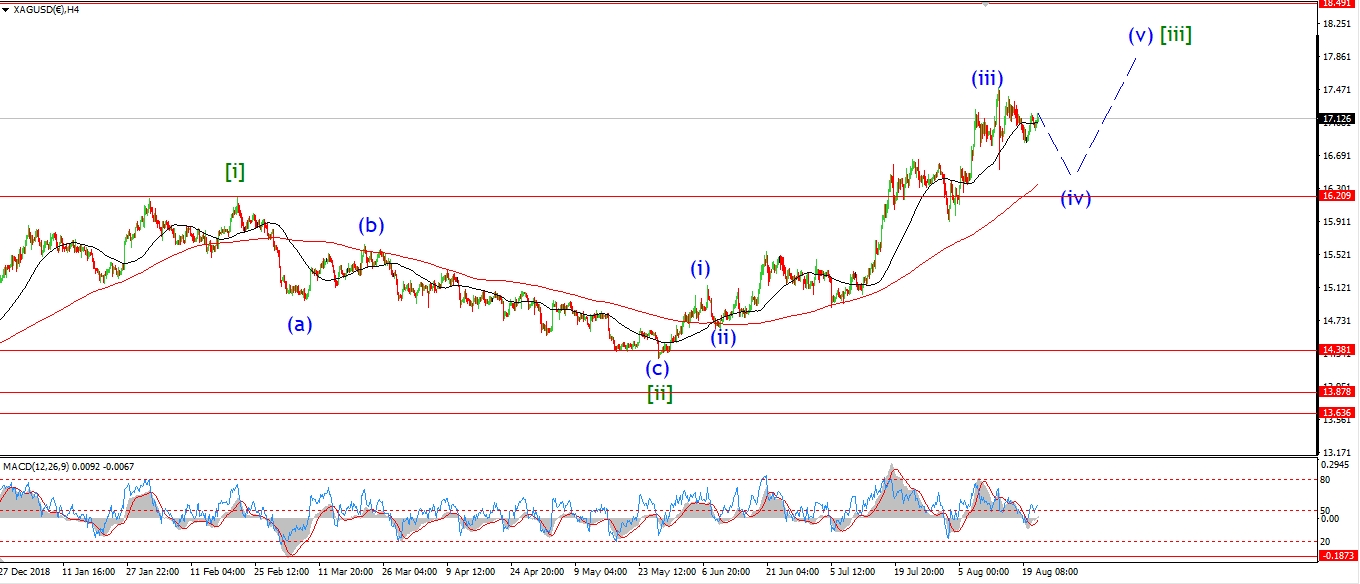 [/vc_column_text][vc_custom_heading text=”Daily” use_theme_fonts=”yes”][vc_column_text]
 [/vc_column_text][/vc_column][/vc_row]
[vc_row][vc_column][vc_column_text]
Silver has finally turned lower in a meaningful way today.
The drop off that 19.65 high is now viewed as the beginning of a large correction in wave [iv] green.
There is now way of knowing what pattern wave [iv] will take at the moment,
the only sure thing we know is that when wave [iv] is done,
the steam of the recent rally in wave [iii] should be completely dissipated.
This does suggest a long drawn out correction in wave [iv],
possibly a triangle,
which would definitely serve that purpose well.
Tomorrow;
the initial decline in wave (a) should continue.
Lets see how it develops from here.
[/vc_column_text][/vc_column][/vc_row]
[vc_row][vc_column][vc_separator border_width=”5″][/vc_column][/vc_row][vc_row][vc_column][vc_column_text]
S&P 500.
[/vc_column_text][/vc_column][/vc_row][vc_row][vc_column][vc_separator border_width=”5″][/vc_column][/vc_row][vc_row][vc_column width=”2/3″][vc_custom_heading text=”1 hr” use_theme_fonts=”yes”][vc_column_text]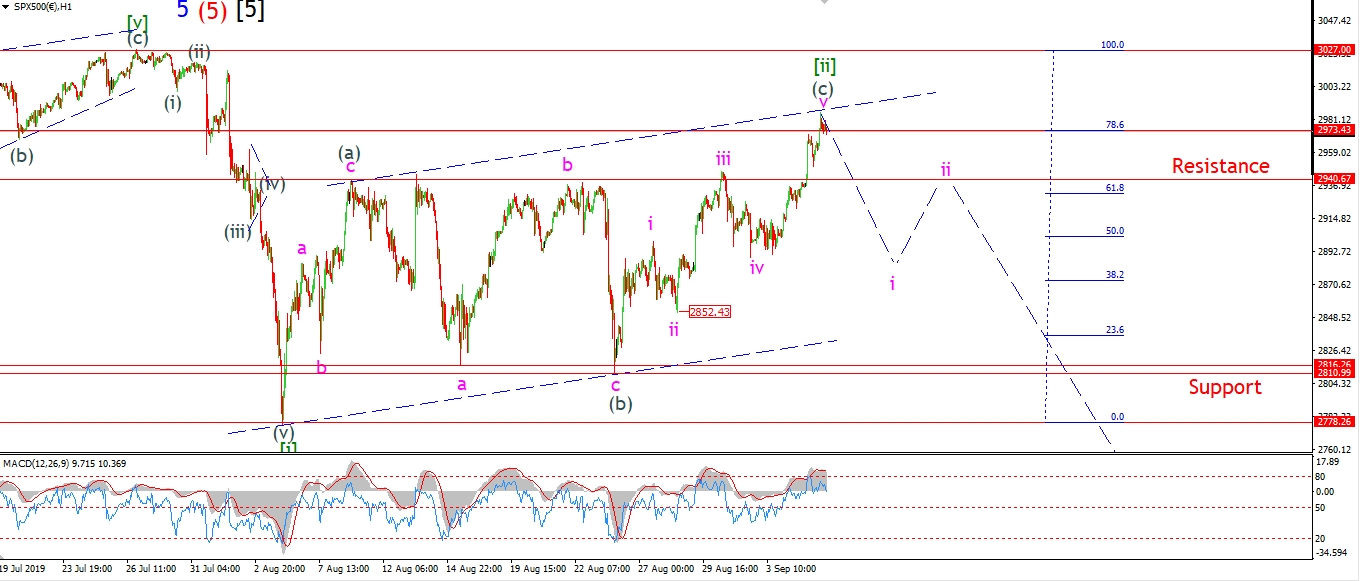 [/vc_column_text][/vc_column][vc_column width=”1/3″][vc_custom_heading text=”4 Hours” use_theme_fonts=”yes”][vc_column_text]
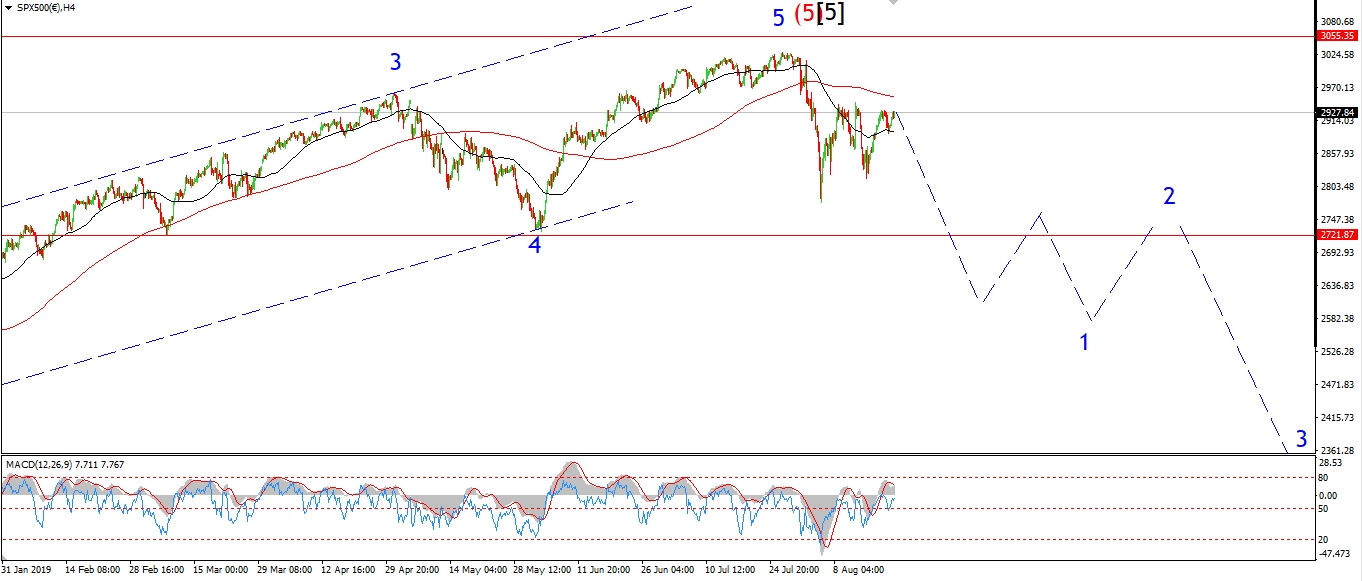 [/vc_column_text][vc_custom_heading text=”Daily” use_theme_fonts=”yes”][vc_column_text]
 [/vc_column_text][/vc_column][/vc_row]
[vc_row][vc_column][vc_column_text]
Another day another rally in stocks.
The price is now back to the upper trend channel line again in the alternate wave [ii] scenario.
And now we are at a serious danger point for the bulls,
Stocks have just completed a large complex correction higher in wave [ii].
And now we are ready for a drop down into wave [iii].
Wave (c) of [ii] has completed an ending diagonal,
And as with the DOW,
the price has hit the 78.6% retracement level this evening.
On the 4hr chart the price has just traced out a head and shoulders pattern around the all time high.
Again, another bearish pattern with big consequences.
Tomorrow;
Watch for price to turn lower again into wave ‘i’ of (i).
[/vc_column_text][/vc_column][/vc_row]
[vc_row][vc_column][vc_separator border_width=”5″][/vc_column][/vc_row]