
[vc_row][vc_column][vc_separator border_width=”5″][/vc_column][/vc_row]
[vc_row][vc_column][vc_column_text]
Good evening all, I hope the day treated you well.
[/vc_column_text][/vc_column][/vc_row]
[vc_row][vc_column][vc_separator border_width=”5″][/vc_column][/vc_row]
[vc_row][vc_column][vc_column_text]
EURUSD
[/vc_column_text][/vc_column][/vc_row]
[vc_row][vc_column][vc_separator border_width=”5″][/vc_column][/vc_row][vc_row][vc_column width=”2/3″][vc_custom_heading text=”1 hr” use_theme_fonts=”yes”][vc_column_text]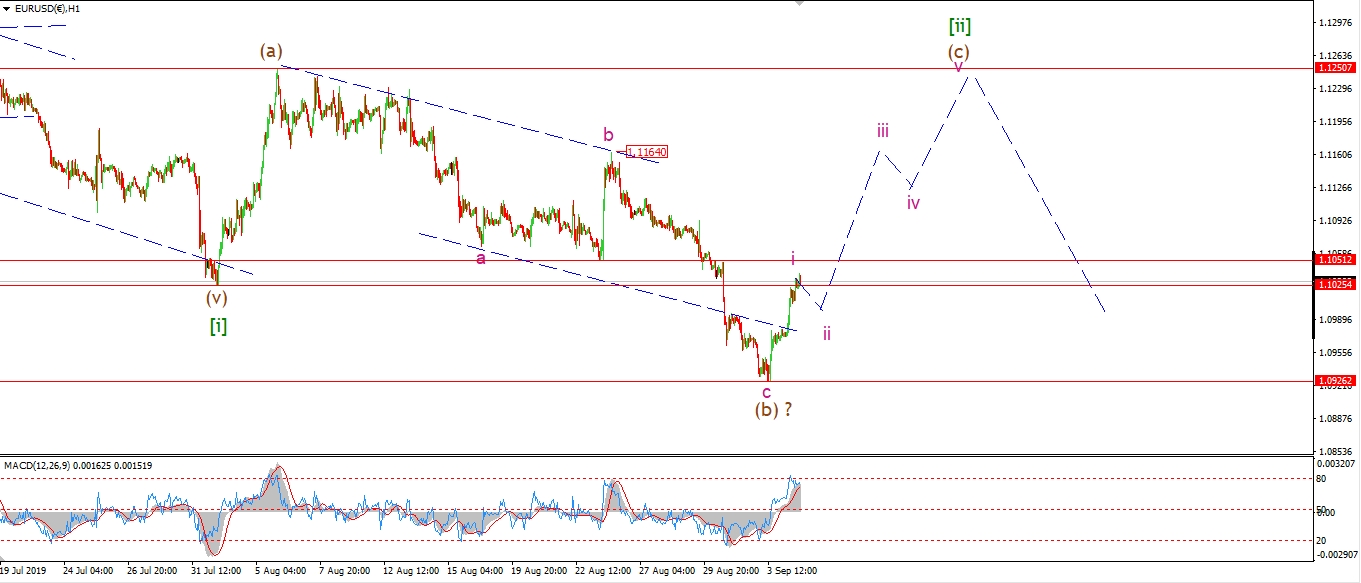 [/vc_column_text][/vc_column][vc_column width=”1/3″][vc_custom_heading text=”4 Hours” use_theme_fonts=”yes”][vc_column_text]
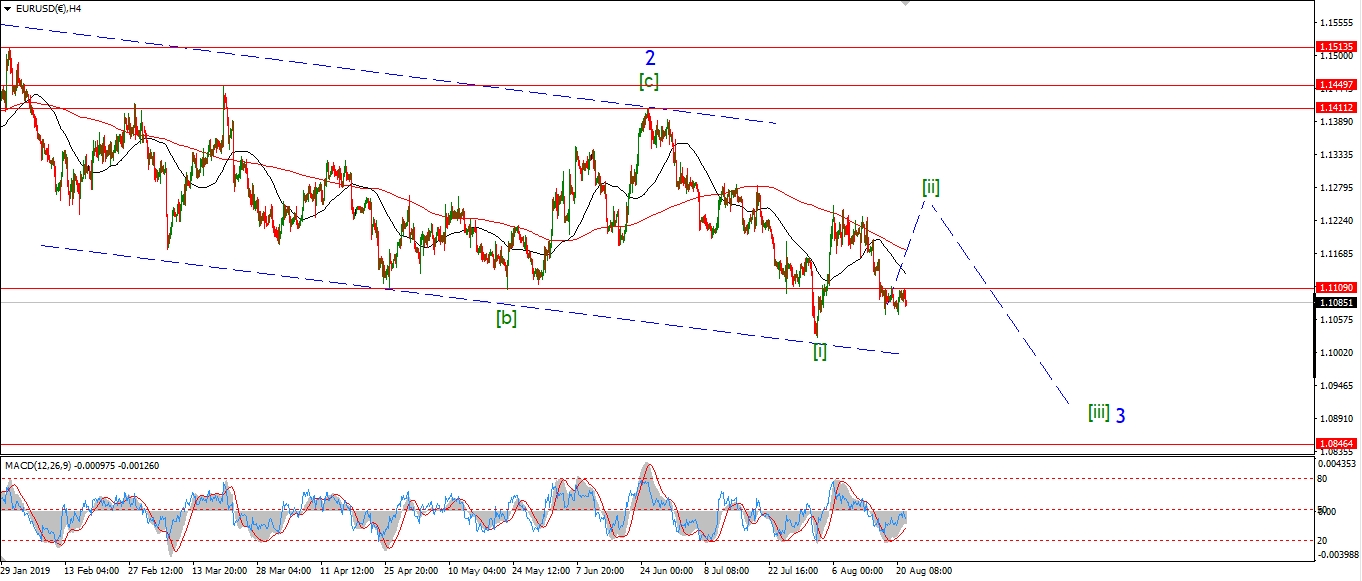 [/vc_column_text][vc_custom_heading text=”Daily” use_theme_fonts=”yes”][vc_column_text]
 [/vc_column_text][/vc_column][/vc_row]
[vc_row][vc_column][vc_column_text]
The initial rally off the lows yesterday continued today in wave ‘i’ of (c).
The rally in wave ‘i’ now looks like a five wave rise off 1.0926.
This suggests wave ‘i’ of (c) is complete
and wave ‘ii’ is likely to drop back slightly tomorrow.
This action will create a short term bullish higher low,
and wave ‘iii’ should then rally again over the coming days towards 1.1150.
The overall rally in wave (c) should hit 1.1250 before completing.
Tomorrow;
watch for wave ‘ii’ to correct slightly and hold above 1.0926.
[/vc_column_text][/vc_column][/vc_row]
[vc_row][vc_column][vc_separator border_width=”5″][/vc_column][/vc_row][vc_row][vc_column][vc_column_text]
GBPUSD
[/vc_column_text][/vc_column][/vc_row][vc_row][vc_column][vc_separator border_width=”5″][/vc_column][/vc_row][vc_row][vc_column width=”2/3″][vc_custom_heading text=”1 hr” use_theme_fonts=”yes”][vc_column_text]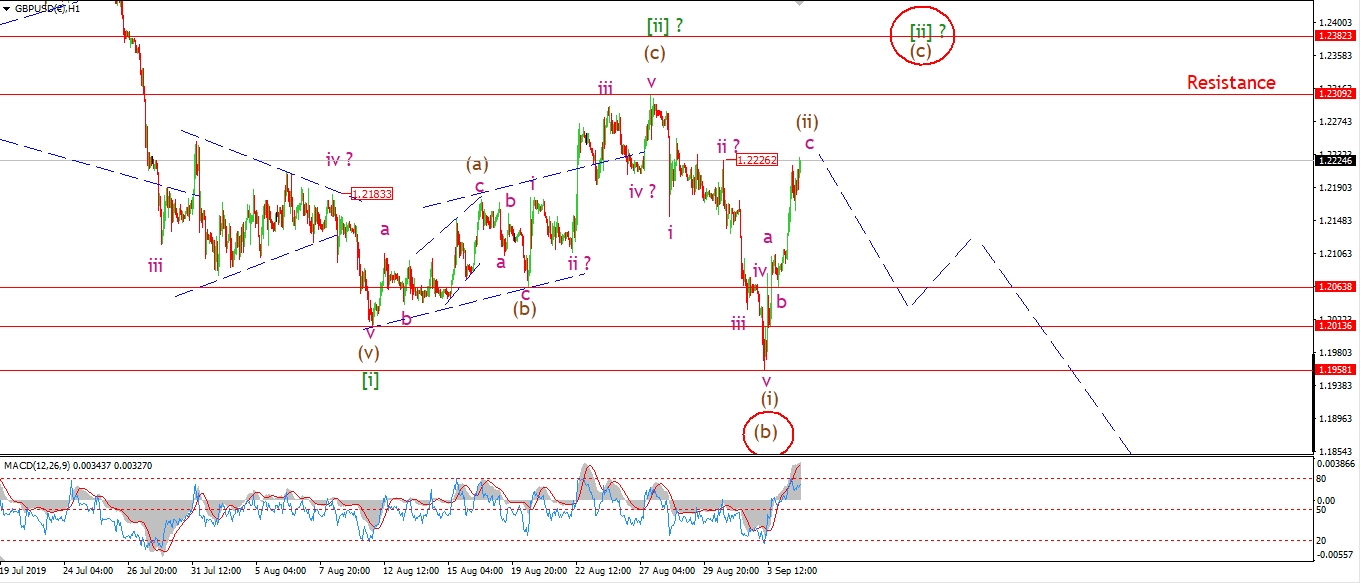 [/vc_column_text][/vc_column][vc_column width=”1/3″][vc_custom_heading text=”4 Hours” use_theme_fonts=”yes”][vc_column_text]
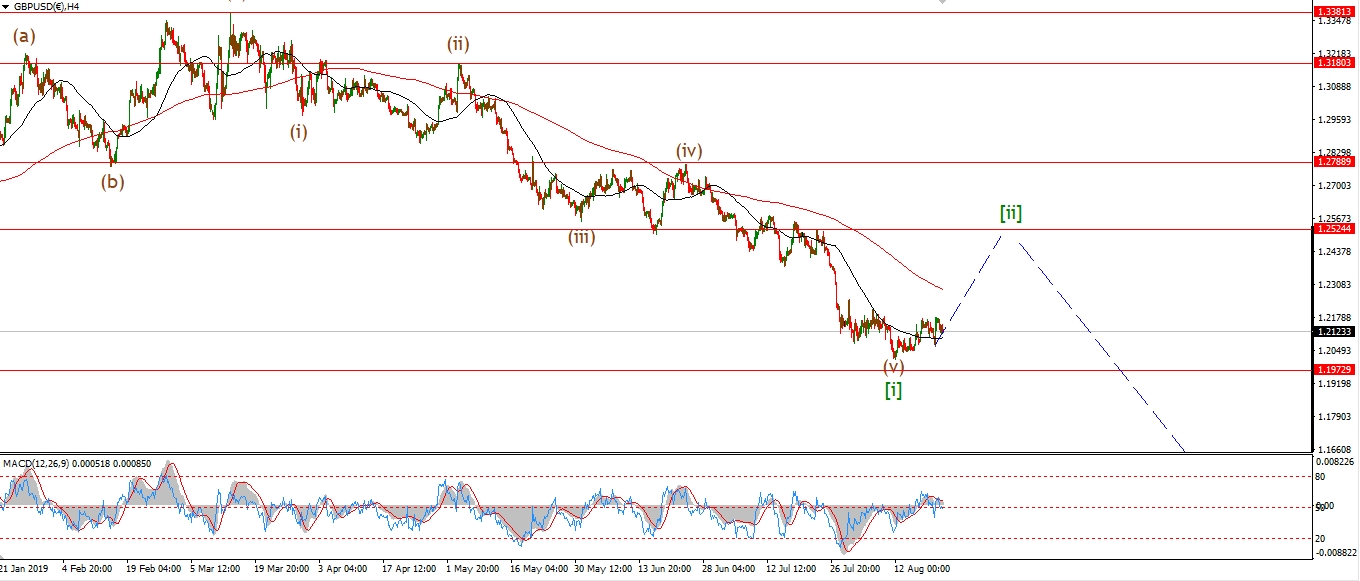 [/vc_column_text][vc_custom_heading text=”Daily” use_theme_fonts=”yes”][vc_column_text]
 [/vc_column_text][/vc_column][/vc_row]
[vc_row][vc_column][vc_column_text]
The rally continued today in either wave (ii) or wave (c).
The nature of the rally is more impulsive looking than corrective,
So the alternate count is looking equally likely now.
If we break above 1.2250 tomorrow,
that will trigger that alternate count.
and then we can expect wave (c) of [ii] to complete a five wave rally
to break the wave (a) high at 1.2309.
Tomorrow;
The action off this evening highs will decide between the wave counts.
Lets see if we get a decline tomorrow to reaffirm the current count.
[/vc_column_text][/vc_column][/vc_row]
[vc_row][vc_column][vc_separator border_width=”5″][/vc_column][/vc_row][vc_row][vc_column][vc_column_text]
USDJPY
[/vc_column_text][/vc_column][/vc_row][vc_row][vc_column][vc_separator border_width=”5″][/vc_column][/vc_row][vc_row][vc_column width=”2/3″][vc_custom_heading text=”1 hr” use_theme_fonts=”yes”][vc_column_text]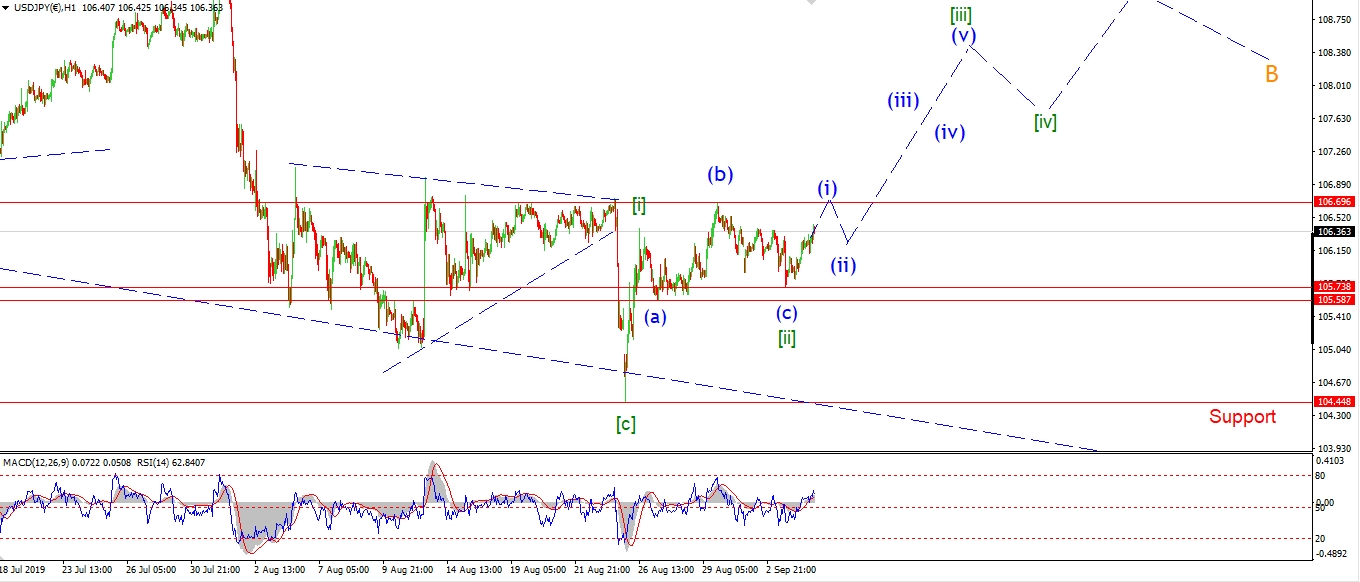 [/vc_column_text][/vc_column][vc_column width=”1/3″][vc_custom_heading text=”4 Hours” use_theme_fonts=”yes”][vc_column_text]
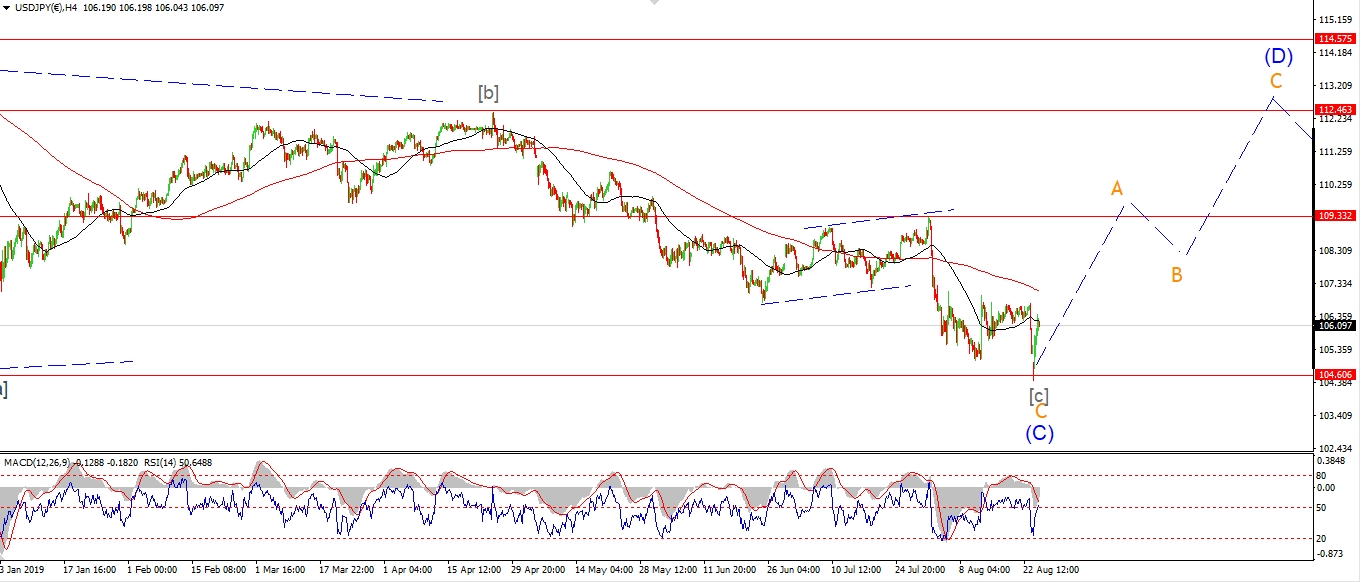 [/vc_column_text][vc_custom_heading text=”Daily” use_theme_fonts=”yes”][vc_column_text]
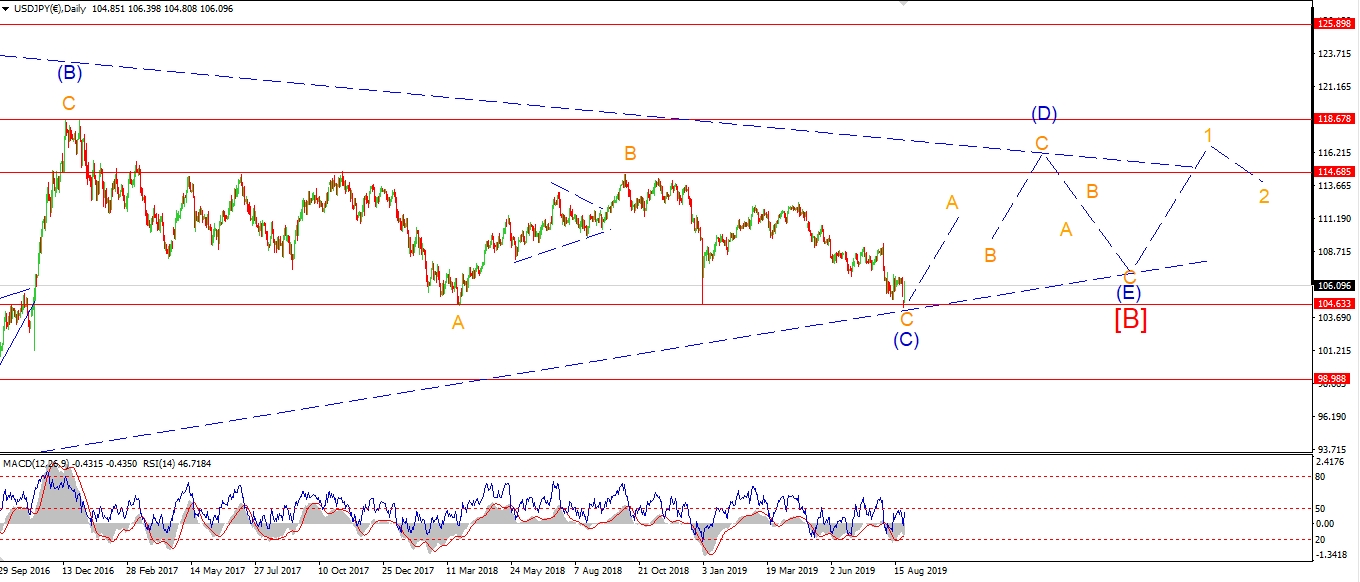 [/vc_column_text][/vc_column][/vc_row]
[vc_row][vc_column][vc_column_text]
USDJPY is heading higher today off a possible wave [ii] low at 105.73.
If this is wave (i) of [iii],
then I would like to see a break of 106.69 to confirm it.
And then a decline in wave (ii) to a further higher low.
We are getting close to bullish signal in USDJPY for a rally in wave (iii) of [iii].
if the low at 105.73 continues to hold for another few sessions.
Tomorrow;
Watch for wave (i) to continue higher overnight and break 106.69.
[/vc_column_text][/vc_column][/vc_row]
[vc_row][vc_column][vc_separator border_width=”5″][/vc_column][/vc_row][vc_row][vc_column][vc_column_text]
DOW JONES INDUSTRIALS
[/vc_column_text][/vc_column][/vc_row][vc_row][vc_column][vc_separator border_width=”5″][/vc_column][/vc_row][vc_row][vc_column width=”2/3″][vc_custom_heading text=”1 hr” use_theme_fonts=”yes”][vc_column_text]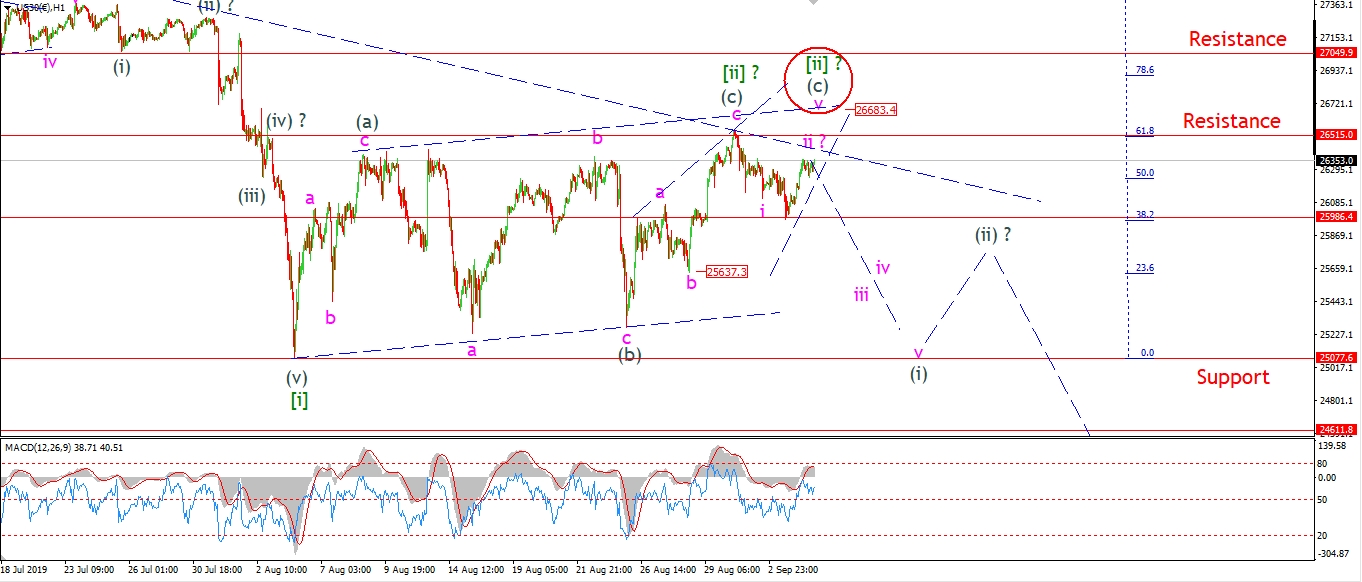 [/vc_column_text][/vc_column][vc_column width=”1/3″][vc_custom_heading text=”4 Hours” use_theme_fonts=”yes”][vc_column_text]
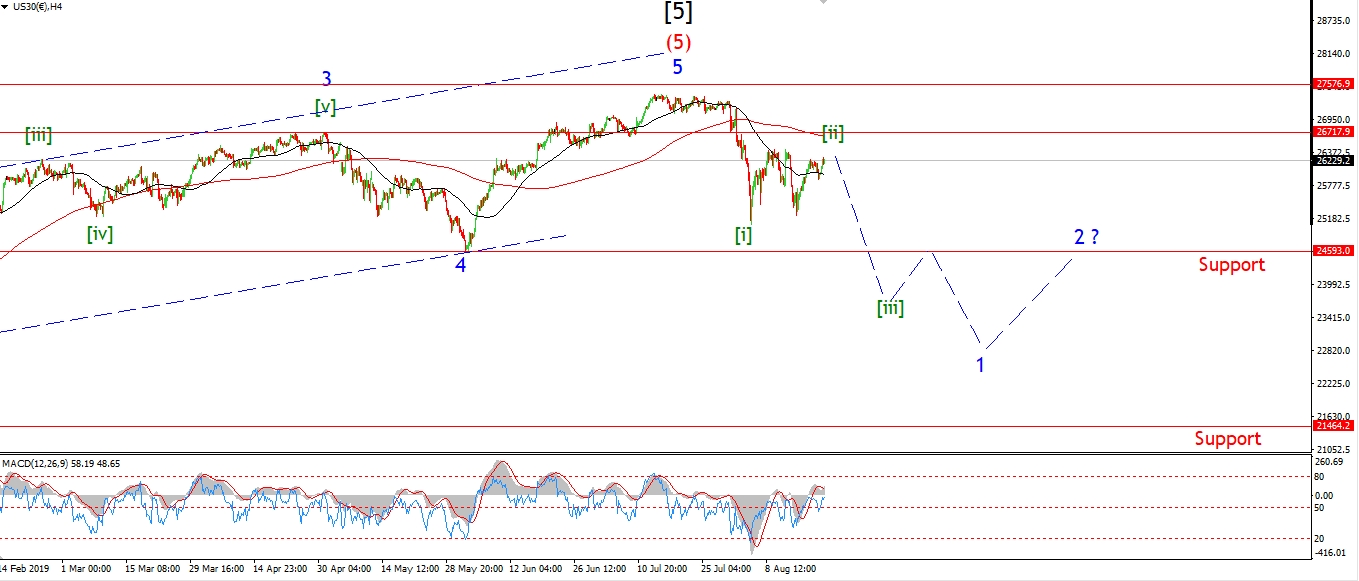 [/vc_column_text][vc_custom_heading text=”Daily” use_theme_fonts=”yes”][vc_column_text]
 [/vc_column_text][/vc_column][/vc_row]
[vc_row][vc_column][vc_column_text]
Its a tough one to call right now in the DOW,
todays action has left the door open for wave [ii] to complete one more high.
We did get a reasonable decline off last weeks highs,
and the price broke the wave ‘a’ high set at 26070.
The big sticking point right now is that the pattern off the high is not perfect.
Todays rally may be the final leg of an expanded flat wave ‘ii’.
In this case,
wave ‘iii’ must begin tomorrow and accelerate lower back down to about 25700.
Only a solid selloff now will redeem this short term count.
The alternate I have shown allows for todays rally to continue up to the trend channel line again in wave (c) of [ii].
In this case,
wave (c) will trace out an ending diagonal and complete at 26700 at the trend channel line.
Tomorrow;
Watch for 26515 to hold and wave ‘iii’ down to return lower again.
A break of 26515 will trigger the alternate count.
[/vc_column_text][/vc_column][/vc_row]
[vc_row][vc_column][vc_separator border_width=”5″][/vc_column][/vc_row][vc_row][vc_column][vc_column_text]
GOLD
[/vc_column_text][/vc_column][/vc_row][vc_row][vc_column][vc_separator border_width=”5″][/vc_column][/vc_row][vc_row][vc_column width=”2/3″][vc_custom_heading text=”1 hr” use_theme_fonts=”yes”][vc_column_text]
 [/vc_column_text][/vc_column][vc_column width=”1/3″][vc_custom_heading text=”4 Hours” use_theme_fonts=”yes”][vc_column_text]
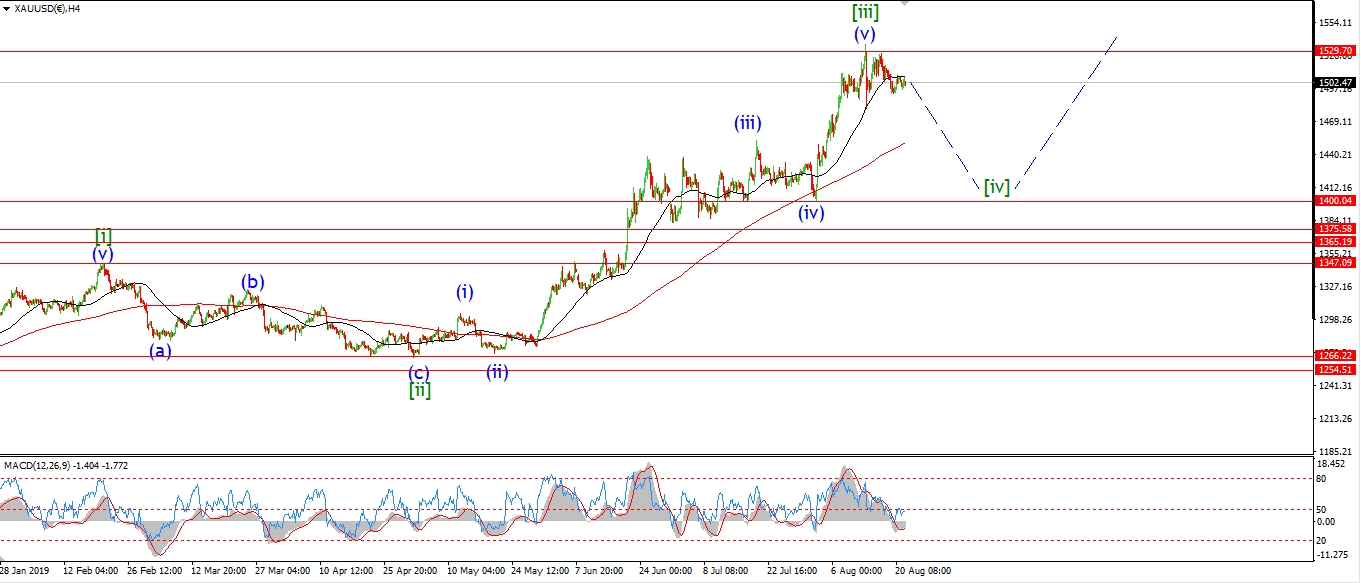 [/vc_column_text][vc_custom_heading text=”Daily” use_theme_fonts=”yes”][vc_column_text]
 [/vc_column_text][/vc_column][/vc_row]
[vc_row][vc_column][vc_column_text]
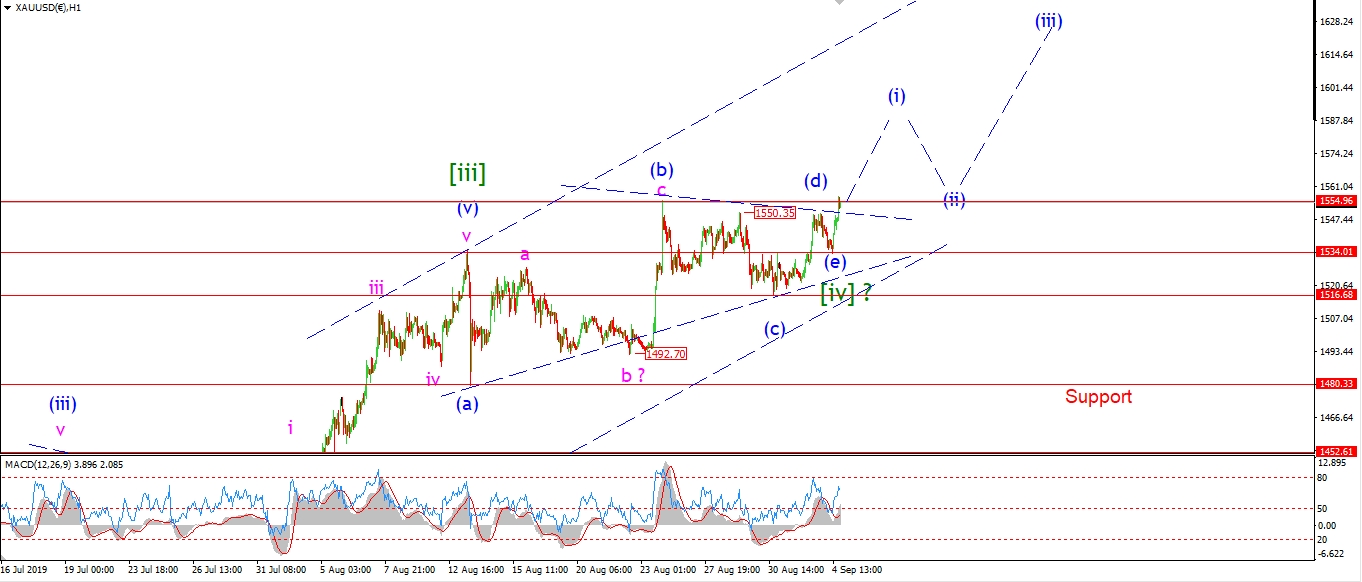
Gold created a small higher low above wave (c) at 1516 early today.
This decline can be viewed as wave (e) of [iv] now complete.
Todays rally to break the 1554 high again is possibly the beginning of wave [v] up.
If this is the case,
then Gold could continue to rally from here towards 1650 in the larger bullish scenario.
Tomorrow;
I will hold an open mind on this one for the moment
just to see if we get some bullish confirmation in the price action from here.
Price must hold above 1534 in the short term as waves (i) and (ii) complete.
[/vc_column_text][/vc_column][/vc_row]
[vc_row][vc_column][vc_separator border_width=”5″][/vc_column][/vc_row][vc_row][vc_column][vc_column_text]
U.S CRUDE OIL
[/vc_column_text][/vc_column][/vc_row][vc_row][vc_column][vc_separator border_width=”5″][/vc_column][/vc_row][vc_row][vc_column width=”2/3″][vc_custom_heading text=”1 hr” use_theme_fonts=”yes”][vc_column_text]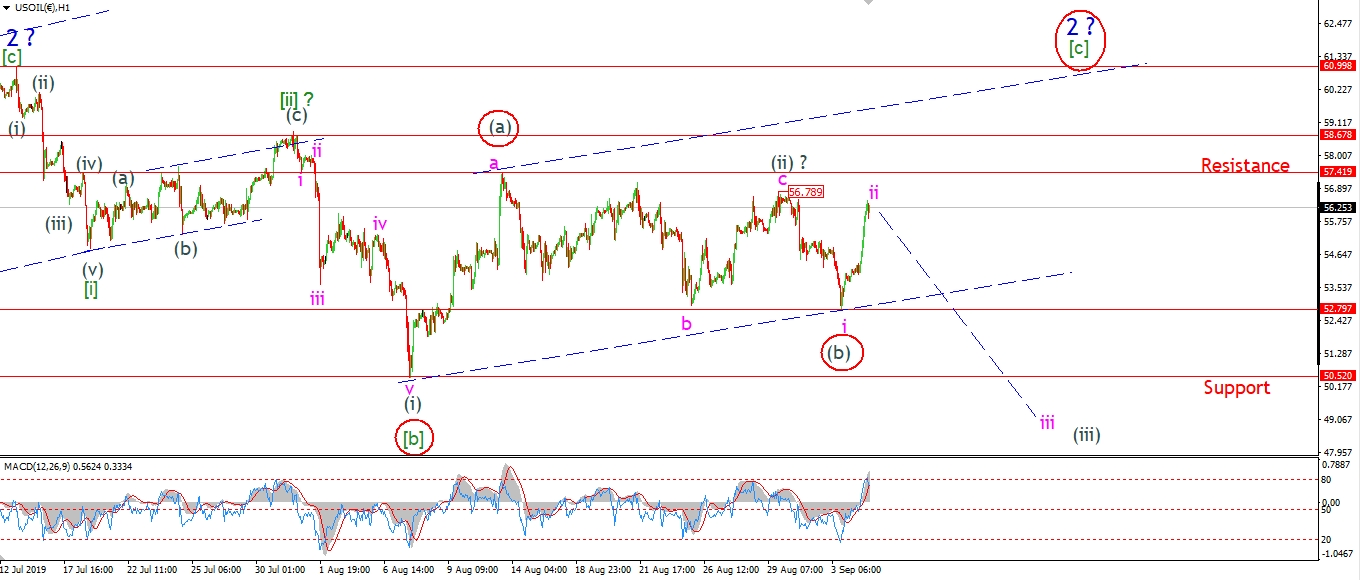 [/vc_column_text][/vc_column][vc_column width=”1/3″][vc_custom_heading text=”4 Hours” use_theme_fonts=”yes”][vc_column_text]
 [/vc_column_text][vc_custom_heading text=”Daily” use_theme_fonts=”yes”][vc_column_text]
 [/vc_column_text][/vc_column][/vc_row]
[vc_row][vc_column][vc_column_text]
Crude has retraced almost all the decline of the last few days after todays vertical move.
It is possible that wave ‘ii’ is still in force,
but I must admit,
todays action favor the alternate count heavily now!
So I will concentrate on that possibility now.
The 4hr chart gives a good overview of the larger wave ‘2’ that I have been talking about.
And I have labelled the short term chart with the alternate count this evening.
The recent low can be viewed as wave (b) of [c] of ‘2’.
Where wave ‘2’ is a combination correction tracing out a 3,3,3 internal pattern.
If we get a break of 57.40 again that will trigger the alternate count and we can expect wave ‘2’ to complete in the area of 61.00 again.
Tomorrow;
I am going to wait and see what tomorrow brings before committing to one count.
57.40 is the key high at the moment.
[/vc_column_text][/vc_column][/vc_row]
[vc_row][vc_column][vc_separator border_width=”5″][/vc_column][/vc_row][vc_row][vc_column][vc_column_text]
US 10 yr Treasuries.
[/vc_column_text][/vc_column][/vc_row][vc_row][vc_column][vc_separator border_width=”5″][/vc_column][/vc_row][vc_row][vc_column width=”2/3″][vc_custom_heading text=”1 hr” use_theme_fonts=”yes”][vc_column_text]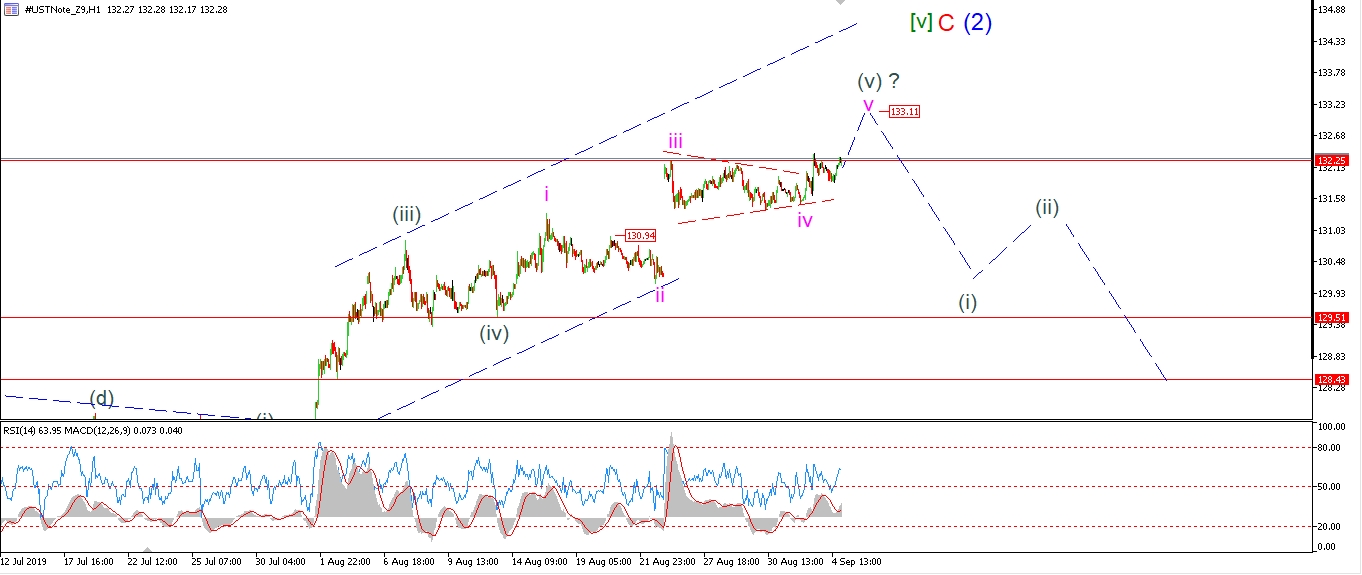 [/vc_column_text][/vc_column][vc_column width=”1/3″][vc_custom_heading text=”4 Hours” use_theme_fonts=”yes”][vc_column_text]
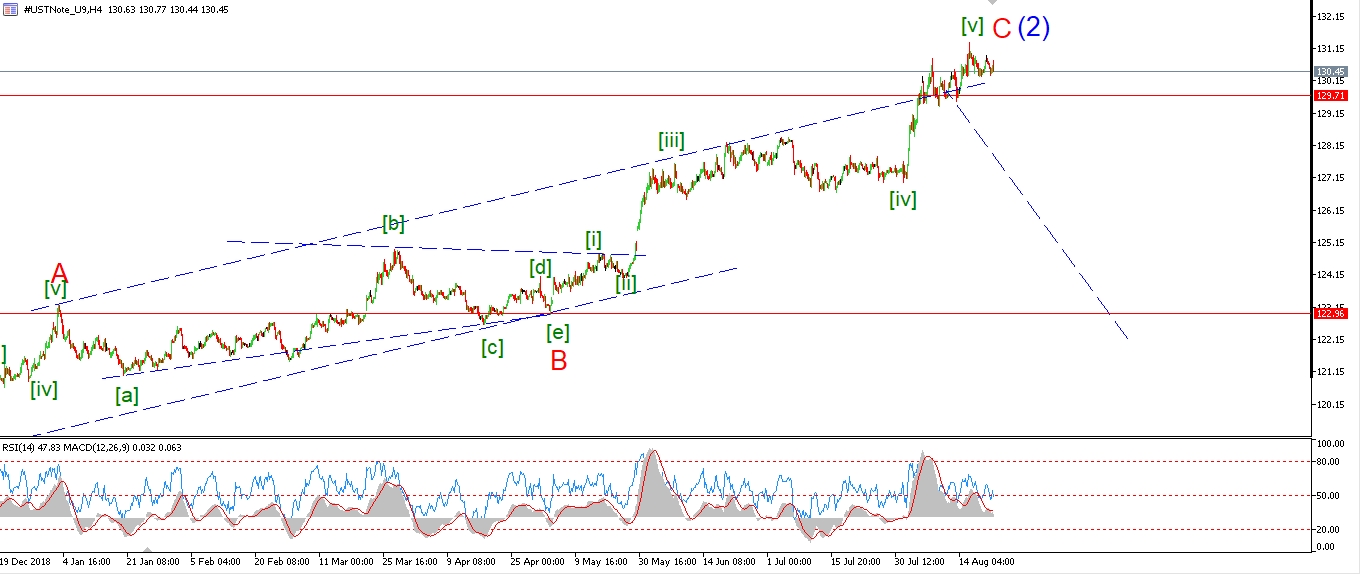 [/vc_column_text][vc_custom_heading text=”Daily” use_theme_fonts=”yes”][vc_column_text]
 [/vc_column_text][/vc_column][/vc_row]
[vc_row][vc_column][vc_column_text]
The 10YR pushed slightly higher today in a fairly muted trade.
This rally seems to be loosing steam day by day.
On the 4hr chart,
there is already a significant series of lower highs in both Momentum indicators over the last month.
And this bearish divergence is signalling that we are near the end in wave ‘C’.
Tomorrow;
Given that the market is so stupidly lopsided bullish at the moment,
It is hard not to see this as a serious contrarian opportunity.
The outlook remains the same over the next week.
I await a five wave decline to indicate the turn is near.
[/vc_column_text][/vc_column][/vc_row]
[vc_row][vc_column][vc_separator border_width=”5″][/vc_column][/vc_row][vc_row][vc_column][vc_column_text]
SILVER
[/vc_column_text][/vc_column][/vc_row][vc_row][vc_column][vc_separator border_width=”5″][/vc_column][/vc_row][vc_row][vc_column width=”2/3″][vc_custom_heading text=”1 hr” use_theme_fonts=”yes”][vc_column_text]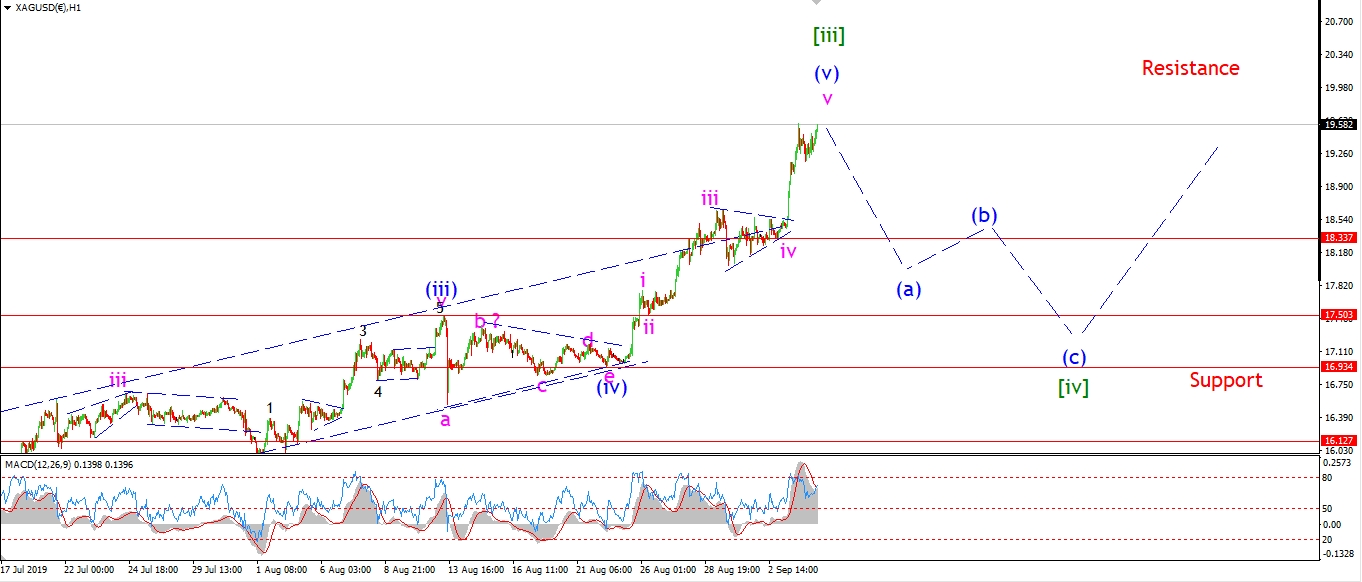 [/vc_column_text][/vc_column][vc_column width=”1/3″][vc_custom_heading text=”4 Hours” use_theme_fonts=”yes”][vc_column_text]
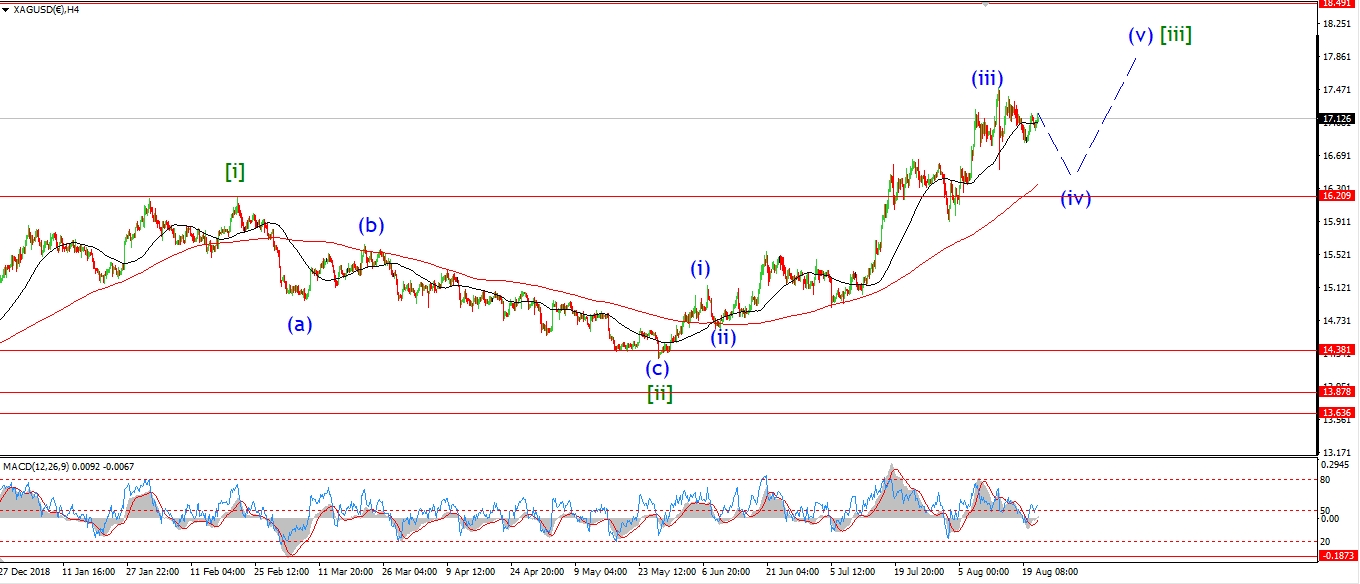 [/vc_column_text][vc_custom_heading text=”Daily” use_theme_fonts=”yes”][vc_column_text]
 [/vc_column_text][/vc_column][/vc_row]
[vc_row][vc_column][vc_column_text]
Silver is loosing upside momentum this evening.
The drop off the high today looks corrective,
so we will likely see another rally in wave ‘v’ of (v) over the coming days.
But I do think that we are reaching a top now in wave [iii] and wave [iv] will follow soon enough.
Silver has rallied 36% since the end of May.
We are definitely due a breather at least now!
Tomorrow;
The next couple of sessions will be telling,
any reasonable decline that breaks the recent triangle low at 18.33 will signal that wave [iv] has begun.
[/vc_column_text][/vc_column][/vc_row]
[vc_row][vc_column][vc_separator border_width=”5″][/vc_column][/vc_row][vc_row][vc_column][vc_column_text]
S&P 500.
[/vc_column_text][/vc_column][/vc_row][vc_row][vc_column][vc_separator border_width=”5″][/vc_column][/vc_row][vc_row][vc_column width=”2/3″][vc_custom_heading text=”1 hr” use_theme_fonts=”yes”][vc_column_text]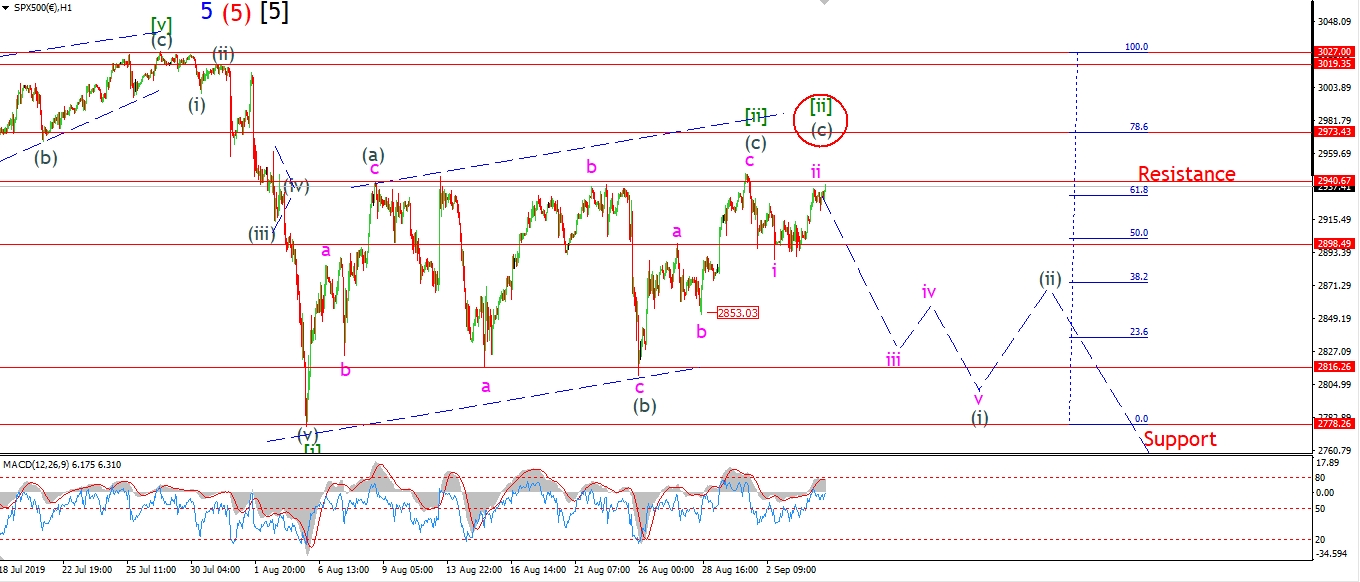 [/vc_column_text][/vc_column][vc_column width=”1/3″][vc_custom_heading text=”4 Hours” use_theme_fonts=”yes”][vc_column_text]
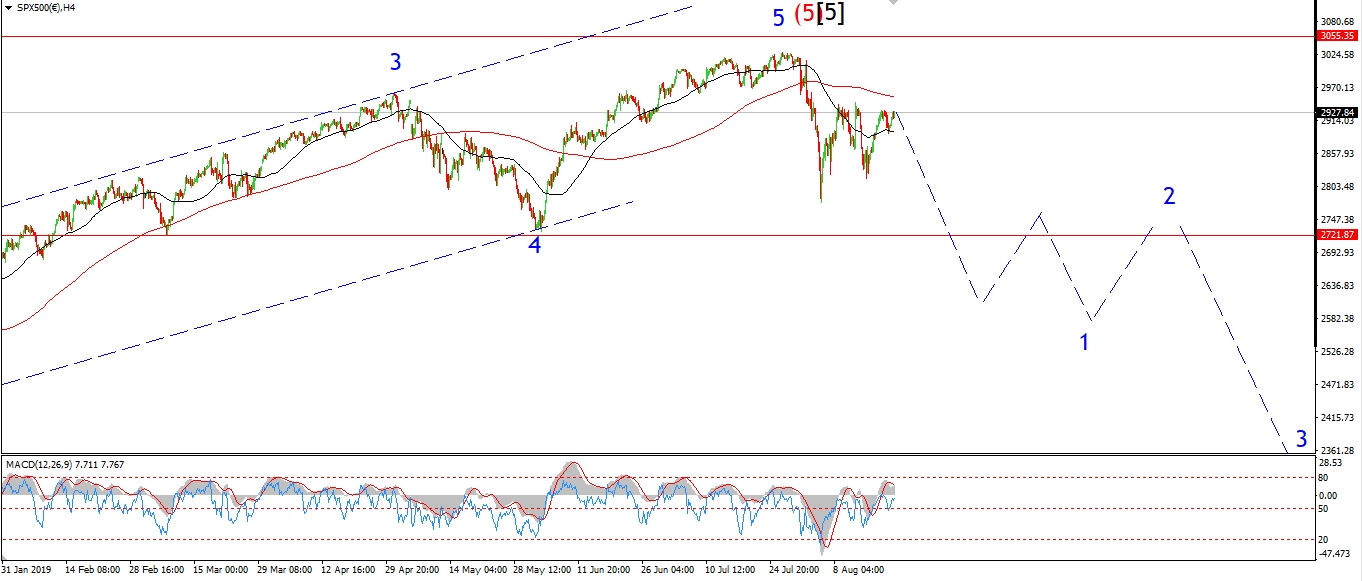 [/vc_column_text][vc_custom_heading text=”Daily” use_theme_fonts=”yes”][vc_column_text]
 [/vc_column_text][/vc_column][/vc_row]
[vc_row][vc_column][vc_column_text]
We are in a similar situation in the S&P also.
If the recent high at 2940 holds,
then the current count remains valid.
If we get a break of that level tomorrow,
then wave (c) of [ii] is tracing out an ending diagonal.
The alternate count for wave (c) suggests a top at the 78.6 retracement level in the area of 2970.
And at that point I will be looking for a decline in wave [iii] to begin again.
Tomorrow;
Watch for 2940 to hold and wave (i) to continue lower.
If that level breaks,
we will have to wait until next week for wave (i) down to begin.
[/vc_column_text][/vc_column][/vc_row]
[vc_row][vc_column][vc_separator border_width=”5″][/vc_column][/vc_row]