
[vc_row][vc_column][vc_separator border_width=”5″][/vc_column][/vc_row]
[vc_row][vc_column][vc_column_text]
Good evening to everyone.
A bit of house keeping first.
Monday is a national holiday in the U.S and the markets are closed.
So there will not be any update on Monday.
Apart from that,
all is well in the world, so lets get down to business!
[/vc_column_text][/vc_column][/vc_row]
[vc_row][vc_column][vc_separator border_width=”5″][/vc_column][/vc_row]
[vc_row][vc_column][vc_column_text]
EURUSD
[/vc_column_text][/vc_column][/vc_row]
[vc_row][vc_column][vc_separator border_width=”5″][/vc_column][/vc_row][vc_row][vc_column width=”2/3″][vc_custom_heading text=”1 hr” use_theme_fonts=”yes”][vc_column_text]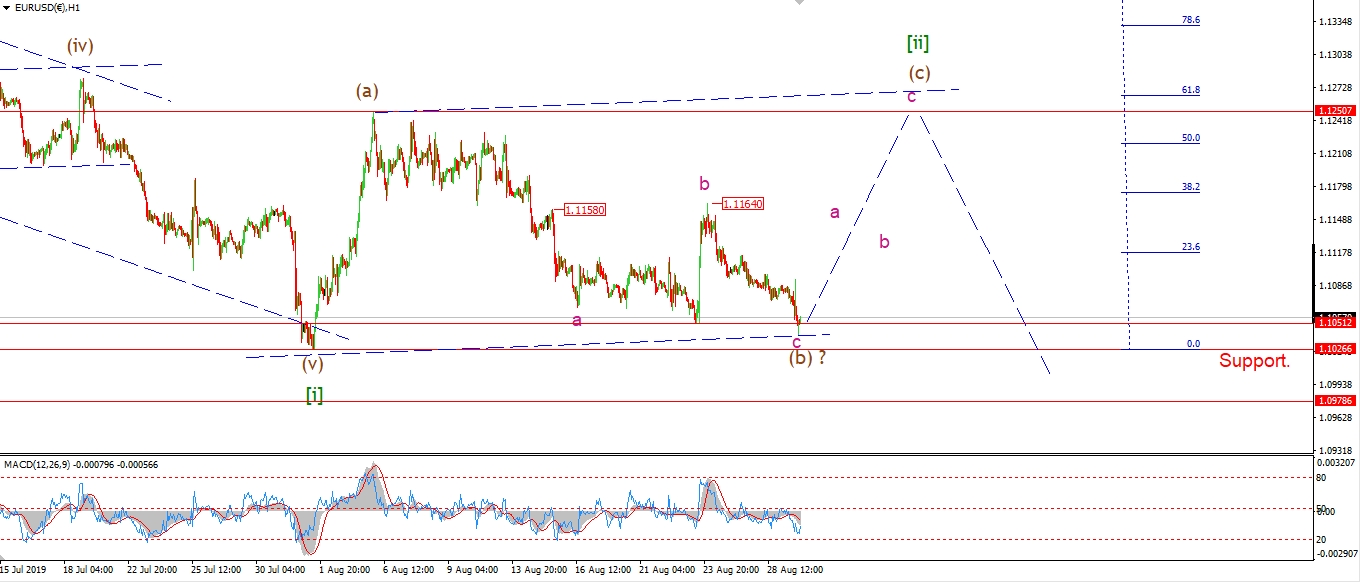 [/vc_column_text][/vc_column][vc_column width=”1/3″][vc_custom_heading text=”4 Hours” use_theme_fonts=”yes”][vc_column_text]
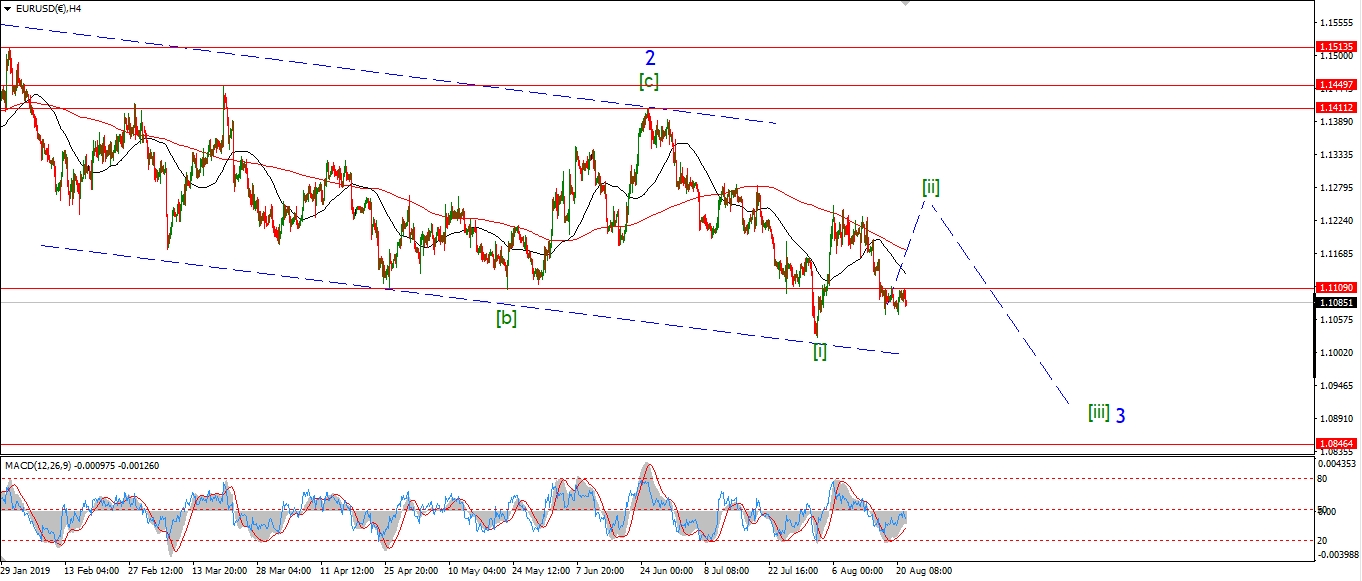 [/vc_column_text][vc_custom_heading text=”Daily” use_theme_fonts=”yes”][vc_column_text]
 [/vc_column_text][/vc_column][/vc_row]
[vc_row][vc_column][vc_column_text]
Another new low in EURUSD today!
This correction in wave [ii] is proving to be as difficult as the rest.
It looks like the recent spike last week was part of an internal wave ‘b’ of (b).
and todays new low is wave ‘c’ of (b).
I am still working on the idea of a flat correction in wave [ii].
But if wave [ii] is now tracing out an expanded flat correction,
then we will see wave (b) break below 1.1026 before turning higher.
Tomorrow;
Watch for wave (b) to hit a final low and turn higher into wave (c).
It looks like wave (c) will have to wait until next week now.
[/vc_column_text][/vc_column][/vc_row]
[vc_row][vc_column][vc_separator border_width=”5″][/vc_column][/vc_row][vc_row][vc_column][vc_column_text]
GBPUSD
[/vc_column_text][/vc_column][/vc_row][vc_row][vc_column][vc_separator border_width=”5″][/vc_column][/vc_row][vc_row][vc_column width=”2/3″][vc_custom_heading text=”1 hr” use_theme_fonts=”yes”][vc_column_text]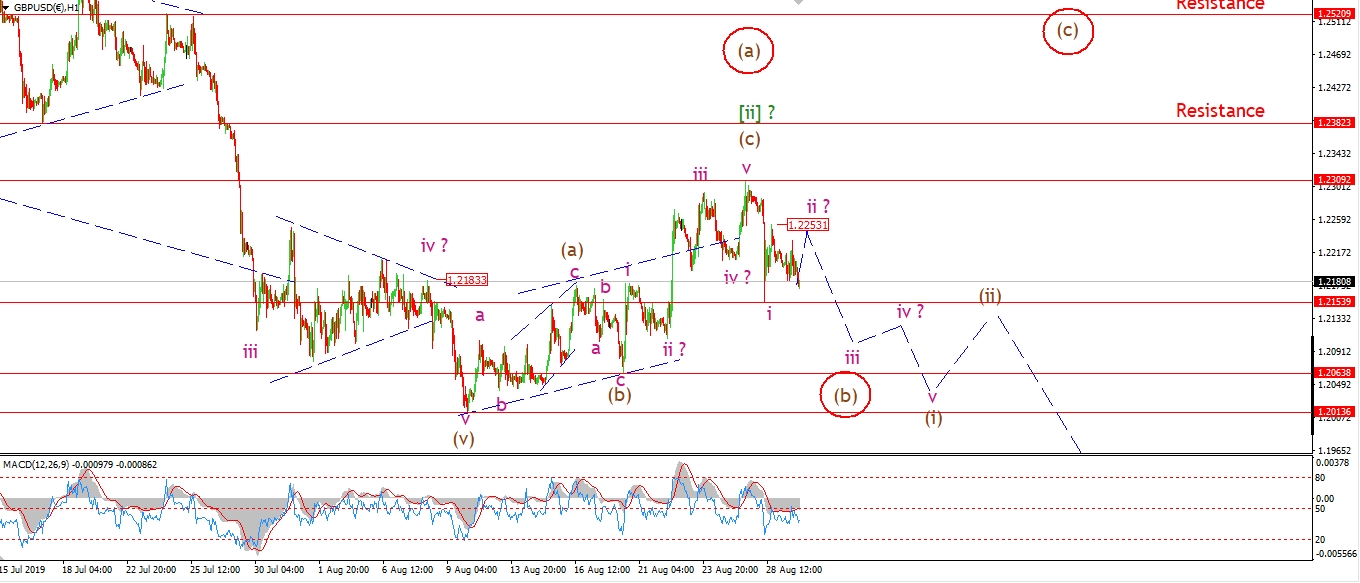 [/vc_column_text][/vc_column][vc_column width=”1/3″][vc_custom_heading text=”4 Hours” use_theme_fonts=”yes”][vc_column_text]
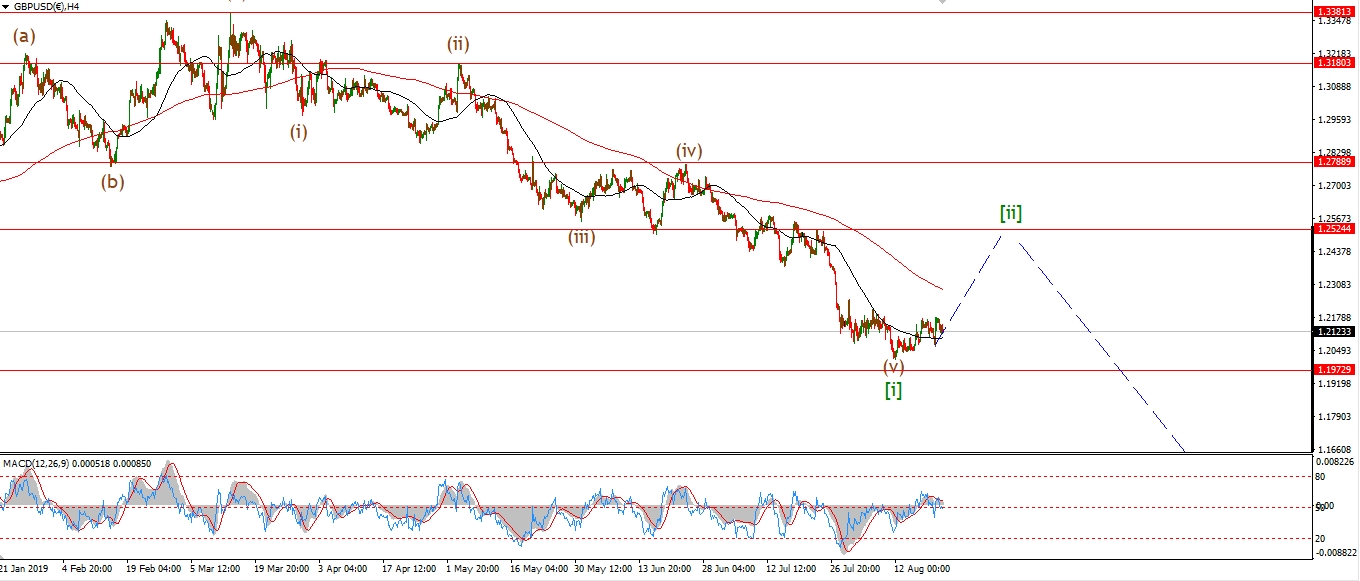 [/vc_column_text][vc_custom_heading text=”Daily” use_theme_fonts=”yes”][vc_column_text]
 [/vc_column_text][/vc_column][/vc_row]
[vc_row][vc_column][vc_column_text]
Cable seems to be creating a larger structure in wave ‘ii’ pink now.
Todays action is corrective again to the downside.
So I expect wave ‘ii’ will again push above 1.2253,
to complete a three wave correction.
before turning lower in wave ‘iii’ of (i) next week.
Tomorrow;
Wave ‘ii’ should be done by tomorrow evening.
Watch for wave ‘ii’ to hold below 1.2309 and then turn lower again in wave ‘iii’.
[/vc_column_text][/vc_column][/vc_row]
[vc_row][vc_column][vc_separator border_width=”5″][/vc_column][/vc_row][vc_row][vc_column][vc_column_text]
USDJPY
[/vc_column_text][/vc_column][/vc_row][vc_row][vc_column][vc_separator border_width=”5″][/vc_column][/vc_row][vc_row][vc_column width=”2/3″][vc_custom_heading text=”1 hr” use_theme_fonts=”yes”][vc_column_text]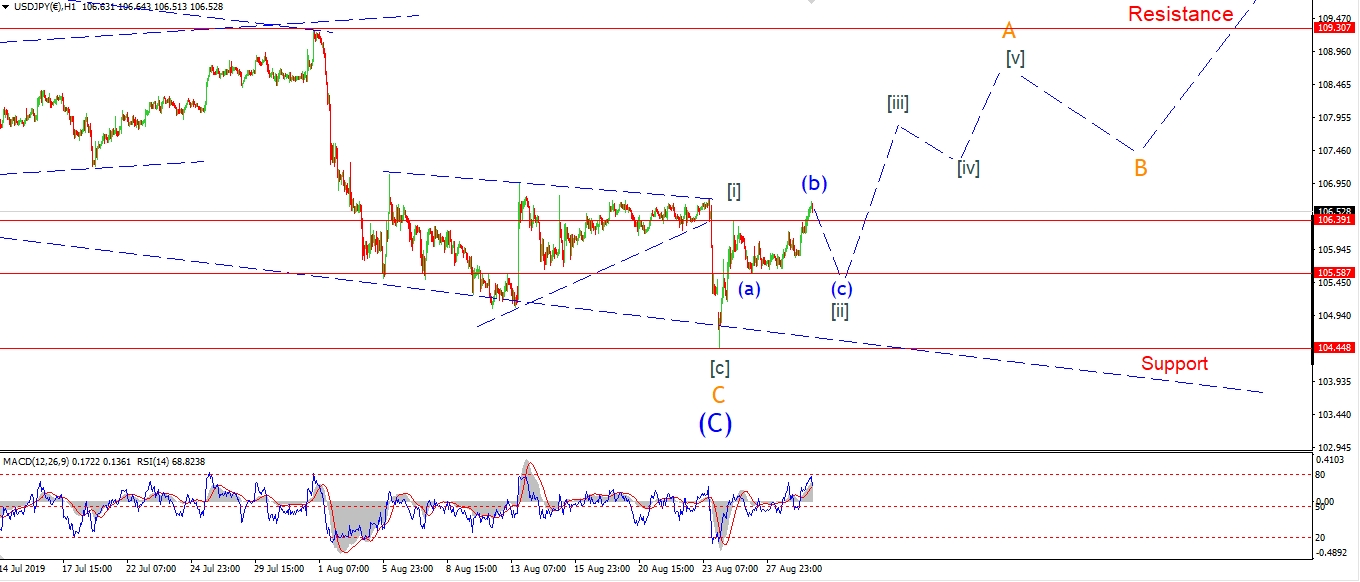 [/vc_column_text][/vc_column][vc_column width=”1/3″][vc_custom_heading text=”4 Hours” use_theme_fonts=”yes”][vc_column_text]
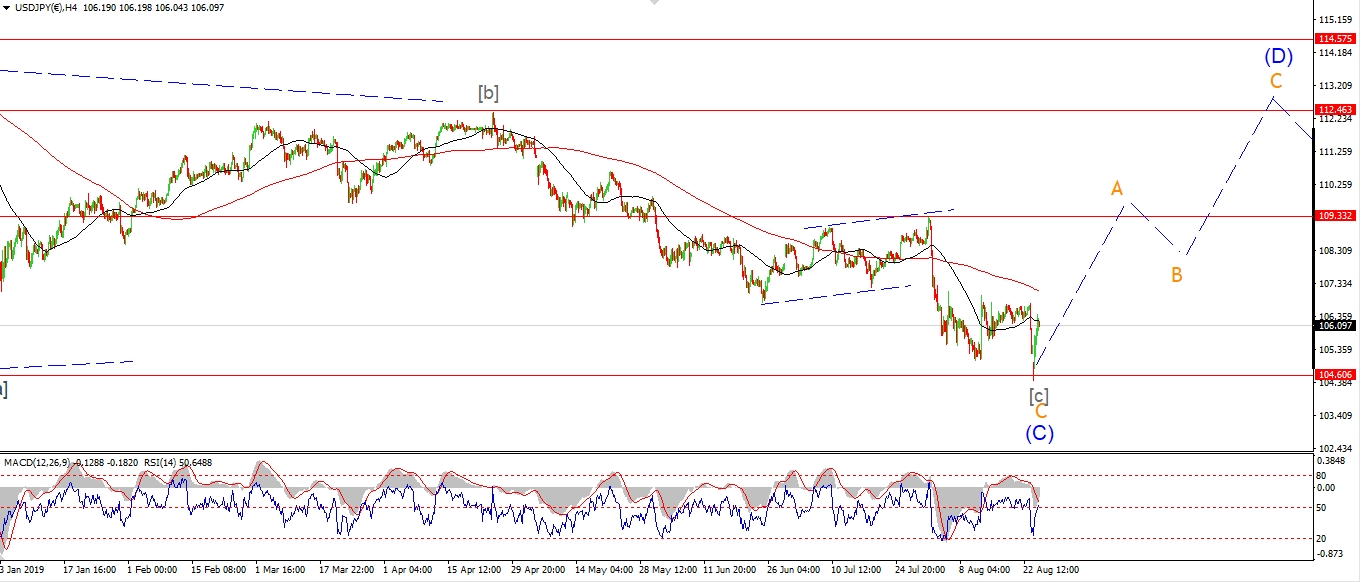 [/vc_column_text][vc_custom_heading text=”Daily” use_theme_fonts=”yes”][vc_column_text]
 [/vc_column_text][/vc_column][/vc_row]
[vc_row][vc_column][vc_column_text]
As with the other two USD pairs,
I am not convinced todays action is the end of the corrective phase just yet.
The rise off the wave (a) low at 105.58 is in three waves.
So this suggests another drop in wave (c) left
to complete an expanded flat correction in wave [ii].
Tomorrow;
watch for wave (b) to top out overnight and fall into the open tomorrow.
A break of 106.00 again will confirm wave (c) is underway.
[/vc_column_text][/vc_column][/vc_row]
[vc_row][vc_column][vc_separator border_width=”5″][/vc_column][/vc_row][vc_row][vc_column][vc_column_text]
DOW JONES INDUSTRIALS
[/vc_column_text][/vc_column][/vc_row][vc_row][vc_column][vc_separator border_width=”5″][/vc_column][/vc_row][vc_row][vc_column width=”2/3″][vc_custom_heading text=”1 hr” use_theme_fonts=”yes”][vc_column_text]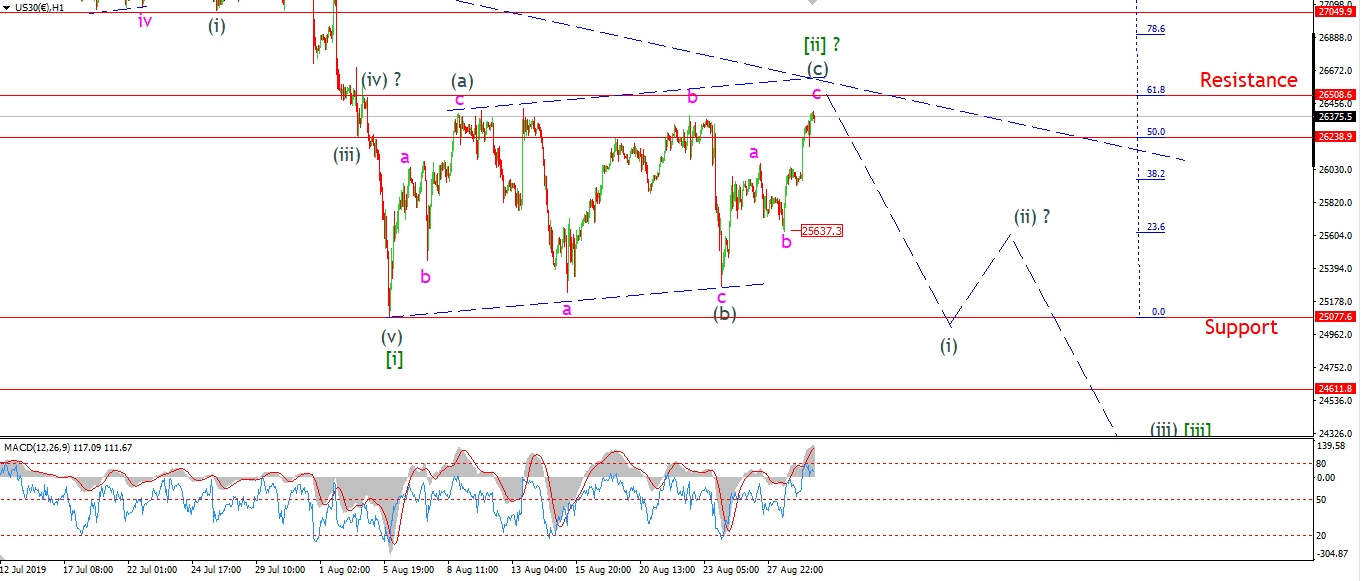 [/vc_column_text][/vc_column][vc_column width=”1/3″][vc_custom_heading text=”4 Hours” use_theme_fonts=”yes”][vc_column_text]
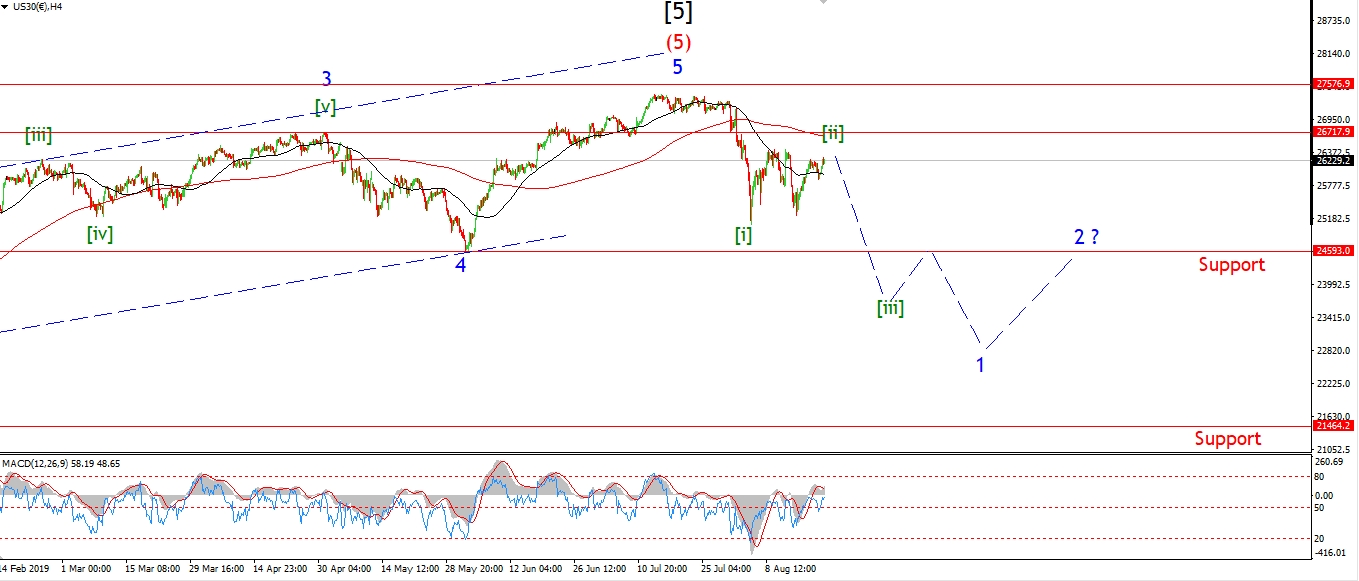 [/vc_column_text][vc_custom_heading text=”Daily” use_theme_fonts=”yes”][vc_column_text]
 [/vc_column_text][/vc_column][/vc_row]
[vc_row][vc_column][vc_column_text]
The theme tonight seems to be never ending corrections.
The Dow is no different on that front.
Todays rally has forced me to move to the alternate count for wave [ii] green again.
Wave [ii] seems to be tracing out a triple combination correction.
And that would explain the false starts in the wave count.
Each acceleration lower over the last few weeks has been regarded as the beginning of wave [iii] down.
But each rally has fully retraced the previous impulsive decline.
Add to that the fact that every rally has been a three wave structure to the upside,
and you can see how this correction is proving so difficult to track.
Tomorrow;
After the rally today,
the price is back at the upper trend channel line again.
The rally in wave (c) is still labelled as three waves.
So I think this rally is doomed to failure.
Watch for wave (c) to top out again tomorrow and even turn back down to begin wave (i) of [iii].
[/vc_column_text][/vc_column][/vc_row]
[vc_row][vc_column][vc_separator border_width=”5″][/vc_column][/vc_row][vc_row][vc_column][vc_column_text]
GOLD
[/vc_column_text][/vc_column][/vc_row][vc_row][vc_column][vc_separator border_width=”5″][/vc_column][/vc_row][vc_row][vc_column width=”2/3″][vc_custom_heading text=”1 hr” use_theme_fonts=”yes”][vc_column_text]
 [/vc_column_text][/vc_column][vc_column width=”1/3″][vc_custom_heading text=”4 Hours” use_theme_fonts=”yes”][vc_column_text]
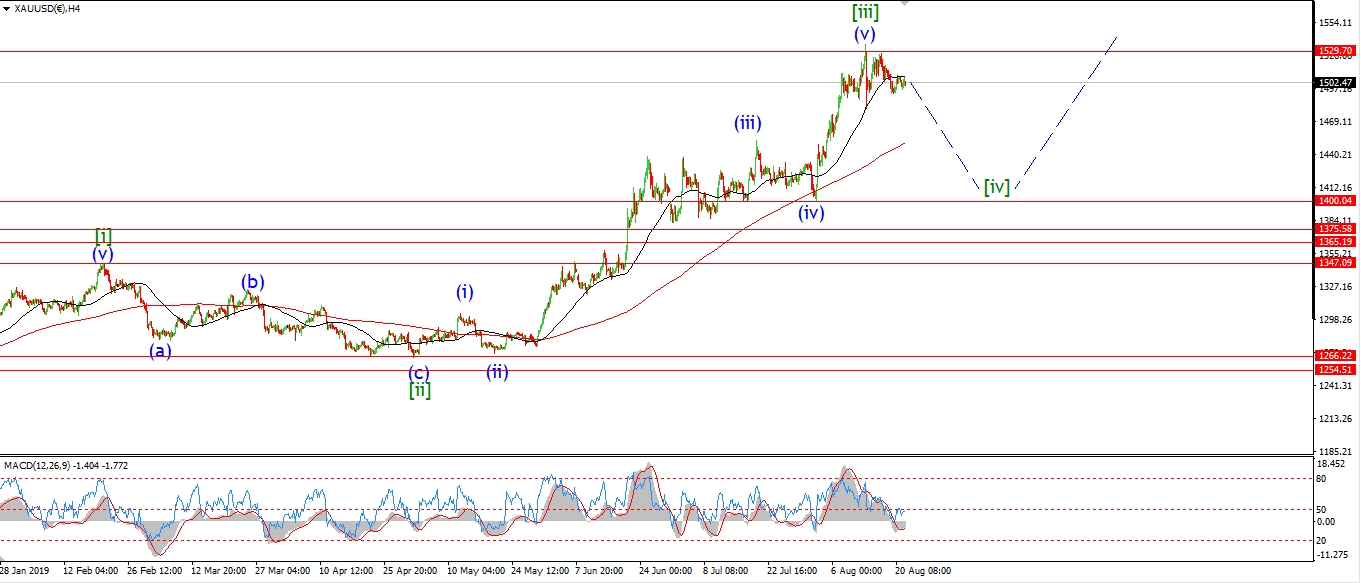 [/vc_column_text][vc_custom_heading text=”Daily” use_theme_fonts=”yes”][vc_column_text]
 [/vc_column_text][/vc_column][/vc_row]
[vc_row][vc_column][vc_column_text]
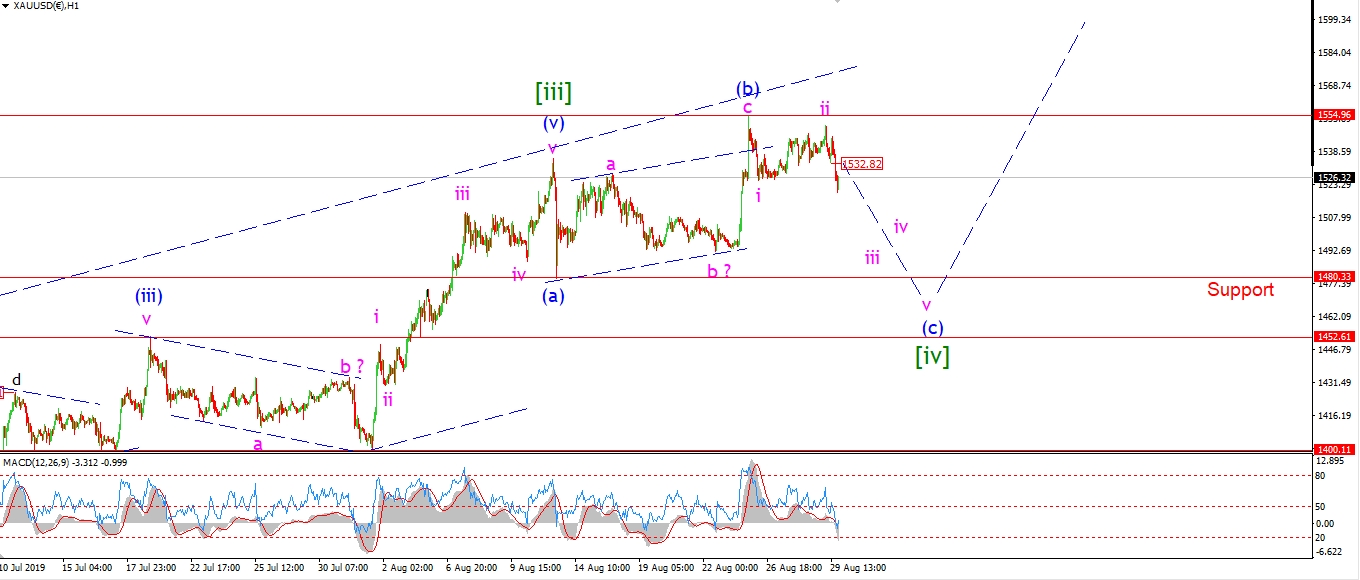
Gold has fallen impulsively today off a lower high in wave ‘ii’ pink.
this decline is viewed as wave ‘iii’ of (c).
And the minimum target for wave (c) remains the same at 1480,
which will complete the larger correction in wave [iv].
Tomorrow;
Watch for wave ‘iii’ of (c) to hold below 1530 as wave (c) develops from here.
Wave ‘iii’ should carry us most of the way towards the target.
[/vc_column_text][/vc_column][/vc_row]
[vc_row][vc_column][vc_separator border_width=”5″][/vc_column][/vc_row][vc_row][vc_column][vc_column_text]
U.S CRUDE OIL
[/vc_column_text][/vc_column][/vc_row][vc_row][vc_column][vc_separator border_width=”5″][/vc_column][/vc_row][vc_row][vc_column width=”2/3″][vc_custom_heading text=”1 hr” use_theme_fonts=”yes”][vc_column_text]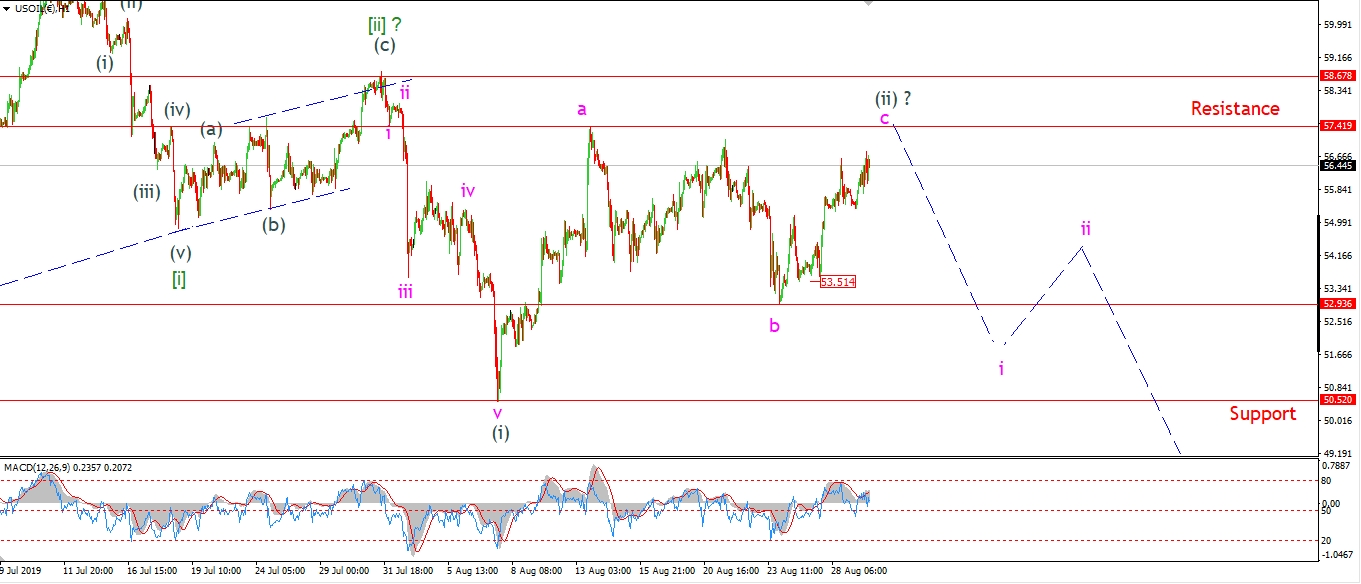 [/vc_column_text][/vc_column][vc_column width=”1/3″][vc_custom_heading text=”4 Hours” use_theme_fonts=”yes”][vc_column_text]
 [/vc_column_text][vc_custom_heading text=”Daily” use_theme_fonts=”yes”][vc_column_text]
 [/vc_column_text][/vc_column][/vc_row]
[vc_row][vc_column][vc_column_text]
I am not ready to abandon the bearish outlook in crude just yet,
the alternate count is still a possibility,
but the short term action is still very corrective to the upside at the moment.
And this suggests a lower degree second wave is now playing out.
After todays slight new high,
I have allowed for the price to drift a little higher in wave ‘c’ of (ii).
A break of 57.41 will do it for wave (ii),
And at that point,
the market will be open to a sharp drop to begin wave (iii) of [iii].
But that drop into wave (iii) is not likely to begin until next week now.
Tomorrow;
Resistance at 57.41 is the target for wave ‘c’.
And wave (ii) must not break 58.67.
If that happens,
the alternate count will be triggered.
[/vc_column_text][/vc_column][/vc_row]
[vc_row][vc_column][vc_separator border_width=”5″][/vc_column][/vc_row][vc_row][vc_column][vc_column_text]
US 10 yr Treasuries.
[/vc_column_text][/vc_column][/vc_row][vc_row][vc_column][vc_separator border_width=”5″][/vc_column][/vc_row][vc_row][vc_column width=”2/3″][vc_custom_heading text=”1 hr” use_theme_fonts=”yes”][vc_column_text]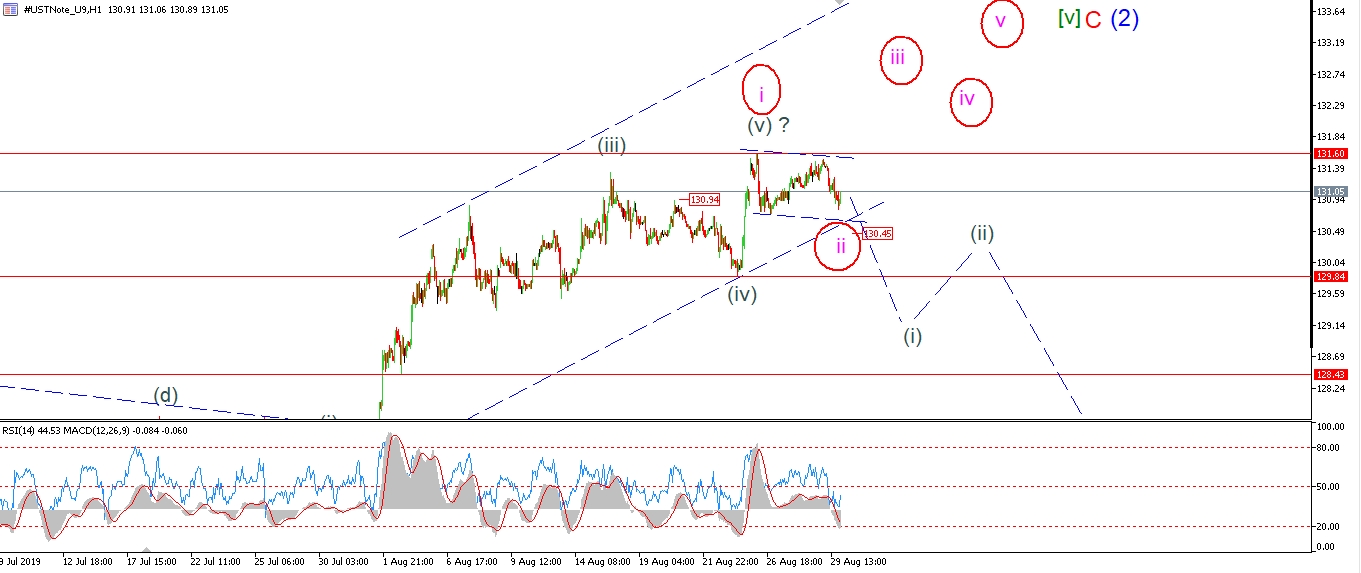 [/vc_column_text][/vc_column][vc_column width=”1/3″][vc_custom_heading text=”4 Hours” use_theme_fonts=”yes”][vc_column_text]
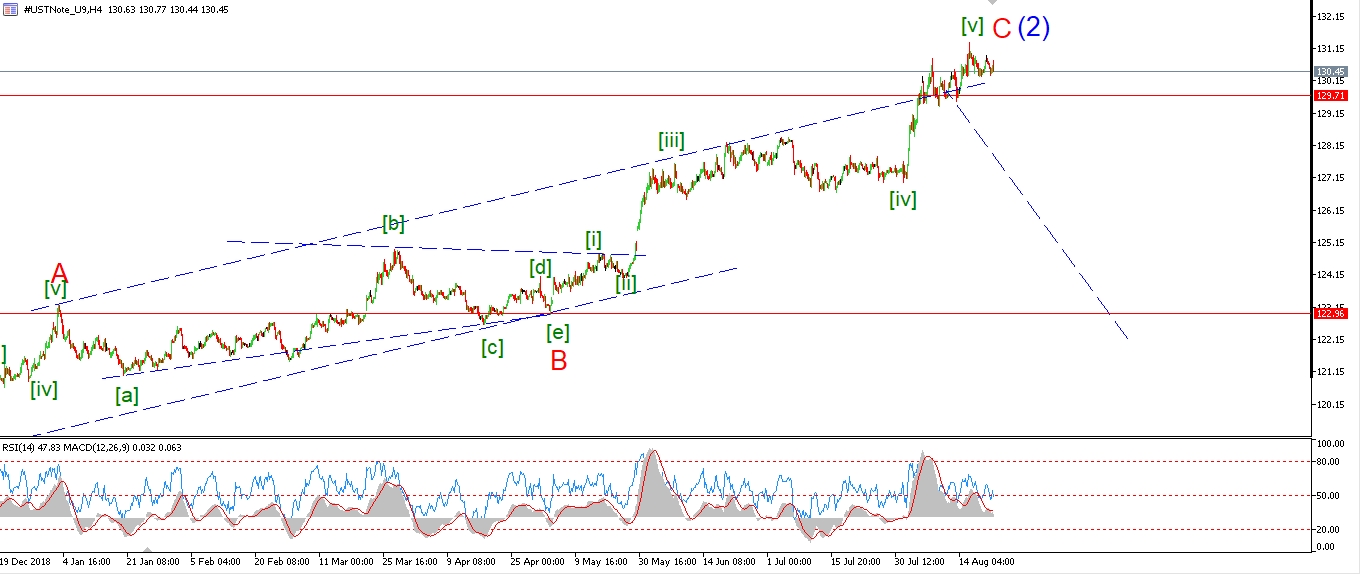 [/vc_column_text][vc_custom_heading text=”Daily” use_theme_fonts=”yes”][vc_column_text]
 [/vc_column_text][/vc_column][/vc_row]
[vc_row][vc_column][vc_column_text]
Bonds did trade lower again today,
but the decline was a little timid and not like a third wave should be.
So the short term action is beginning to favor the alternate count now.
If the price falls to the lower trendline and then bounces again tomorrow,
that should be enough to switch to the alternate idea for wave (v) of [v].
Tomorrow;
Price must fall sharply tomorrow and break 1129.80 to confirm wave (i).
131.60 must hold.
[/vc_column_text][/vc_column][/vc_row]
[vc_row][vc_column][vc_separator border_width=”5″][/vc_column][/vc_row][vc_row][vc_column][vc_column_text]
SILVER
[/vc_column_text][/vc_column][/vc_row][vc_row][vc_column][vc_separator border_width=”5″][/vc_column][/vc_row][vc_row][vc_column width=”2/3″][vc_custom_heading text=”1 hr” use_theme_fonts=”yes”][vc_column_text]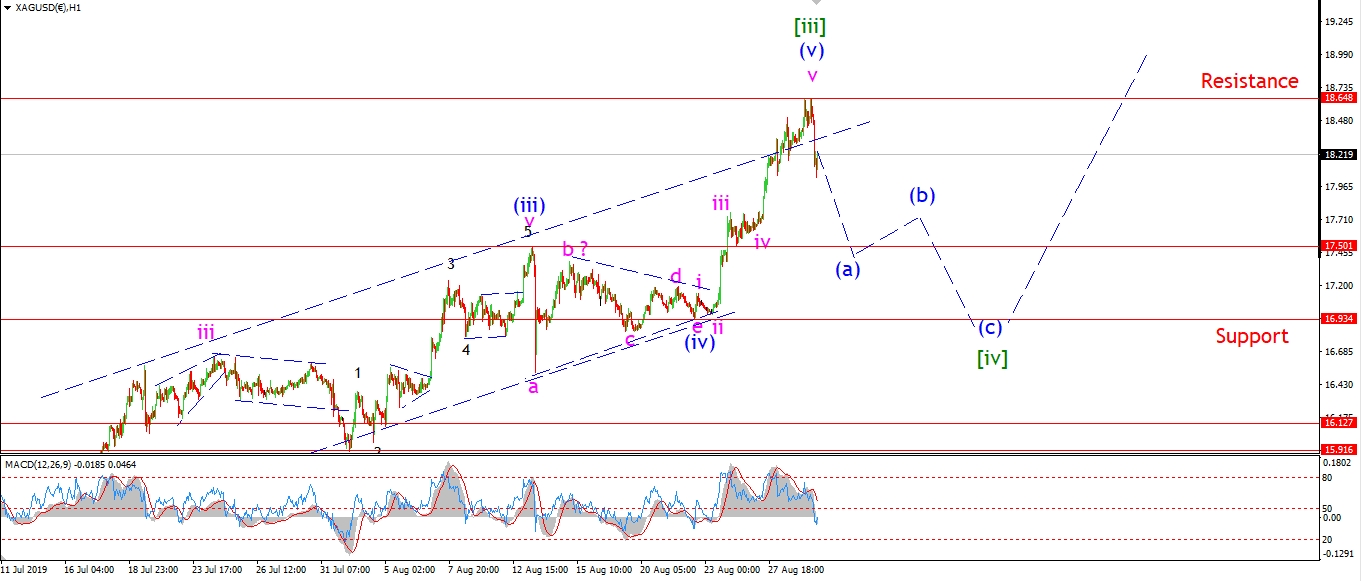 [/vc_column_text][/vc_column][vc_column width=”1/3″][vc_custom_heading text=”4 Hours” use_theme_fonts=”yes”][vc_column_text]
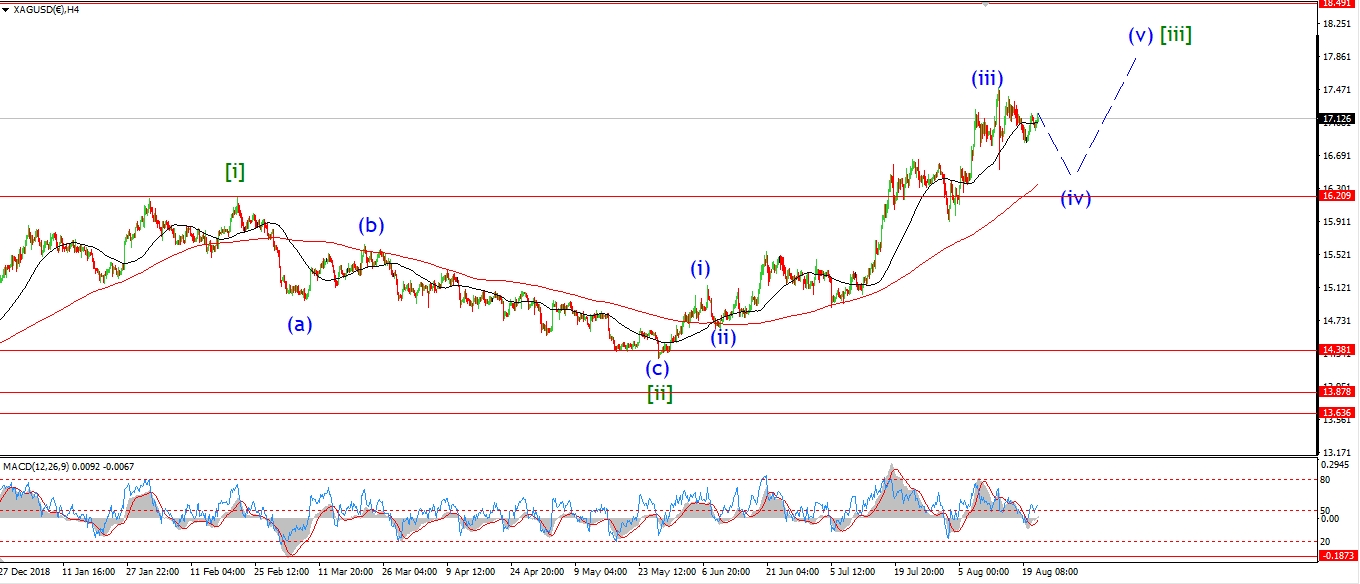 [/vc_column_text][vc_custom_heading text=”Daily” use_theme_fonts=”yes”][vc_column_text]
 [/vc_column_text][/vc_column][/vc_row]
[vc_row][vc_column][vc_column_text]
After a small early rally this morning which created a slight new high,
silver prices then turned sharply lower,
and dropped back underneath the trend channel line again.
This is exactly the sort of action I am looking for the begin wave [iv].
So todays decline should be the beginning of wave (a) of [iv].
We will see how wave (a) plays out over the coming days,
and this should give us a clue what form the larger pattern in wave [iv] will take.
Tomorrow;
Watch for wave (a) to continue lower after a small lower high completes below 18.64.
The trend channel should hold any correction higher from here.
[/vc_column_text][/vc_column][/vc_row]
[vc_row][vc_column][vc_separator border_width=”5″][/vc_column][/vc_row][vc_row][vc_column][vc_column_text]
S&P 500.
[/vc_column_text][/vc_column][/vc_row][vc_row][vc_column][vc_separator border_width=”5″][/vc_column][/vc_row][vc_row][vc_column width=”2/3″][vc_custom_heading text=”1 hr” use_theme_fonts=”yes”][vc_column_text]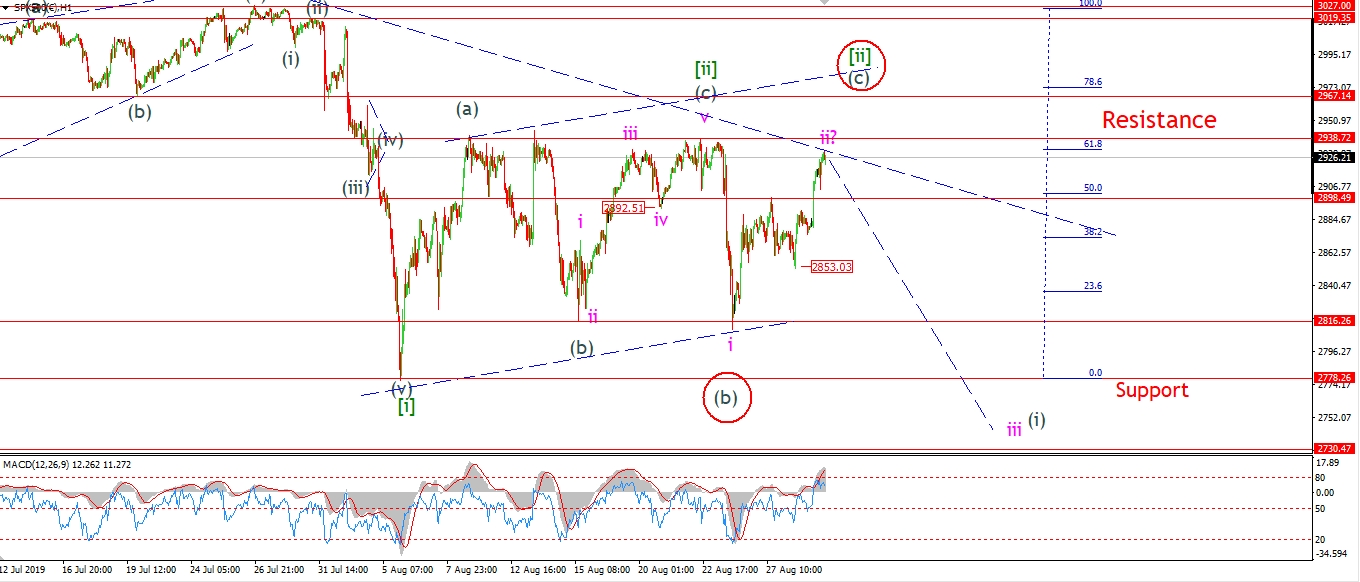 [/vc_column_text][/vc_column][vc_column width=”1/3″][vc_custom_heading text=”4 Hours” use_theme_fonts=”yes”][vc_column_text]
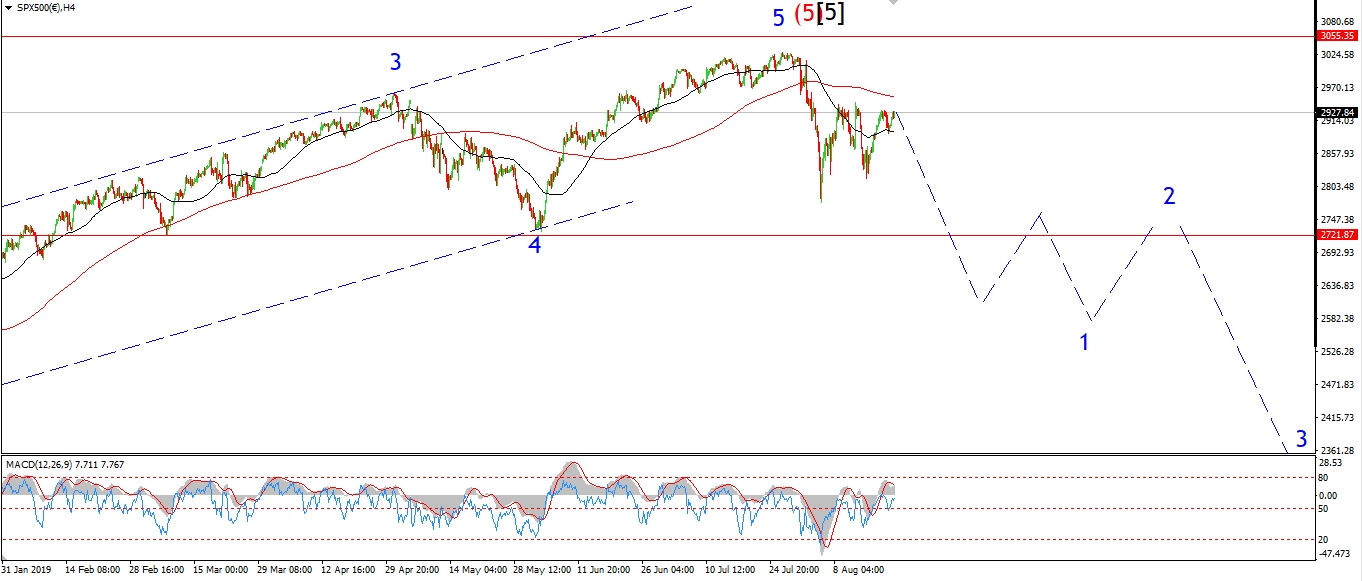 [/vc_column_text][vc_custom_heading text=”Daily” use_theme_fonts=”yes”][vc_column_text]
 [/vc_column_text][/vc_column][/vc_row]
[vc_row][vc_column][vc_column_text]
The S&P is very close to triggering the alternate count now also.
If we see a break of 2938 tomorrow,
that will signal wave [ii] green is still in force,
and the beginning of wave [iii] will be postponed until next week.
The alternate count is every much as bearish as the current wave count.
And wave [iii] down will cause havoc either way.
In the short term 2853 is the level which will decide the fate of the rally.
A break of that level will signal wave (i) of [iii] is underway.
Tomorrow;
Watch for 2938 to hold and wave ‘iii’ down to begin.
2853 is the key level in the short term count now.
[/vc_column_text][/vc_column][/vc_row]
[vc_row][vc_column][vc_separator border_width=”5″][/vc_column][/vc_row]