
[vc_row][vc_column][vc_separator border_width=”5″][/vc_column][/vc_row]
[vc_row][vc_column][vc_column_text]
Hello there everyone, I hope the day went well for you.
I will leave the video until tomorrow, as I did not get time to record today.
It was a darn interesting day thats for sure,
so lets get into it eh!
[/vc_column_text][/vc_column][/vc_row]
[vc_row][vc_column][vc_separator border_width=”5″][/vc_column][/vc_row]
[vc_row][vc_column][vc_column_text]
EURUSD
[/vc_column_text][/vc_column][/vc_row]
[vc_row][vc_column][vc_separator border_width=”5″][/vc_column][/vc_row][vc_row][vc_column width=”2/3″][vc_custom_heading text=”1 hr” use_theme_fonts=”yes”][vc_column_text]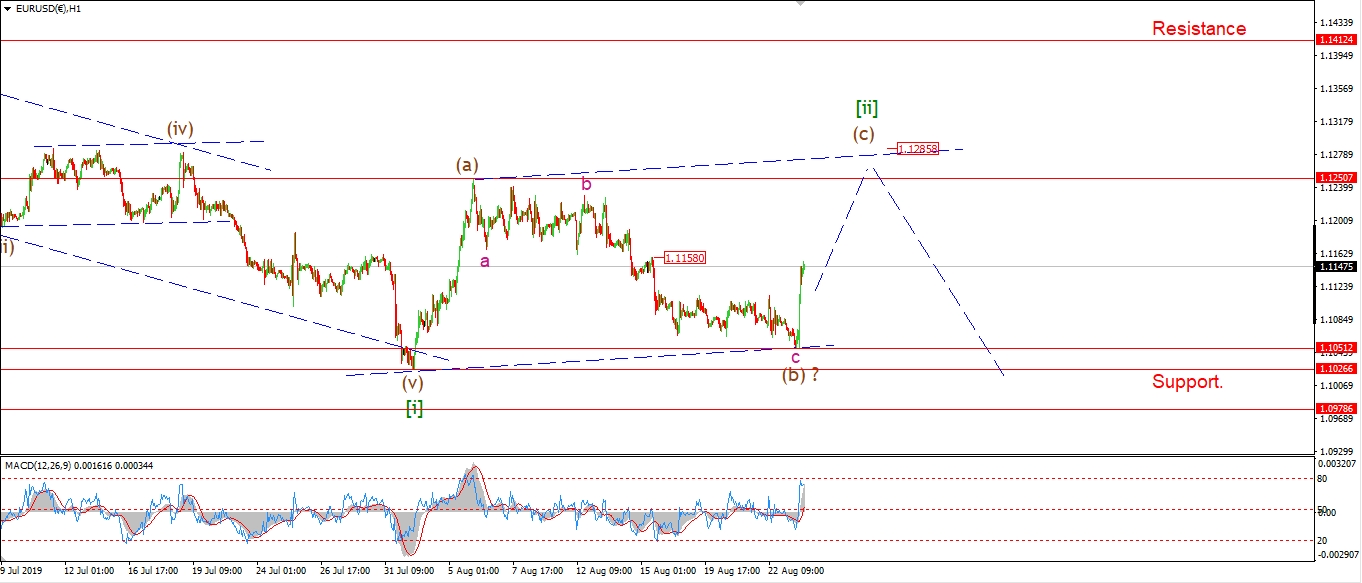 [/vc_column_text][/vc_column][vc_column width=”1/3″][vc_custom_heading text=”4 Hours” use_theme_fonts=”yes”][vc_column_text]
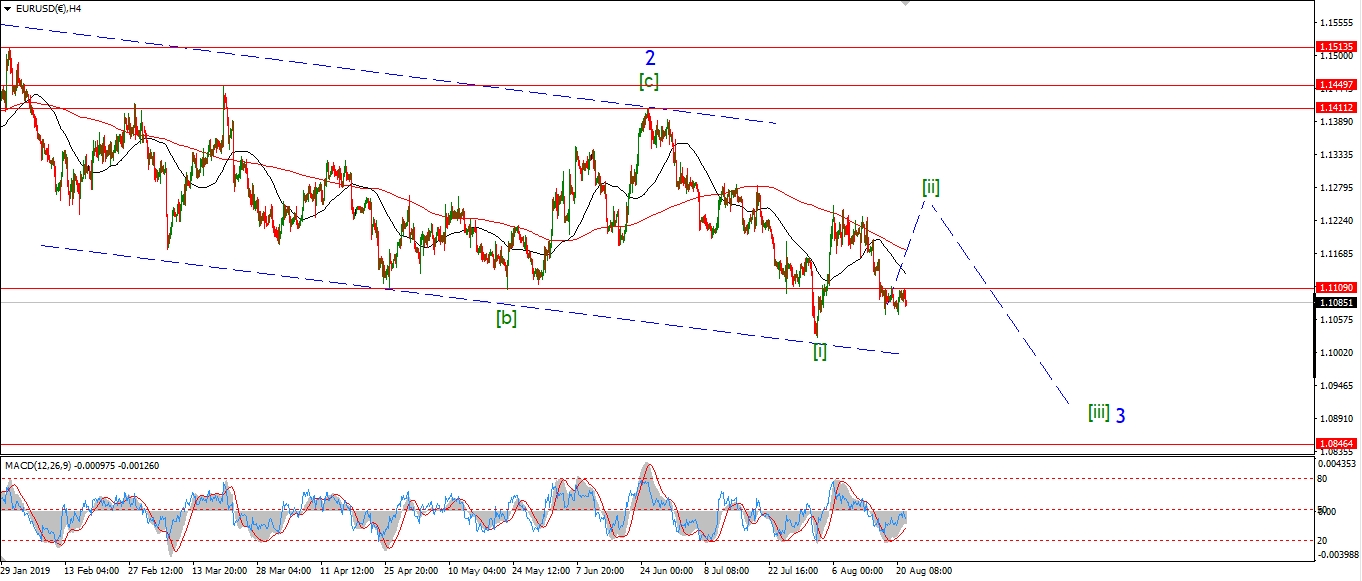 [/vc_column_text][vc_custom_heading text=”Daily” use_theme_fonts=”yes”][vc_column_text]
 [/vc_column_text][/vc_column][/vc_row]
[vc_row][vc_column][vc_column_text]
The final low for wave (b) of [ii] came in at 1.1051 this morning.
The price has spiked higher today in a nice impulsive looking move.
This action suggests that wave (c) is now underway off 1.1051.
Wave (c) should create a five wave pattern higher,
and the minimum target lies at 1.1250 where the high of wave (a) will be broken.
Monday;
Watch for wave (c) to hold above 1.1051 and continue higher for at least a few sessions.
when price hits the upper trendline again,
it will be time to look lower again.
[/vc_column_text][/vc_column][/vc_row]
[vc_row][vc_column][vc_separator border_width=”5″][/vc_column][/vc_row][vc_row][vc_column][vc_column_text]
GBPUSD
[/vc_column_text][/vc_column][/vc_row][vc_row][vc_column][vc_separator border_width=”5″][/vc_column][/vc_row][vc_row][vc_column width=”2/3″][vc_custom_heading text=”1 hr” use_theme_fonts=”yes”][vc_column_text]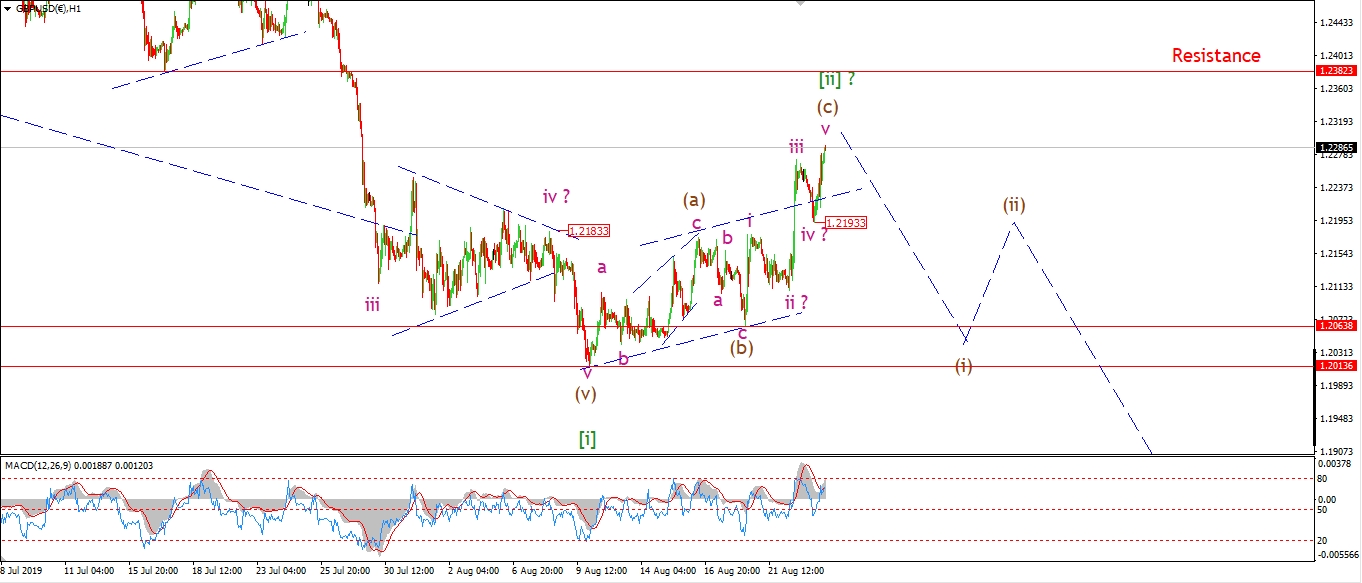 [/vc_column_text][/vc_column][vc_column width=”1/3″][vc_custom_heading text=”4 Hours” use_theme_fonts=”yes”][vc_column_text]
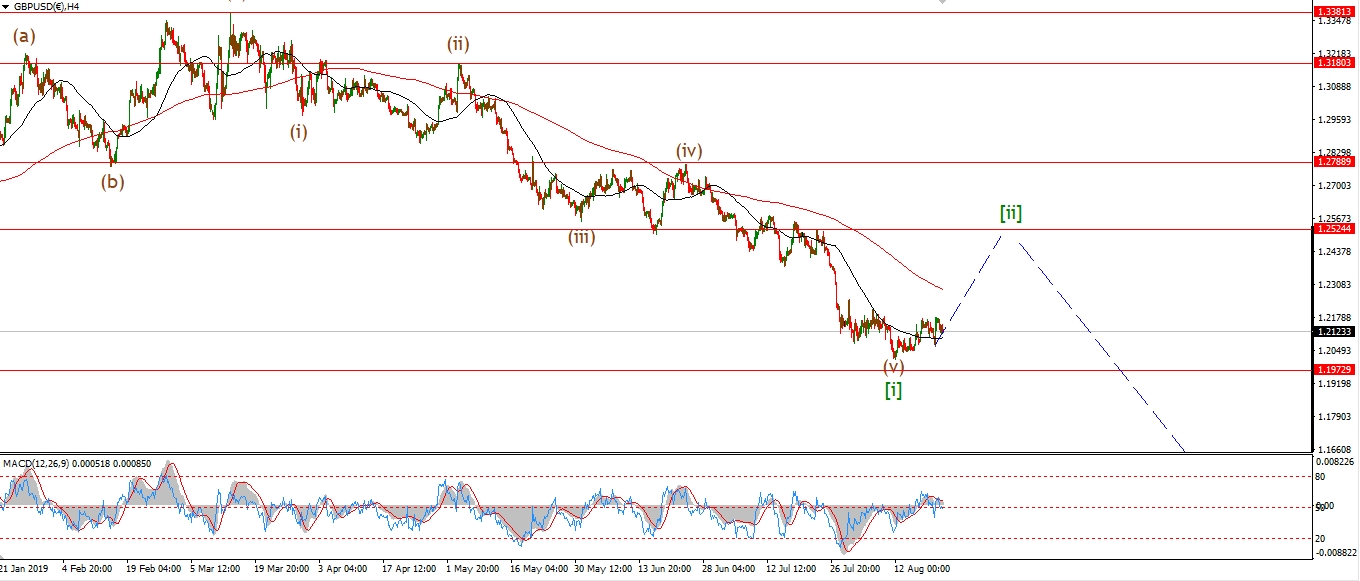 [/vc_column_text][vc_custom_heading text=”Daily” use_theme_fonts=”yes”][vc_column_text]
 [/vc_column_text][/vc_column][/vc_row]
[vc_row][vc_column][vc_column_text]
Cable seems to have completed a five wave rally this week in wave (c).
So we should be close to completing this rally now.
There is one slight caveat to that idea,
it is possible that only wave ‘iii’ topped out today,
with a further high to come early next week in wave ‘v’ pink.
If we see a drop below 1.2193,
that will signal that wave (c) is in fact done.
Monday;
Wave (c) should come to an end by Monday evening.
And next week ill bring in another turn lower into wave (i) of [iii].
[/vc_column_text][/vc_column][/vc_row]
[vc_row][vc_column][vc_separator border_width=”5″][/vc_column][/vc_row][vc_row][vc_column][vc_column_text]
USDJPY
[/vc_column_text][/vc_column][/vc_row][vc_row][vc_column][vc_separator border_width=”5″][/vc_column][/vc_row][vc_row][vc_column width=”2/3″][vc_custom_heading text=”1 hr” use_theme_fonts=”yes”][vc_column_text]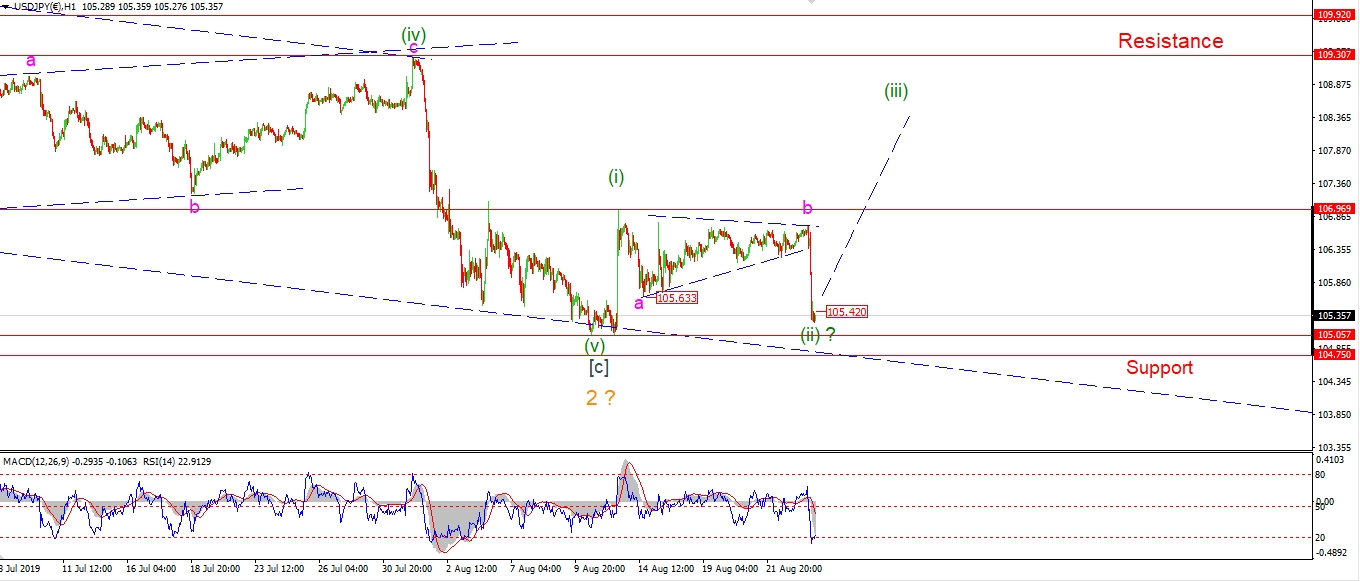 [/vc_column_text][/vc_column][vc_column width=”1/3″][vc_custom_heading text=”4 Hours” use_theme_fonts=”yes”][vc_column_text]
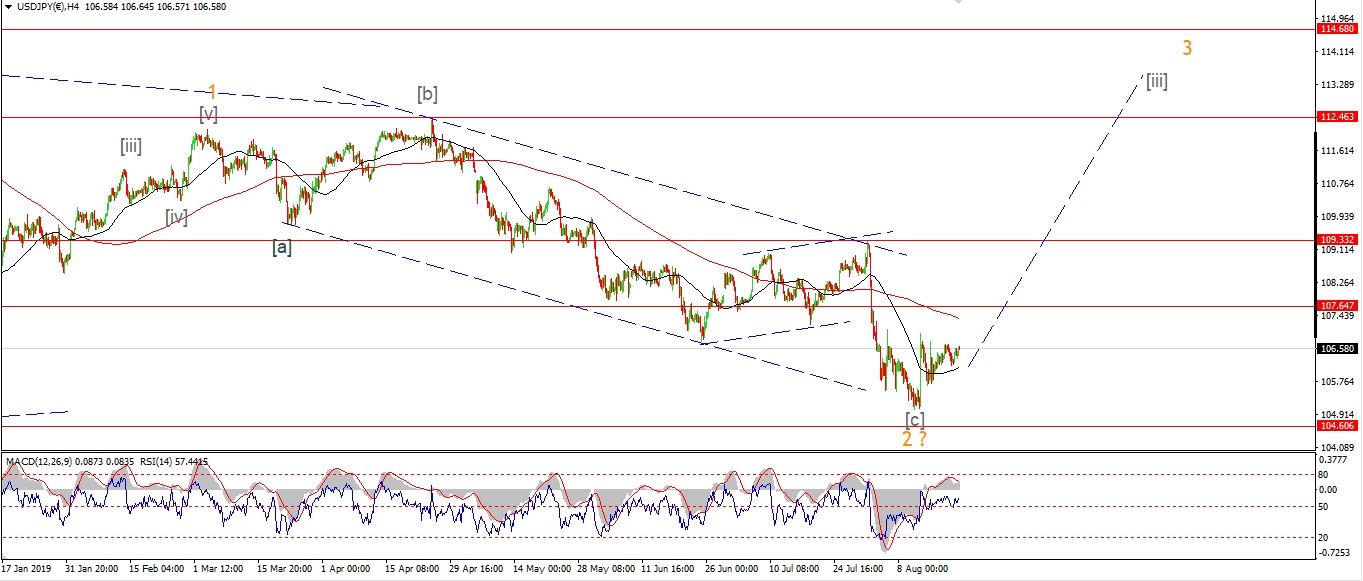 [/vc_column_text][vc_custom_heading text=”Daily” use_theme_fonts=”yes”][vc_column_text]
 [/vc_column_text][/vc_column][/vc_row]
[vc_row][vc_column][vc_column_text]
Wave ‘c’ of (ii) did push lower today and now we are in the danger zone again.
the price is hanging above 105.00 for the moment,
but I do not want to see that level break.
Monday;
Wave ‘c’ has broken the low of wave ‘a’ at 105.63,
so the target has been hit.
I want to see another spike higher very soon to begin wave (iii) up.
A break above 106.96 will signal wave (iii) has begun.
[/vc_column_text][/vc_column][/vc_row]
[vc_row][vc_column][vc_separator border_width=”5″][/vc_column][/vc_row][vc_row][vc_column][vc_column_text]
DOW JONES INDUSTRIALS
[/vc_column_text][/vc_column][/vc_row][vc_row][vc_column][vc_separator border_width=”5″][/vc_column][/vc_row][vc_row][vc_column width=”2/3″][vc_custom_heading text=”1 hr” use_theme_fonts=”yes”][vc_column_text]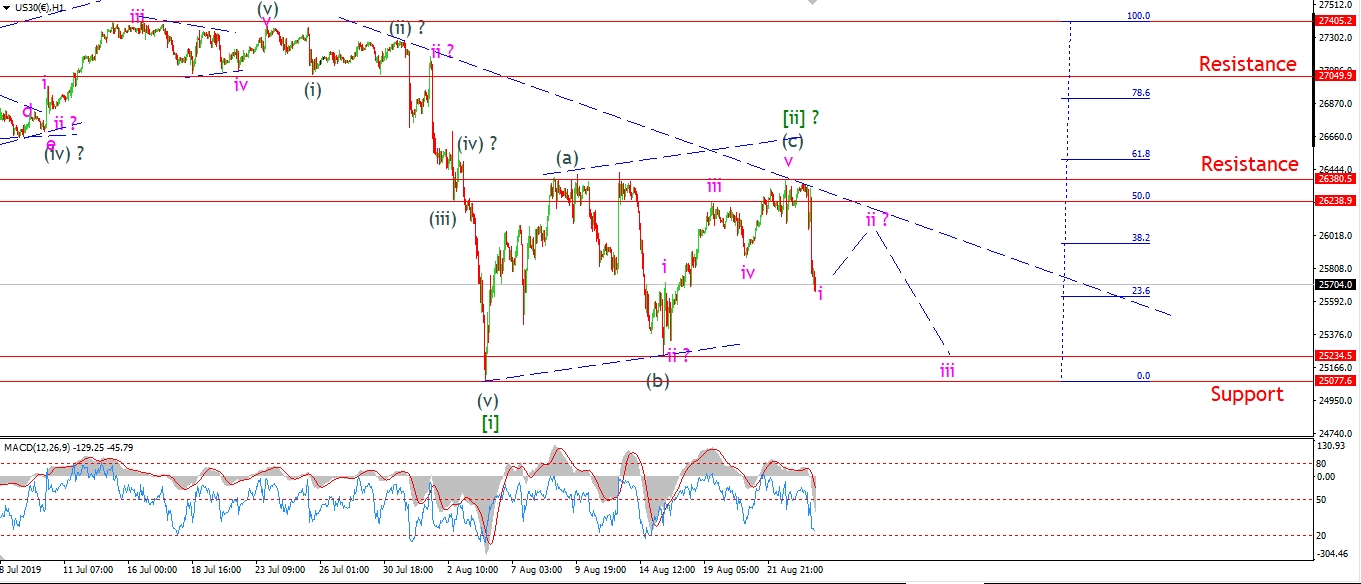 [/vc_column_text][/vc_column][vc_column width=”1/3″][vc_custom_heading text=”4 Hours” use_theme_fonts=”yes”][vc_column_text]
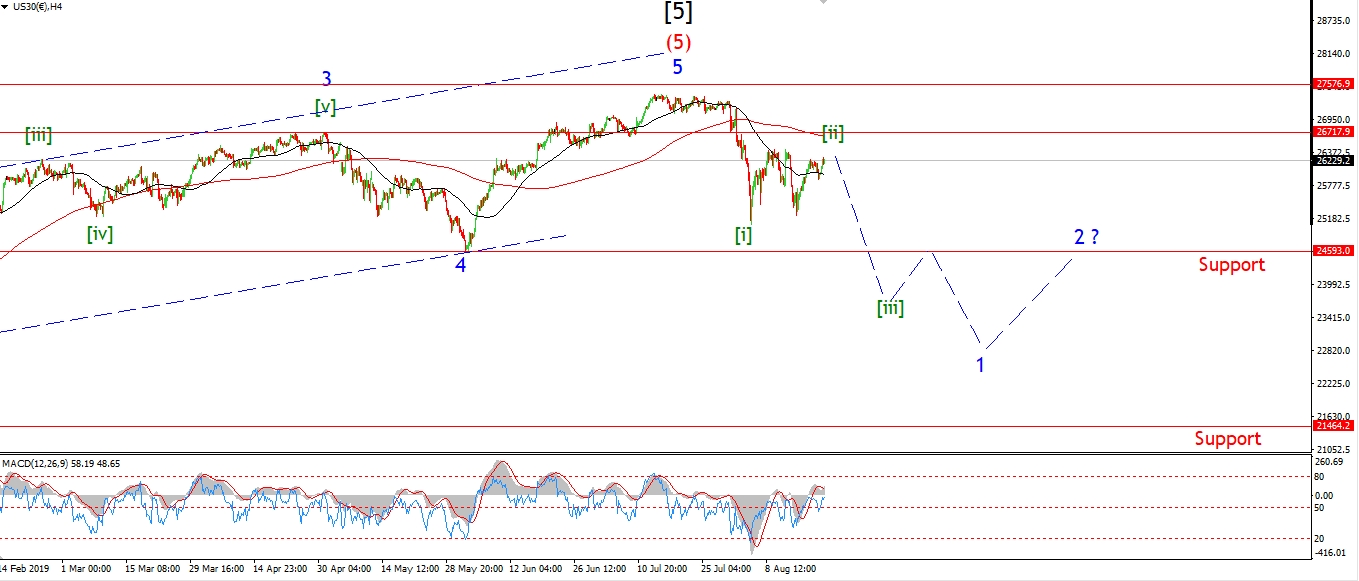 [/vc_column_text][vc_custom_heading text=”Daily” use_theme_fonts=”yes”][vc_column_text]
 [/vc_column_text][/vc_column][/vc_row]
[vc_row][vc_column][vc_column_text]
The DOW was again hit with a slap across the face today!
The market is down about 500 points as I write,
and this action is definitely a move in the right direction
if we are expecting a large third wave to begin.
I have labelled todays decline as wave ‘i’ of (i) of [iii],
So the market should continue lower for about a week to complete wave (i) of [iii].
And then we will see another recovery to a lower high in wave (ii).
This wave count should provide a choppy few weeks ahead for the DOW.
Monday;
I cant confirm that wave [iii] down has begun until we get a break of the wave [i] low.
But if the short term count is correct,
that should happen next week in wave (i).
Watch for wave ‘i’ to complete Monday and wave ‘ii’ to hold below the declining trendline again.
[/vc_column_text][/vc_column][/vc_row]
[vc_row][vc_column][vc_separator border_width=”5″][/vc_column][/vc_row][vc_row][vc_column][vc_column_text]
GOLD
[/vc_column_text][/vc_column][/vc_row][vc_row][vc_column][vc_separator border_width=”5″][/vc_column][/vc_row][vc_row][vc_column width=”2/3″][vc_custom_heading text=”1 hr” use_theme_fonts=”yes”][vc_column_text]
 [/vc_column_text][/vc_column][vc_column width=”1/3″][vc_custom_heading text=”4 Hours” use_theme_fonts=”yes”][vc_column_text]
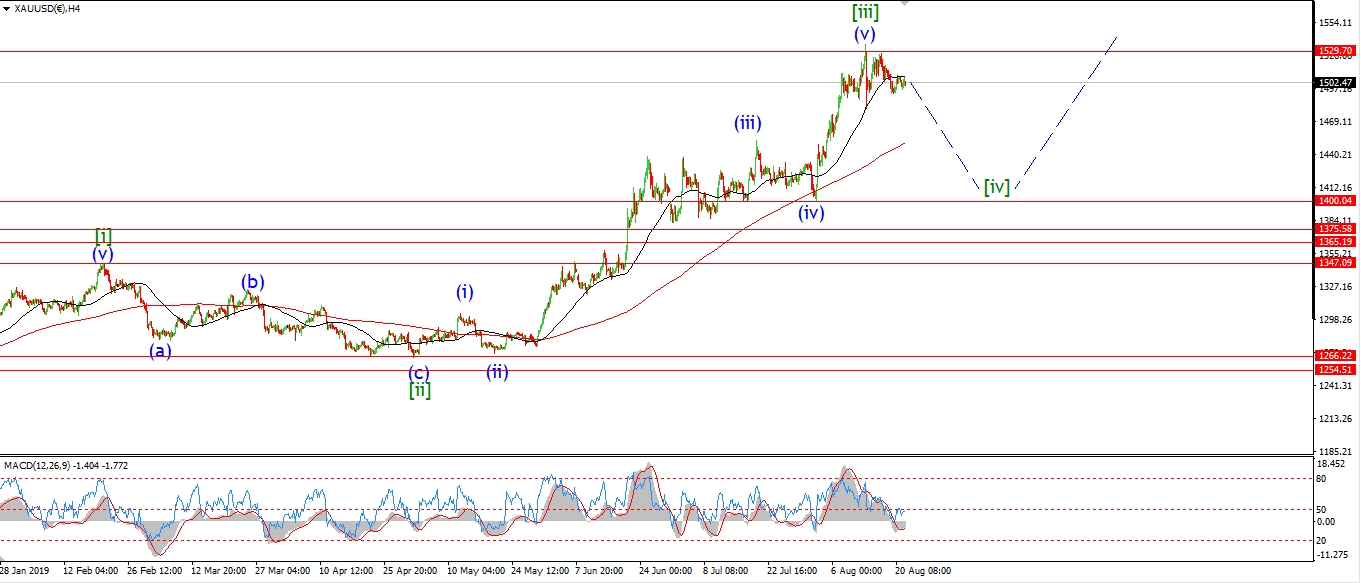 [/vc_column_text][vc_custom_heading text=”Daily” use_theme_fonts=”yes”][vc_column_text]
 [/vc_column_text][/vc_column][/vc_row]
[vc_row][vc_column][vc_column_text]
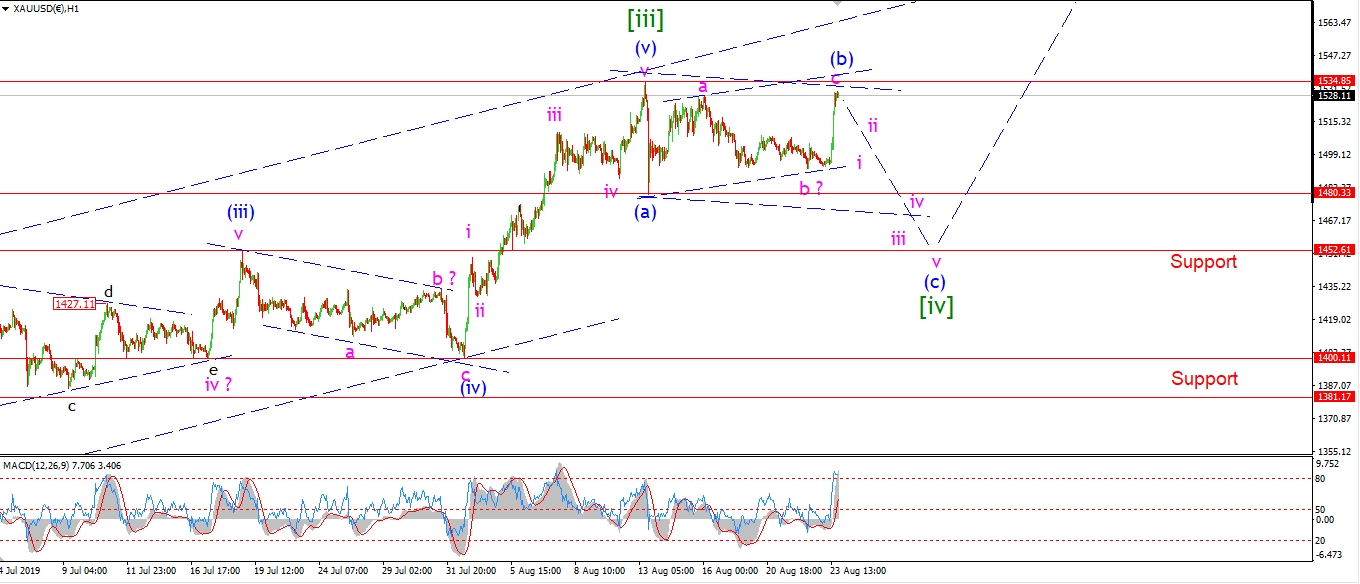
Gold reversed tack and broke higher out of the triangle idea for wave (b) today with a sharp move back towards the recent high at 1534.
I still view this action as wave (b) within a larger wave [iv].
Wave (b) has traced out a three wave correction higher.
And now wave (c) should push lower again next week to complete another three wave pattern in wave [iv].
So I don’t think we are out of the woods for Gold just yet.
Monday;
Watch for wave (b) to top out and return lower again in five waves to compelte wave (c) next week.
[/vc_column_text][/vc_column][/vc_row]
[vc_row][vc_column][vc_separator border_width=”5″][/vc_column][/vc_row][vc_row][vc_column][vc_column_text]
U.S CRUDE OIL
[/vc_column_text][/vc_column][/vc_row][vc_row][vc_column][vc_separator border_width=”5″][/vc_column][/vc_row][vc_row][vc_column width=”2/3″][vc_custom_heading text=”1 hr” use_theme_fonts=”yes”][vc_column_text]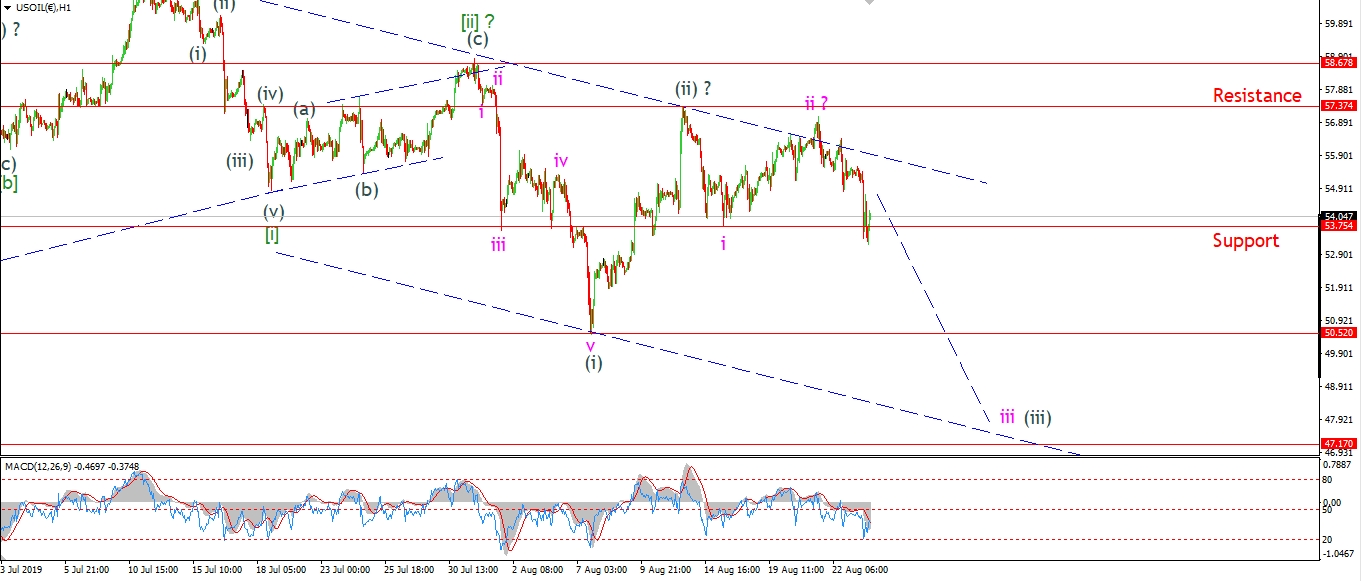 [/vc_column_text][/vc_column][vc_column width=”1/3″][vc_custom_heading text=”4 Hours” use_theme_fonts=”yes”][vc_column_text]
 [/vc_column_text][vc_custom_heading text=”Daily” use_theme_fonts=”yes”][vc_column_text]
 [/vc_column_text][/vc_column][/vc_row]
[vc_row][vc_column][vc_column_text]
Crude sold off along with stocks again today,
proving that the two markets are locked in a bearish dance with each other!
And both are moving lower after completing a large second wave.
Wave [iii] down is what I am looking for in crude,
and it should carry the market significantly lower over the next month.
Monday;
Todays action has kept the downside bias in place.
So,
Watch for wave ‘iii’ of (iii) to continue lower next week.
we should push towards the 47.00 area,
this is where price will meet the lower trend channel line again.
[/vc_column_text][/vc_column][/vc_row]
[vc_row][vc_column][vc_separator border_width=”5″][/vc_column][/vc_row][vc_row][vc_column][vc_column_text]
US 10 yr Treasuries.
[/vc_column_text][/vc_column][/vc_row][vc_row][vc_column][vc_separator border_width=”5″][/vc_column][/vc_row][vc_row][vc_column width=”2/3″][vc_custom_heading text=”1 hr” use_theme_fonts=”yes”][vc_column_text]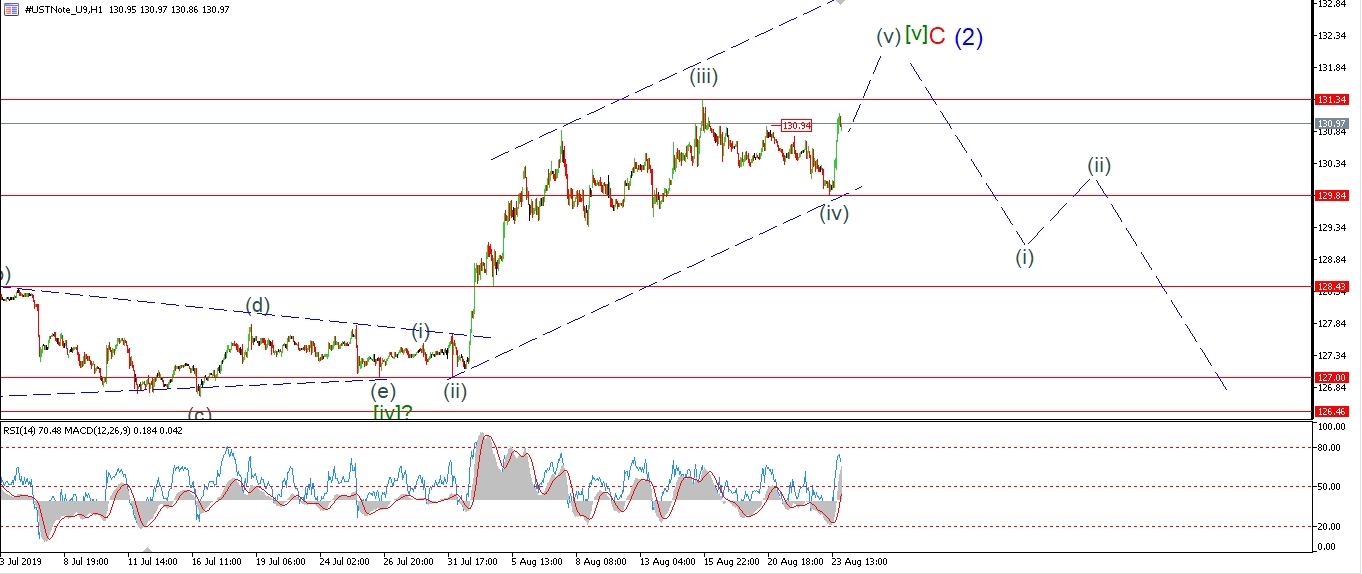 [/vc_column_text][/vc_column][vc_column width=”1/3″][vc_custom_heading text=”4 Hours” use_theme_fonts=”yes”][vc_column_text]
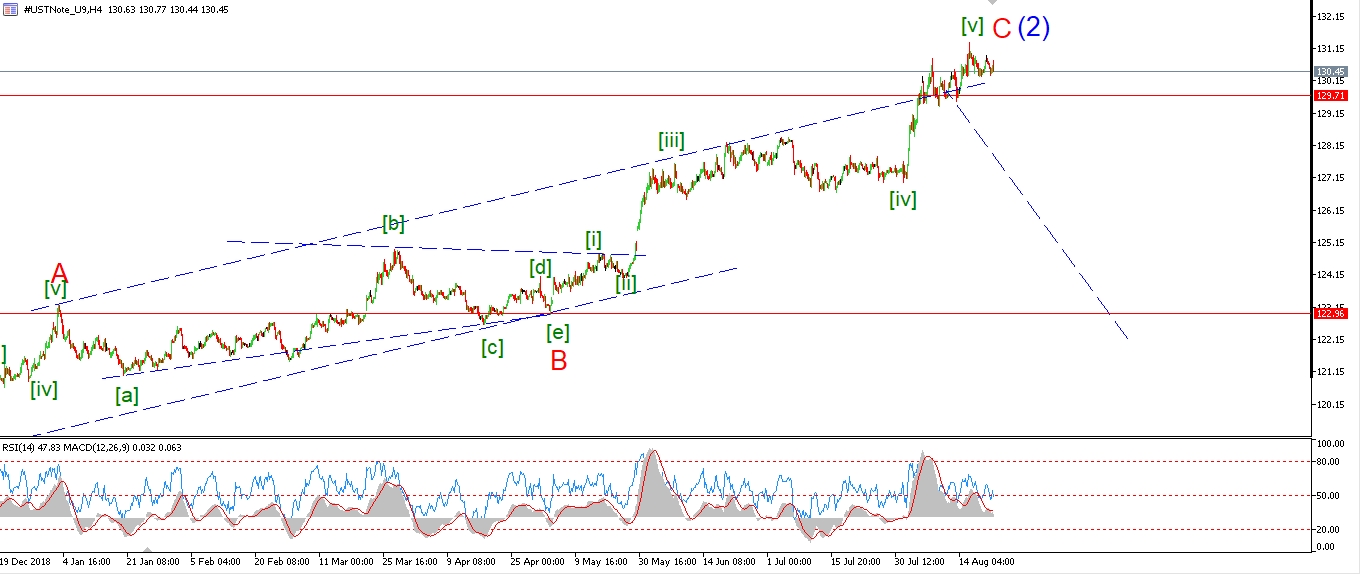 [/vc_column_text][vc_custom_heading text=”Daily” use_theme_fonts=”yes”][vc_column_text]
 [/vc_column_text][/vc_column][/vc_row]
[vc_row][vc_column][vc_column_text]
Todays rally in bonds has halted the bearish count in its tracks.
We did not break to a new high,
but the rally broke above the interim high at 130.94,
and this action confirms the previous decline as a three wave correction.
Wave [v] is now likely to continue higher for most of next week
until the eventual top arrives somewhere around 133.00.
Monday;
I am convinced that the bond market will top out sooner rather than later.
Eventually bonds and stocks will fall together.
And that will really kick off the next global credit crunch!
Wave [v] should find a new high next week.
[/vc_column_text][/vc_column][/vc_row]
[vc_row][vc_column][vc_separator border_width=”5″][/vc_column][/vc_row][vc_row][vc_column][vc_column_text]
SILVER
[/vc_column_text][/vc_column][/vc_row][vc_row][vc_column][vc_separator border_width=”5″][/vc_column][/vc_row][vc_row][vc_column width=”2/3″][vc_custom_heading text=”1 hr” use_theme_fonts=”yes”][vc_column_text]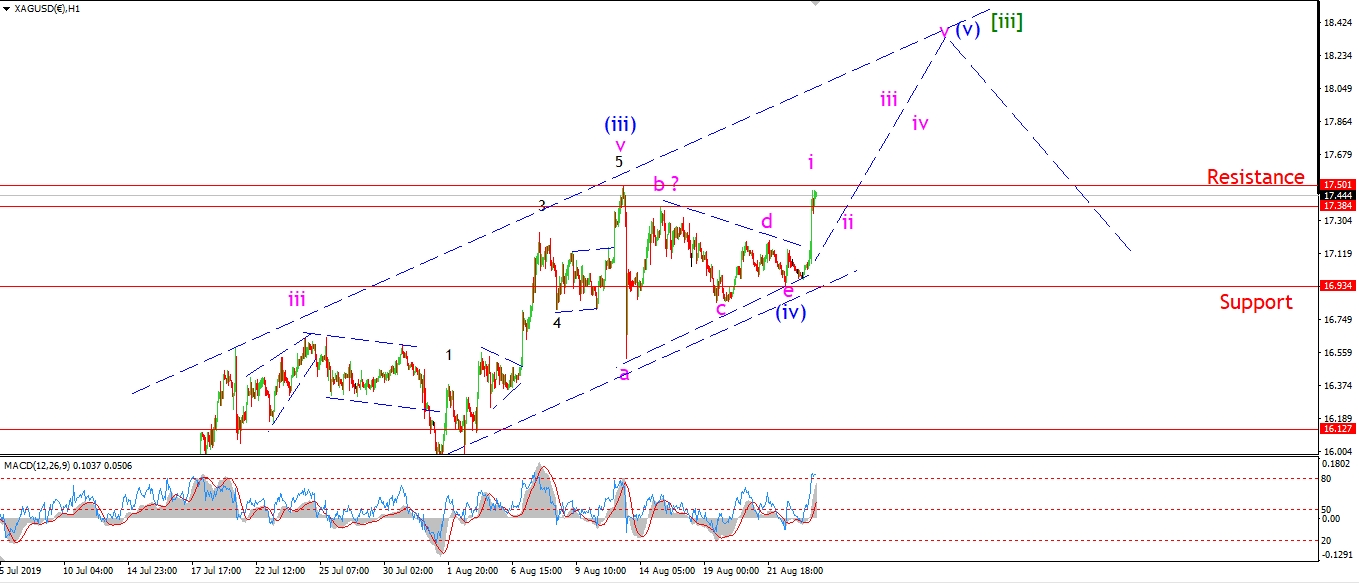 [/vc_column_text][/vc_column][vc_column width=”1/3″][vc_custom_heading text=”4 Hours” use_theme_fonts=”yes”][vc_column_text]
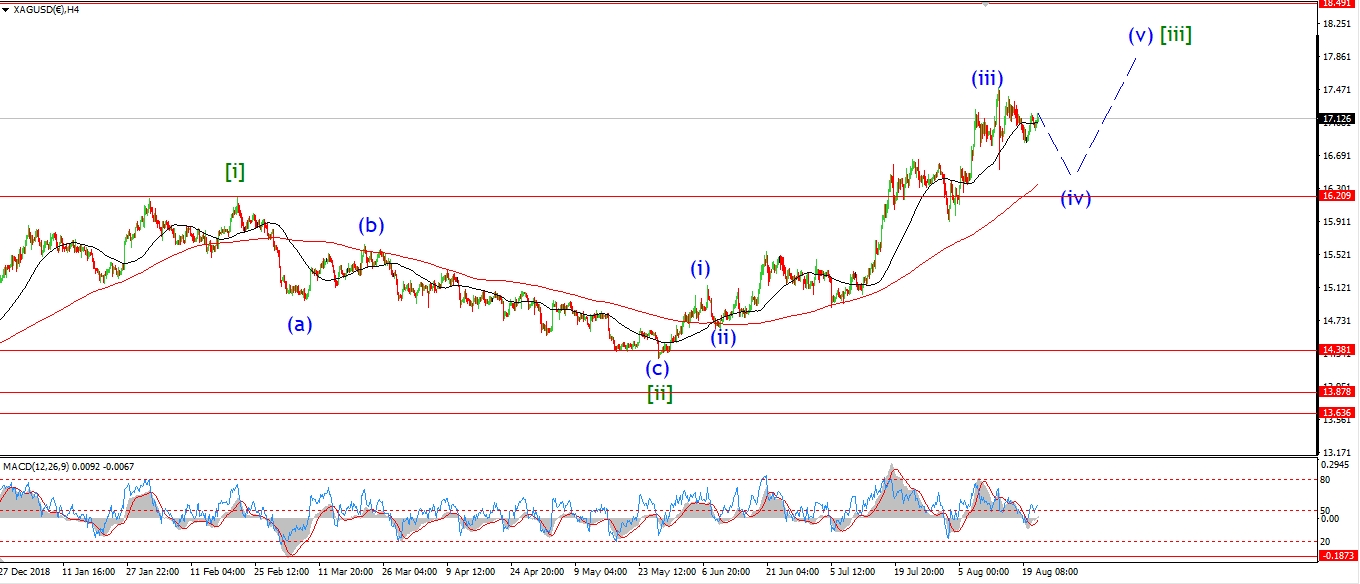 [/vc_column_text][vc_custom_heading text=”Daily” use_theme_fonts=”yes”][vc_column_text]
 [/vc_column_text][/vc_column][/vc_row]
[vc_row][vc_column][vc_column_text]
The rally came also in silver today.
I have given further consideration to the idea that wave (iv) blue is now complete as a triangle.
rather than the previous combination wave shown last night.
This is shown on the short term chart.
The rally today can be viewed as wave ‘i’ of (v) of [iii],
so if the rally continues next week,
there is a good chance that we will hit above 18.00 in wave (v).
And then again we can expect a correction to begin in wave [iv] green.
Tomorrow;
Watch for wave (v) to now hold above 16.93.
Wave ‘ii’ should correct above 16.93 and then wave ‘iii’ should rally again for the week.
[/vc_column_text][/vc_column][/vc_row]
[vc_row][vc_column][vc_separator border_width=”5″][/vc_column][/vc_row][vc_row][vc_column][vc_column_text]
S&P 500.
[/vc_column_text][/vc_column][/vc_row][vc_row][vc_column][vc_separator border_width=”5″][/vc_column][/vc_row][vc_row][vc_column width=”2/3″][vc_custom_heading text=”1 hr” use_theme_fonts=”yes”][vc_column_text]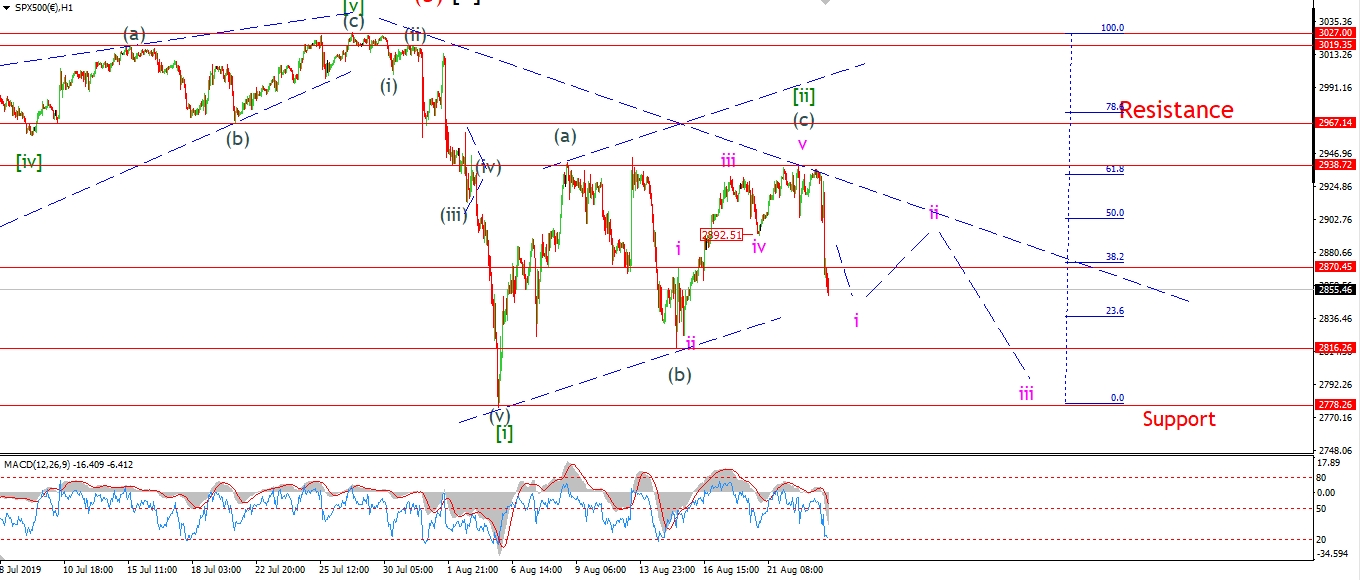 [/vc_column_text][/vc_column][vc_column width=”1/3″][vc_custom_heading text=”4 Hours” use_theme_fonts=”yes”][vc_column_text]
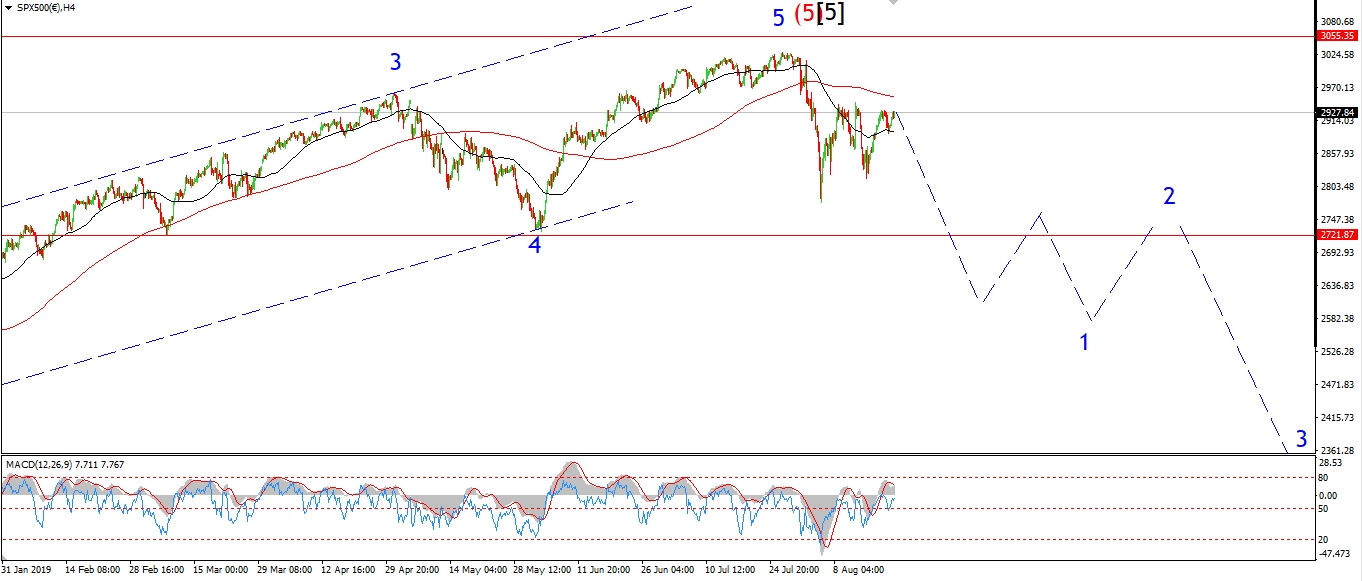 [/vc_column_text][vc_custom_heading text=”Daily” use_theme_fonts=”yes”][vc_column_text]
 [/vc_column_text][/vc_column][/vc_row]
[vc_row][vc_column][vc_column_text]
The S&P moved sharply lower today off the wave [ii] high,
which really does raise the probability of wave [iii] now underway.
especially given the impulsive nature of the decline.
The price is at the lows of the session now as I write,
after taking out the previous wave ‘i’ high at 2870.
This action rules out any further rally in wave (c) of [ii].
So we can concentrate on the downside from here.
If wave (i) of [iii] is now underway,
then next week is looking like a solid down week.
Wave (i) down should take out the low of wave [i].
If this happens,
then the bull market is in deep trouble!
Monday;
Watch for wave ‘i’ of (i) to compelte and wave ‘ii’ to form a corrective lower high again at about 2900.
[/vc_column_text][/vc_column][/vc_row]
[vc_row][vc_column][vc_separator border_width=”5″][/vc_column][/vc_row]