
[vc_row][vc_column][vc_separator border_width=”5″][/vc_column][/vc_row]
[vc_row][vc_column][vc_column_text]
Good evening to one and all.
Back to another week of action.
And it started with a bang for USDJPY overnight!
Lets get into that immediately.
[/vc_column_text][/vc_column][/vc_row]
[vc_row][vc_column][vc_separator border_width=”5″][/vc_column][/vc_row]
[vc_row][vc_column][vc_column_text]
EURUSD
[/vc_column_text][/vc_column][/vc_row]
[vc_row][vc_column][vc_separator border_width=”5″][/vc_column][/vc_row][vc_row][vc_column width=”2/3″][vc_custom_heading text=”1 hr” use_theme_fonts=”yes”][vc_column_text]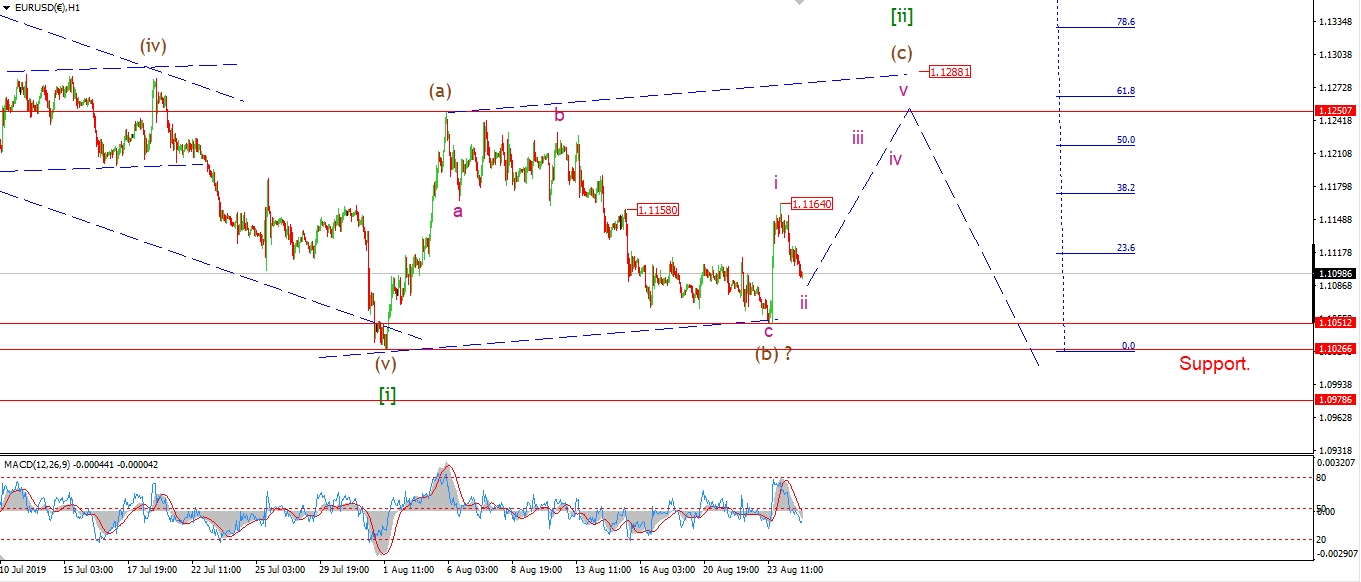 [/vc_column_text][/vc_column][vc_column width=”1/3″][vc_custom_heading text=”4 Hours” use_theme_fonts=”yes”][vc_column_text]
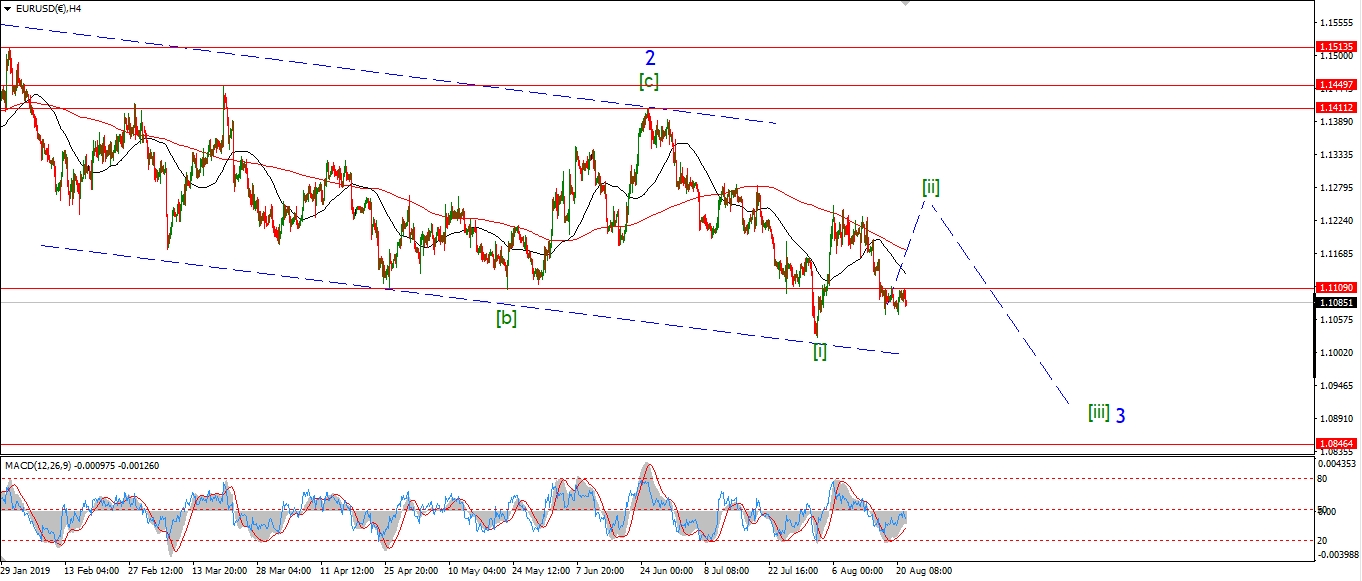 [/vc_column_text][vc_custom_heading text=”Daily” use_theme_fonts=”yes”][vc_column_text]
 [/vc_column_text][/vc_column][/vc_row]
[vc_row][vc_column][vc_column_text]
EURUSD fell off Fridays high in five waves so far.
I have labelled this decline as part of wave ‘ii’ pink,
although its hard to know what form wave ‘ii’ will take right now.
If we see a sideways pattern tomorrow with a slight upside bias,
that action will signal wave ‘ii’ is creating a larger three wave pattern.
And we will have to wait until later in the week for wave ‘iii’ to carry us towards the target at 1.1250.
Tomorrow;
Lets see how wave ‘ii’ develops,
Wave ‘ii’ must complete above 1.1051 on the lower end.
A rally above 1.1164 will signal wave ‘iii’ has begun.
[/vc_column_text][/vc_column][/vc_row]
[vc_row][vc_column][vc_separator border_width=”5″][/vc_column][/vc_row][vc_row][vc_column][vc_column_text]
GBPUSD
[/vc_column_text][/vc_column][/vc_row][vc_row][vc_column][vc_separator border_width=”5″][/vc_column][/vc_row][vc_row][vc_column width=”2/3″][vc_custom_heading text=”1 hr” use_theme_fonts=”yes”][vc_column_text]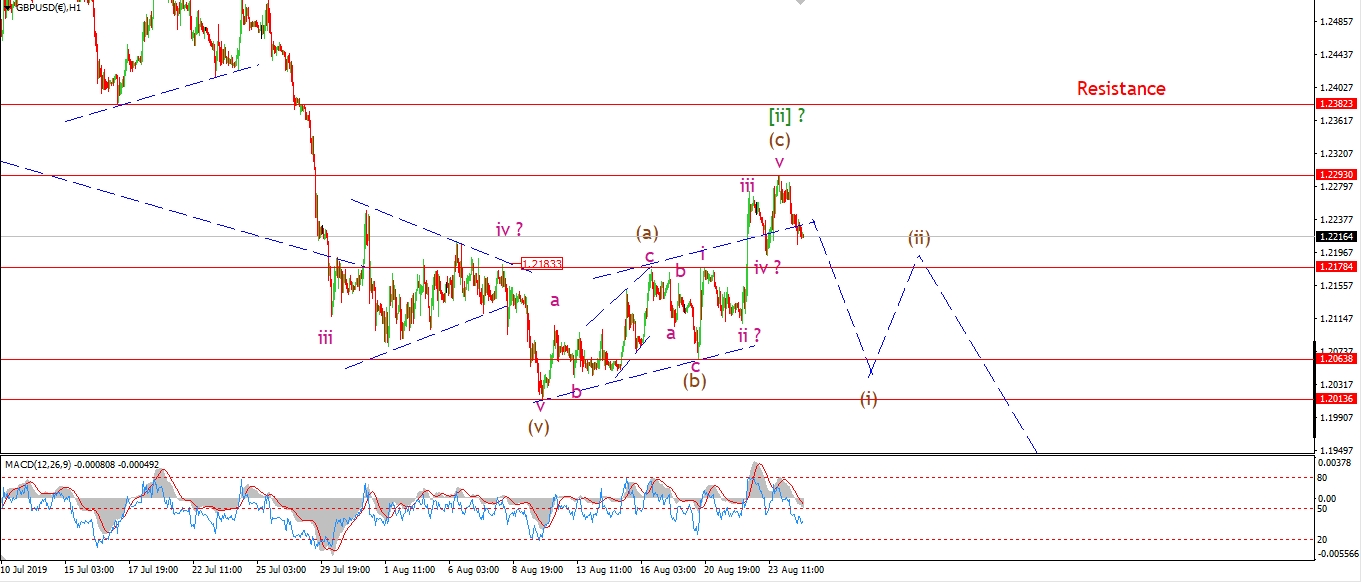 [/vc_column_text][/vc_column][vc_column width=”1/3″][vc_custom_heading text=”4 Hours” use_theme_fonts=”yes”][vc_column_text]
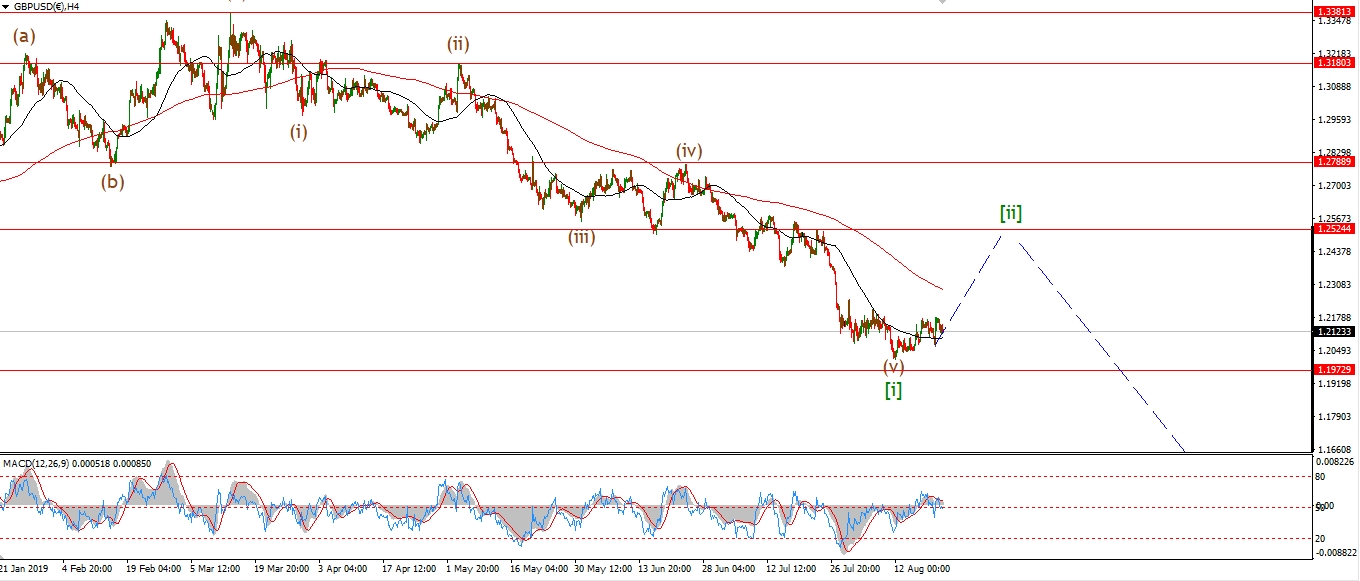 [/vc_column_text][vc_custom_heading text=”Daily” use_theme_fonts=”yes”][vc_column_text]
 [/vc_column_text][/vc_column][/vc_row]
[vc_row][vc_column][vc_column_text]
GBPUSD is declining off the high created on Friday,
and this is likely a signal that wave (c) and wave [ii] have completed at that high.
The top of wave (c) lies at 1.2293,
so this level is now very important in terms of a possible wave [iii] down now developing.
If we see a continuing decline tomorrow,
and a break of 1.2178 at wave ‘i’ pink,
that action will favor the bearish idea.
Tomorrow;
watch for wave (i) down to continue lower this week.
watch initial support at 1.2178.
[/vc_column_text][/vc_column][/vc_row]
[vc_row][vc_column][vc_separator border_width=”5″][/vc_column][/vc_row][vc_row][vc_column][vc_column_text]
USDJPY
[/vc_column_text][/vc_column][/vc_row][vc_row][vc_column][vc_separator border_width=”5″][/vc_column][/vc_row][vc_row][vc_column width=”2/3″][vc_custom_heading text=”1 hr” use_theme_fonts=”yes”][vc_column_text]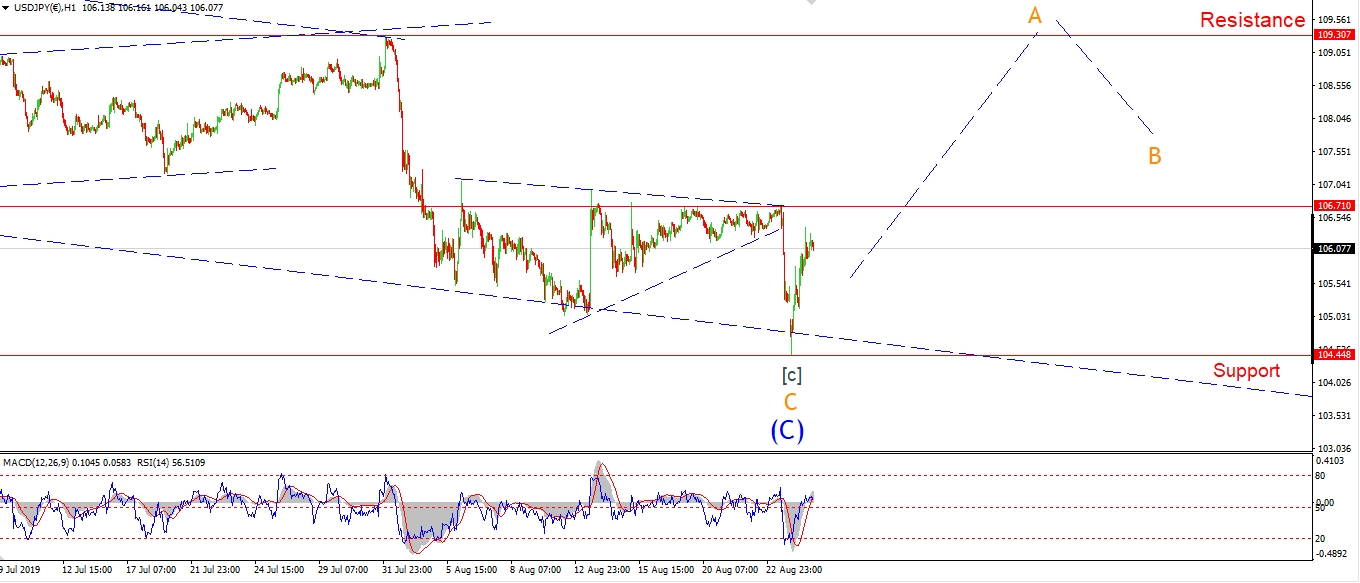 [/vc_column_text][/vc_column][vc_column width=”1/3″][vc_custom_heading text=”4 Hours” use_theme_fonts=”yes”][vc_column_text]
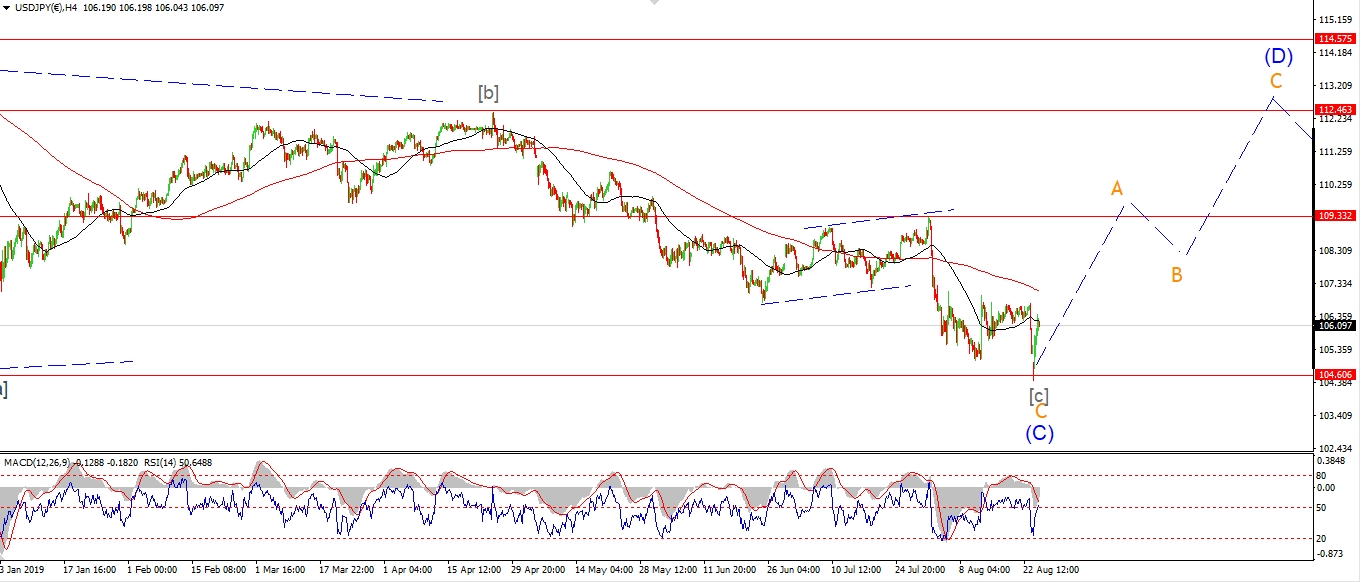 [/vc_column_text][vc_custom_heading text=”Daily” use_theme_fonts=”yes”][vc_column_text]
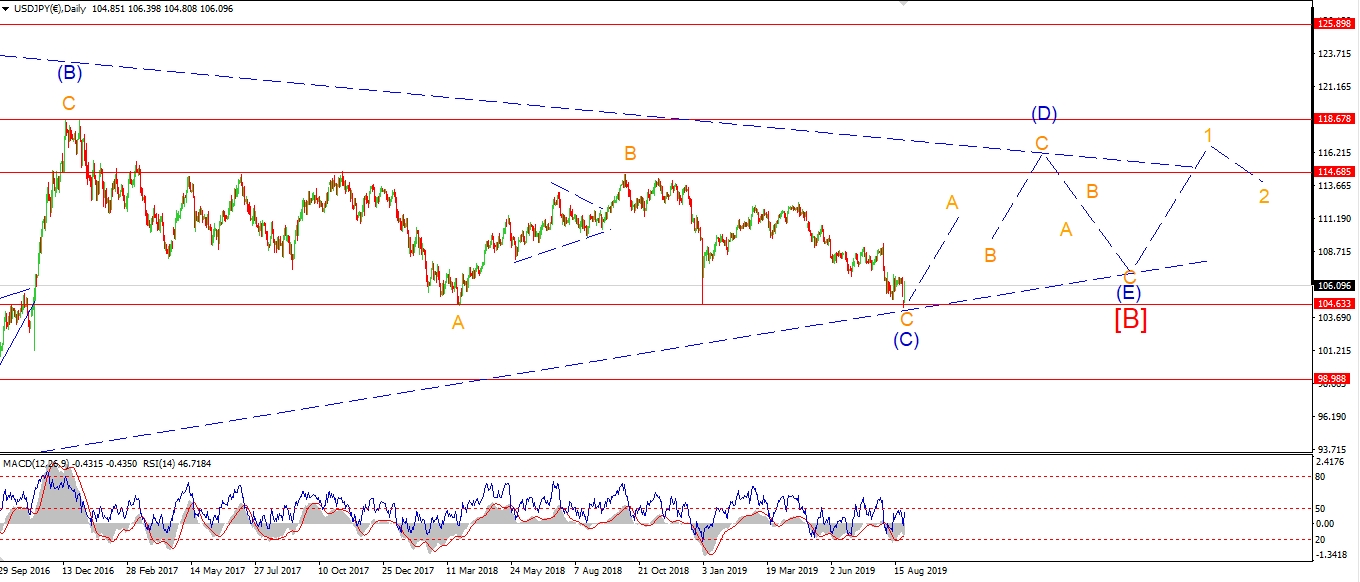 [/vc_column_text][/vc_column][/vc_row]
[vc_row][vc_column][vc_column_text]
USDJPY did finally rally today,but only after a spike lower that broke support at 104.75,
A with that decline,
I have been forced to switch to the long term alternate count.
So tonight I will start on the daily chart.
The previous extreme low last January was labelled the final low of that long drawn pout triangle wave [B].
Todays action has ruled out that count,
and now the triangle looks like it will continue in force for another 6 months or so.
USDJPY is still expected to rally from here,
but now this rally will be in three waves
and should complete below 118.67 at the wave (B) high.
And then we will expect the final decline in wave (E) to complete wave [B] as shown.
The 4hr chart;
Wave (D) should now be underway off the recent lows.
A break above 109.33 will confirm that wave count.
Tomorrow;
Wave A of (D) should continue higher over the next few weeks.
But only a break of 109.30 will confirm that the low is in for wave (C).
Lets see how the new count develops this week.
[/vc_column_text][/vc_column][/vc_row]
[vc_row][vc_column][vc_separator border_width=”5″][/vc_column][/vc_row][vc_row][vc_column][vc_column_text]
DOW JONES INDUSTRIALS
[/vc_column_text][/vc_column][/vc_row][vc_row][vc_column][vc_separator border_width=”5″][/vc_column][/vc_row][vc_row][vc_column width=”2/3″][vc_custom_heading text=”1 hr” use_theme_fonts=”yes”][vc_column_text]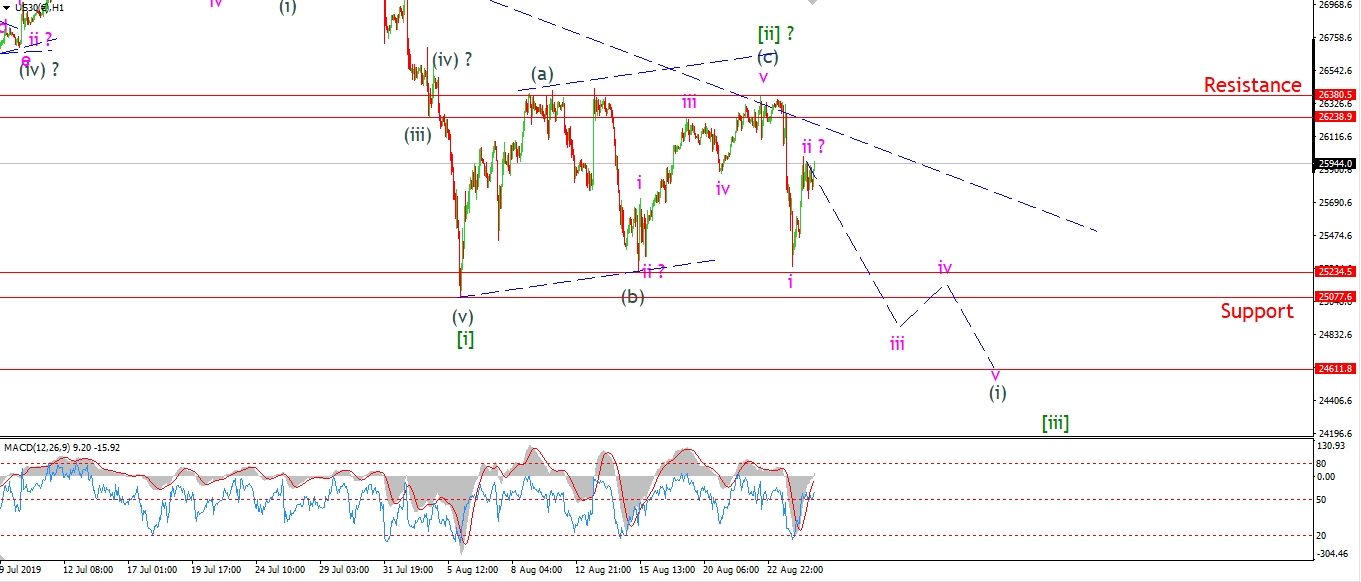 [/vc_column_text][/vc_column][vc_column width=”1/3″][vc_custom_heading text=”4 Hours” use_theme_fonts=”yes”][vc_column_text]
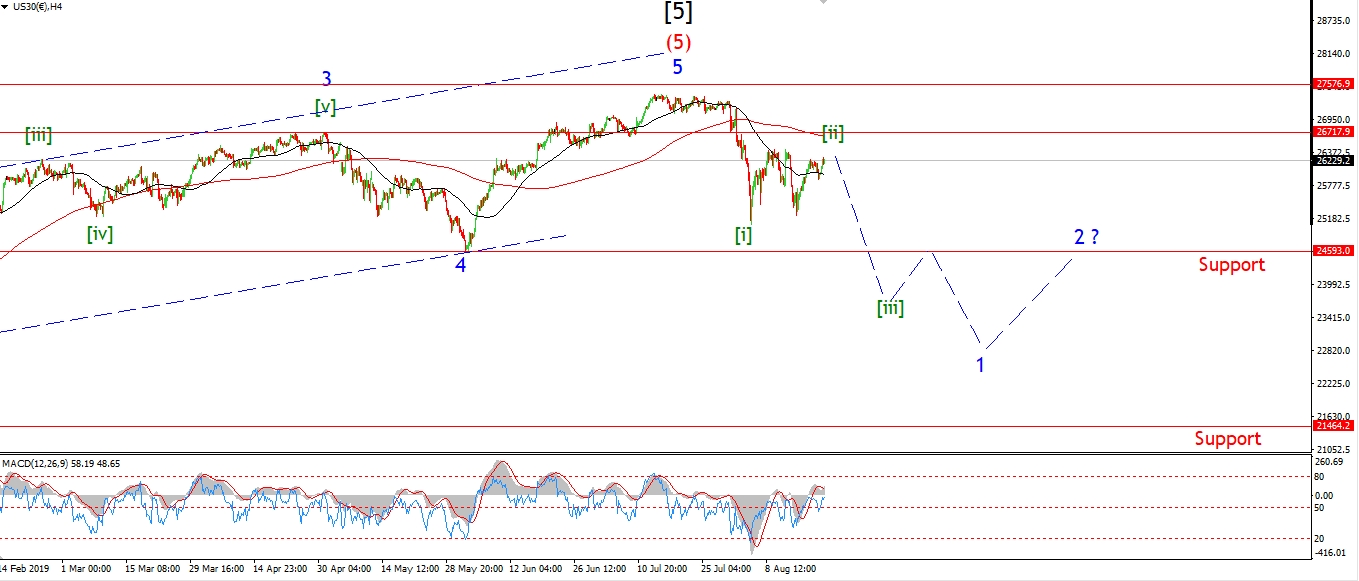 [/vc_column_text][vc_custom_heading text=”Daily” use_theme_fonts=”yes”][vc_column_text]
 [/vc_column_text][/vc_column][/vc_row]
[vc_row][vc_column][vc_column_text]
The market has bounced back today in what could be be wave ‘ii’ of (i) of [iii].
A I spoke about on the video this weekend,
wave ‘ii’ should now complete below the declining trend channel line,
which will keep the downside bias intact.
The price should then fall again by Wednesday,
to begin wave ‘iii’ of (i) as shown.
A break of support at wave [i] green will confirm wave (i) grey is underway,
but at the moment,
the bearish wave count is looking more and more likely.
And this weeks trade may well turn the tide completely to the downside as wave [iii] takes hold.
Tomorrow;
watch for wave ‘ii’ to complete below 26000 and turn lower again into wave ‘iii’.
[/vc_column_text][/vc_column][/vc_row]
[vc_row][vc_column][vc_separator border_width=”5″][/vc_column][/vc_row][vc_row][vc_column][vc_column_text]
GOLD
[/vc_column_text][/vc_column][/vc_row][vc_row][vc_column][vc_separator border_width=”5″][/vc_column][/vc_row][vc_row][vc_column width=”2/3″][vc_custom_heading text=”1 hr” use_theme_fonts=”yes”][vc_column_text]
 [/vc_column_text][/vc_column][vc_column width=”1/3″][vc_custom_heading text=”4 Hours” use_theme_fonts=”yes”][vc_column_text]
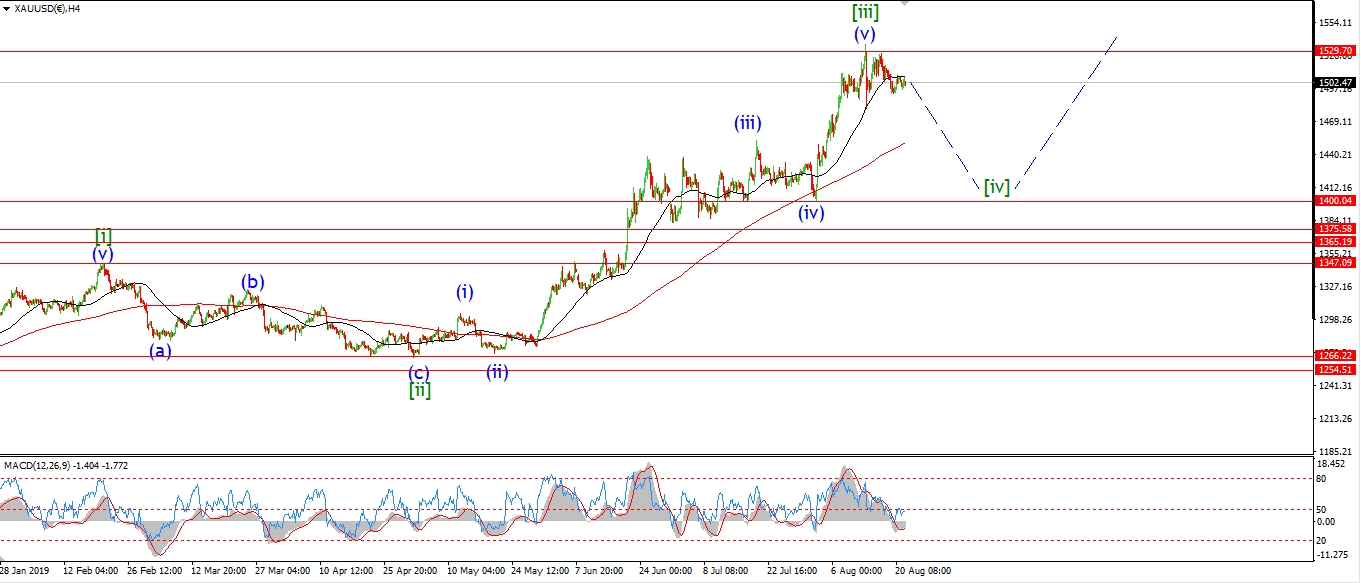 [/vc_column_text][vc_custom_heading text=”Daily” use_theme_fonts=”yes”][vc_column_text]
 [/vc_column_text][/vc_column][/vc_row]
[vc_row][vc_column][vc_column_text]
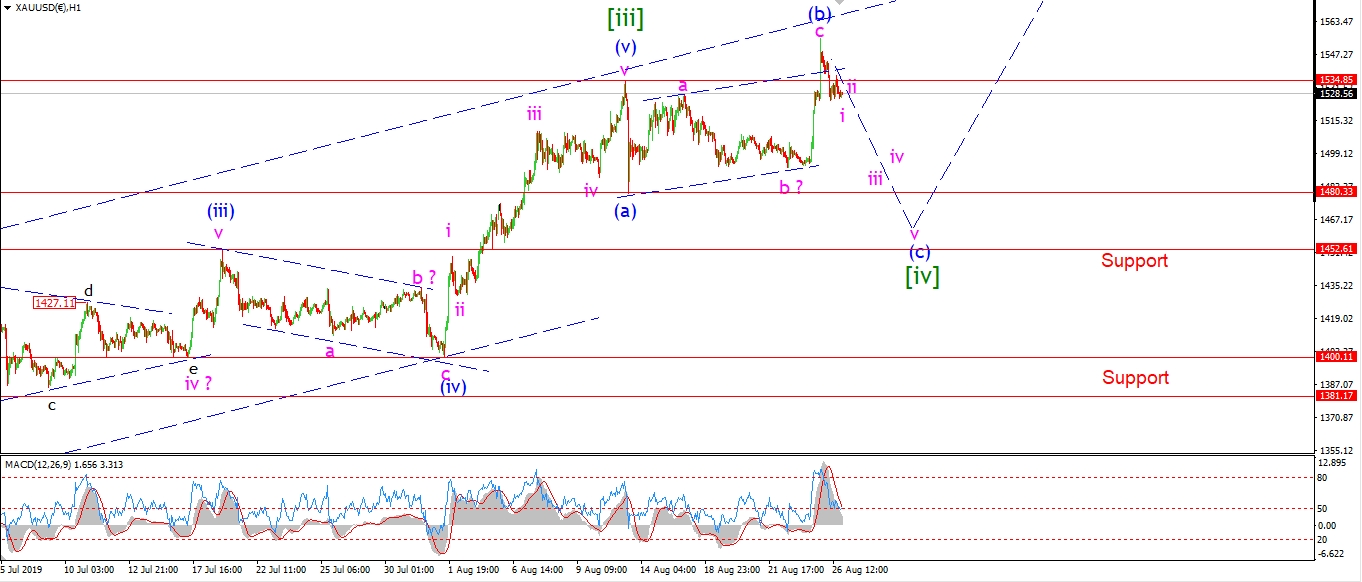
Gold rallied to a new high above 1534 overnight
which has changed the form of wave [iv] green.
Wave [iv] is now considered an expended flat correction.
And wave (c) of [iv] is now expected to carry the price back to about 1450 to complete the correction.
This action should all prove corrective in wave [iv],
and when the pattern completes,
Gold should then rally again in wave [v] of ‘3’.
Wave [v] has the potential to carry the price up to about 1650.
But that is for another day!
Tomorrow;
watch for wave (c) of [iv] to continue lower for the rest of this week.
Wave (c) should trace out a five wave decline and break 1480 at a minimum.
[/vc_column_text][/vc_column][/vc_row]
[vc_row][vc_column][vc_separator border_width=”5″][/vc_column][/vc_row][vc_row][vc_column][vc_column_text]
U.S CRUDE OIL
[/vc_column_text][/vc_column][/vc_row][vc_row][vc_column][vc_separator border_width=”5″][/vc_column][/vc_row][vc_row][vc_column width=”2/3″][vc_custom_heading text=”1 hr” use_theme_fonts=”yes”][vc_column_text]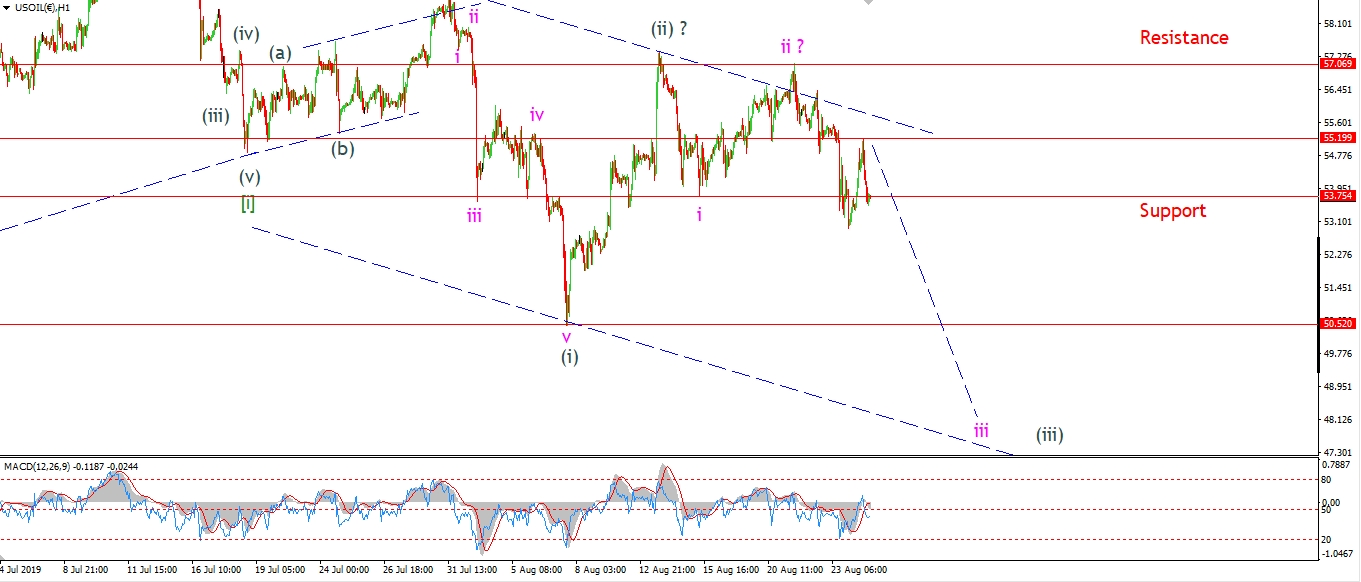 [/vc_column_text][/vc_column][vc_column width=”1/3″][vc_custom_heading text=”4 Hours” use_theme_fonts=”yes”][vc_column_text]
 [/vc_column_text][vc_custom_heading text=”Daily” use_theme_fonts=”yes”][vc_column_text]
 [/vc_column_text][/vc_column][/vc_row]
[vc_row][vc_column][vc_column_text]
Crude fell to break the wave ‘i’ low overnight,
and then then spiked higher in the early trade today,
only to give back the gains again this evening.
This action is looking corrective to the upside
and it may be the beginning of the sidle down into wave ‘iii’ of (iii).
As with the stock market,
cride is creating a series of corrective lower highs.
And it is only a matter of time before a third wave accelerates lower.
The alternate count shown on the 4hr chart
allows for one more test of the 60.00 level to complete wave ‘2’ blue.
If the price continues lower this week and breaks 50.74,
that will rule out the alternate count.
Tomorrow;
Watch for wave ‘iii’ to hold below 55.19.
[/vc_column_text][/vc_column][/vc_row]
[vc_row][vc_column][vc_separator border_width=”5″][/vc_column][/vc_row][vc_row][vc_column][vc_column_text]
US 10 yr Treasuries.
[/vc_column_text][/vc_column][/vc_row][vc_row][vc_column][vc_separator border_width=”5″][/vc_column][/vc_row][vc_row][vc_column width=”2/3″][vc_custom_heading text=”1 hr” use_theme_fonts=”yes”][vc_column_text]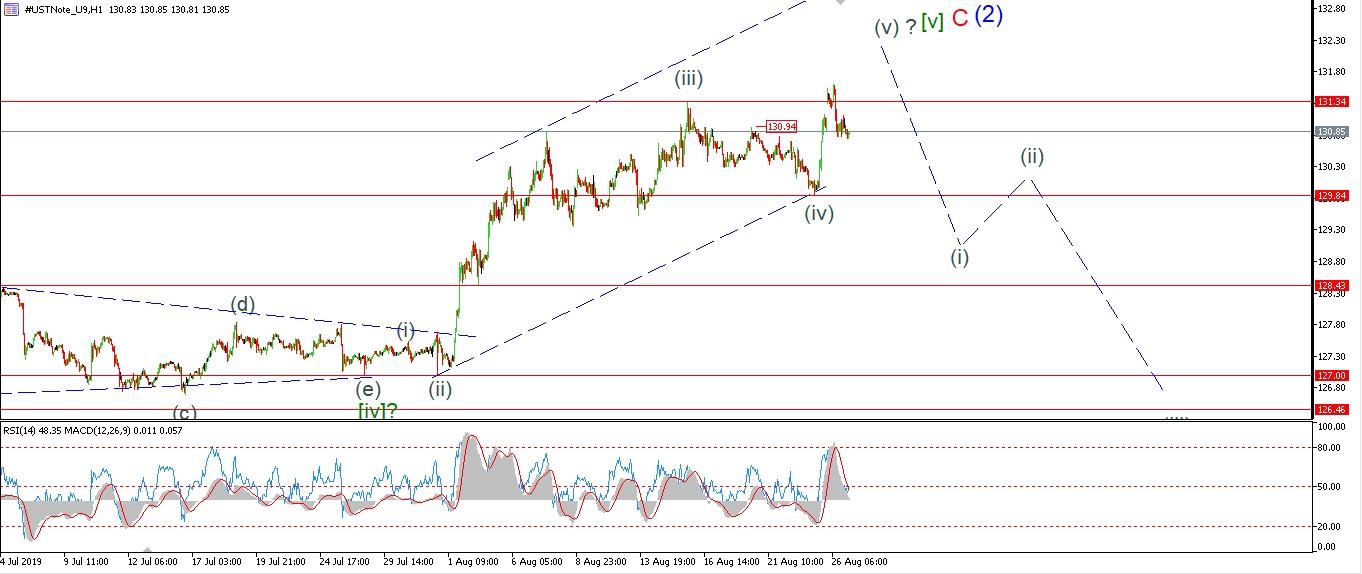 [/vc_column_text][/vc_column][vc_column width=”1/3″][vc_custom_heading text=”4 Hours” use_theme_fonts=”yes”][vc_column_text]
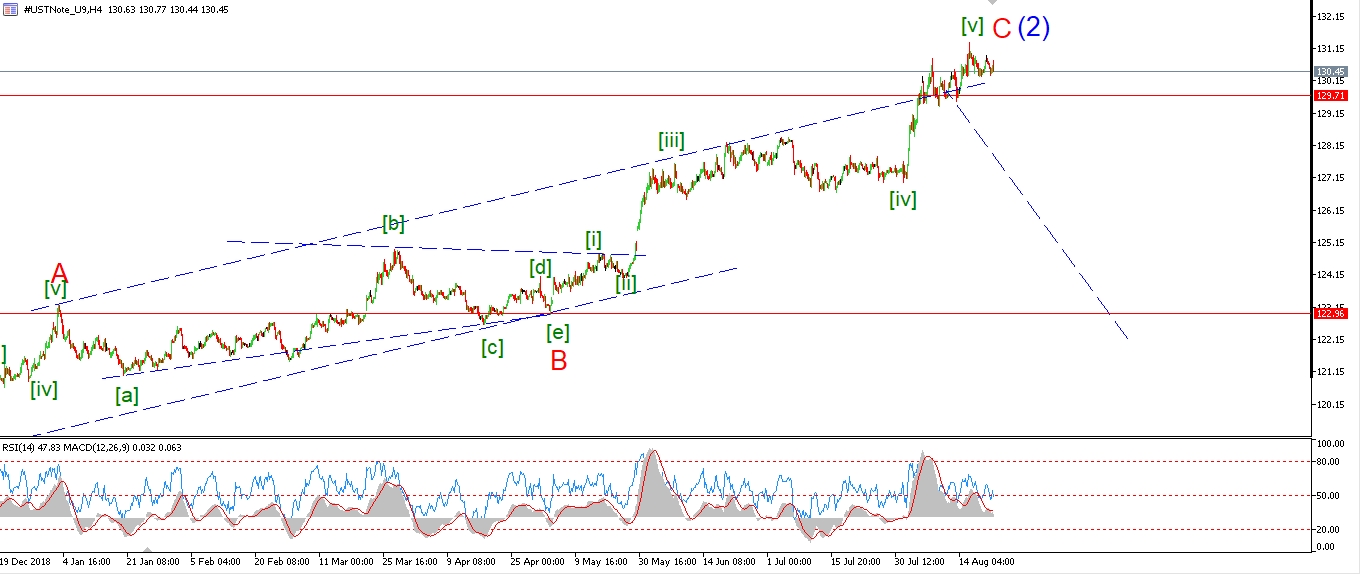 [/vc_column_text][vc_custom_heading text=”Daily” use_theme_fonts=”yes”][vc_column_text]
 [/vc_column_text][/vc_column][/vc_row]
[vc_row][vc_column][vc_column_text]
Bonds have turned lower today,
but I am not convinced that this is the beginning of wave (i) down yet.
Only a break of 129.80 will signal that the rally in wave [v] has completed.
For the moment,
I have labelled this decline as wave ‘ii’ of (v).
With a further rally expected this week to close out wave [v] finally.
Tomorrow;
Watch for wave ‘ii’ to complete above 129.84,
and wave ‘iii’ to rally again.
[/vc_column_text][/vc_column][/vc_row]
[vc_row][vc_column][vc_separator border_width=”5″][/vc_column][/vc_row][vc_row][vc_column][vc_column_text]
SILVER
[/vc_column_text][/vc_column][/vc_row][vc_row][vc_column][vc_separator border_width=”5″][/vc_column][/vc_row][vc_row][vc_column width=”2/3″][vc_custom_heading text=”1 hr” use_theme_fonts=”yes”][vc_column_text]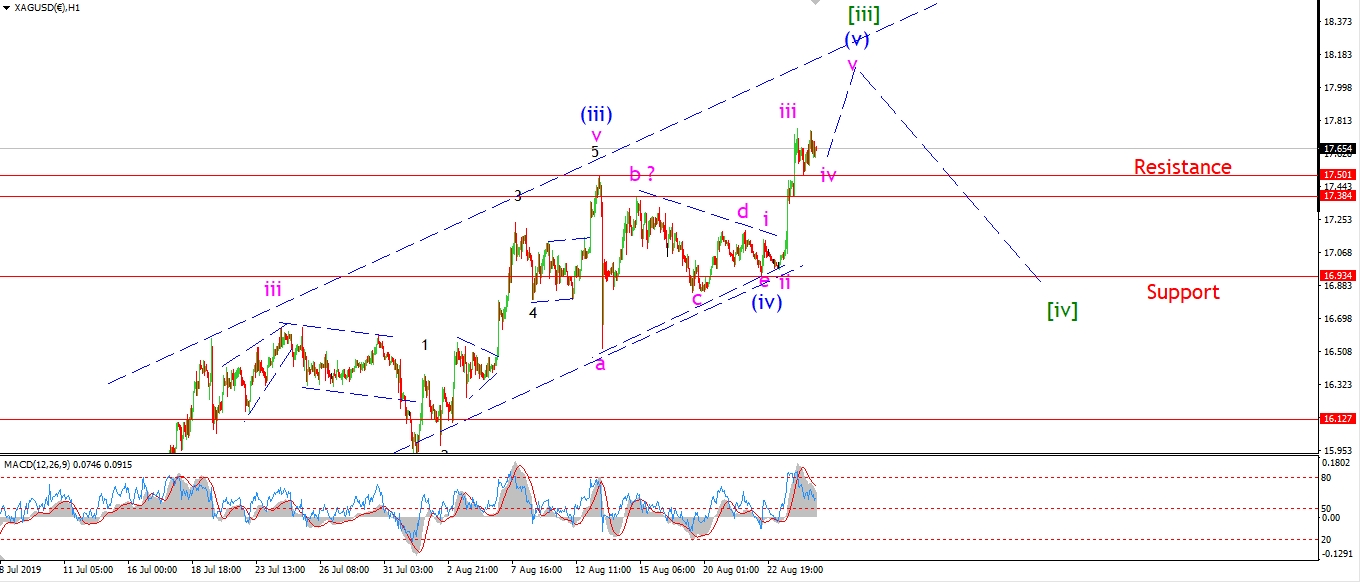 [/vc_column_text][/vc_column][vc_column width=”1/3″][vc_custom_heading text=”4 Hours” use_theme_fonts=”yes”][vc_column_text]
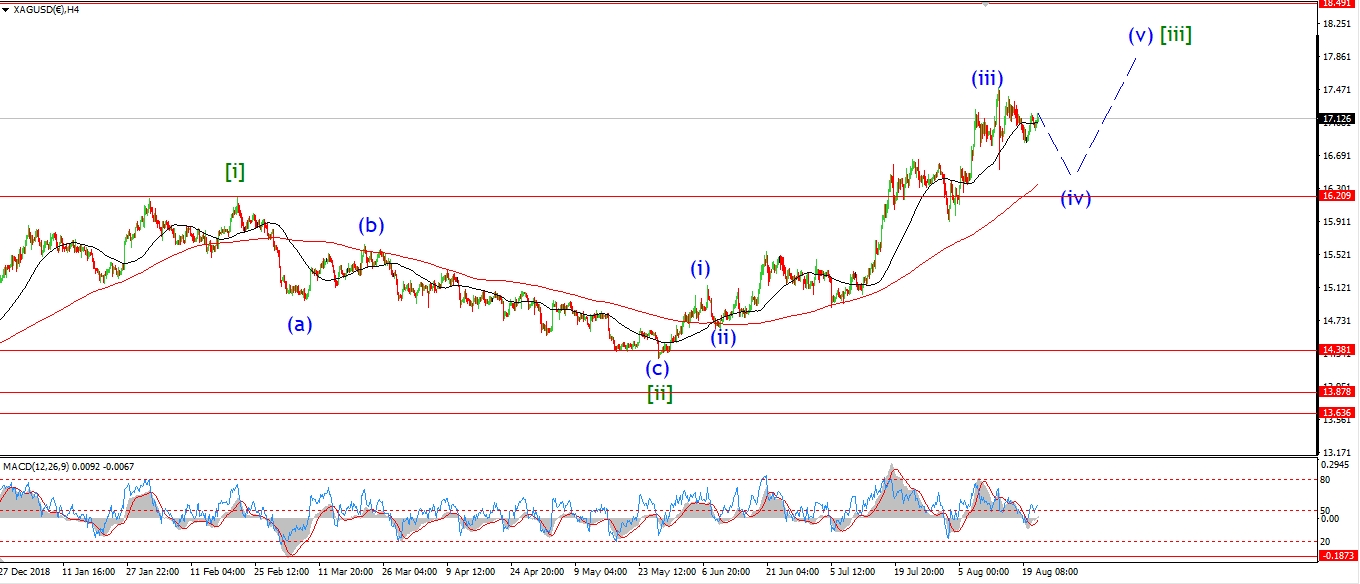 [/vc_column_text][vc_custom_heading text=”Daily” use_theme_fonts=”yes”][vc_column_text]
 [/vc_column_text][/vc_column][/vc_row]
[vc_row][vc_column][vc_column_text]
Todays sideways action in Silver favors a correction in wave ‘iv’ of (v) as shown on the short term chart.
The price range is contracting,
and the action has created two separate three wave moves so far.
If this count is correct,
wave ‘iv’ will continue sideways tomorrow,
and then wave ‘v’ of (v) will spike higher to complete the rally in wave [iii].
At that point I will expect to see a larger correction develop in wave [iv] green.
Tomorrow;
Watch for wave ‘iv’ to complete above 17.50.
Wave ‘v’ may even begin before the end of tomorrows session.
A break of 16.93 will signal that wave [iii] is complete and [iv] has already begun.
[/vc_column_text][/vc_column][/vc_row]
[vc_row][vc_column][vc_separator border_width=”5″][/vc_column][/vc_row][vc_row][vc_column][vc_column_text]
S&P 500.
[/vc_column_text][/vc_column][/vc_row][vc_row][vc_column][vc_separator border_width=”5″][/vc_column][/vc_row][vc_row][vc_column width=”2/3″][vc_custom_heading text=”1 hr” use_theme_fonts=”yes”][vc_column_text]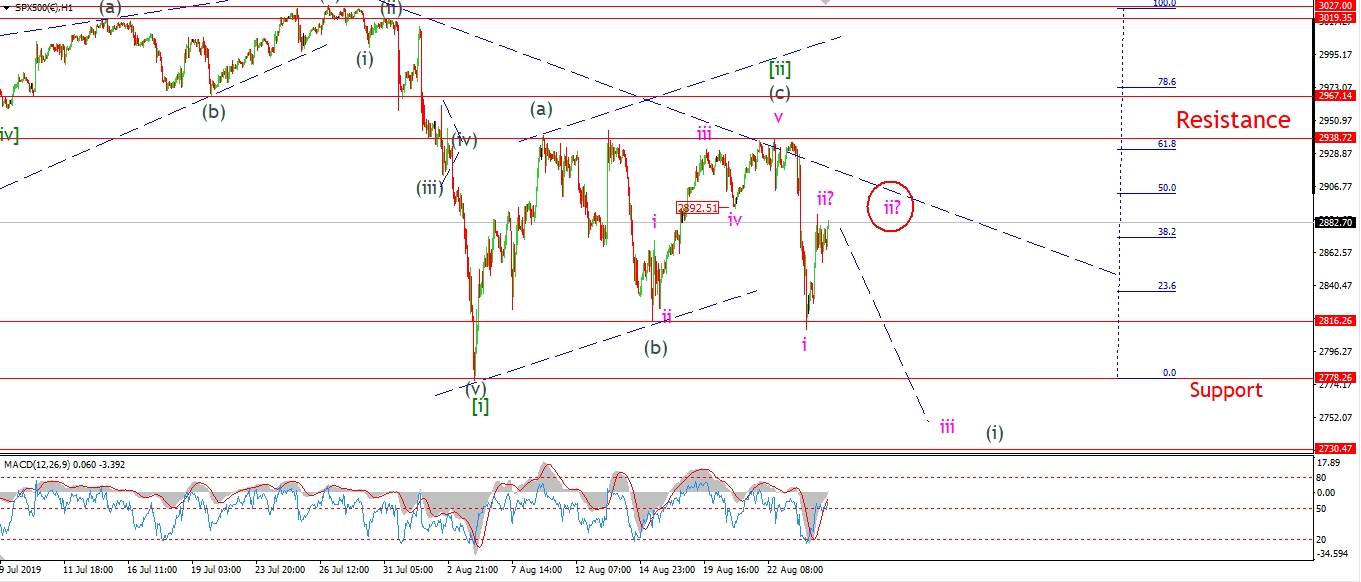 [/vc_column_text][/vc_column][vc_column width=”1/3″][vc_custom_heading text=”4 Hours” use_theme_fonts=”yes”][vc_column_text]
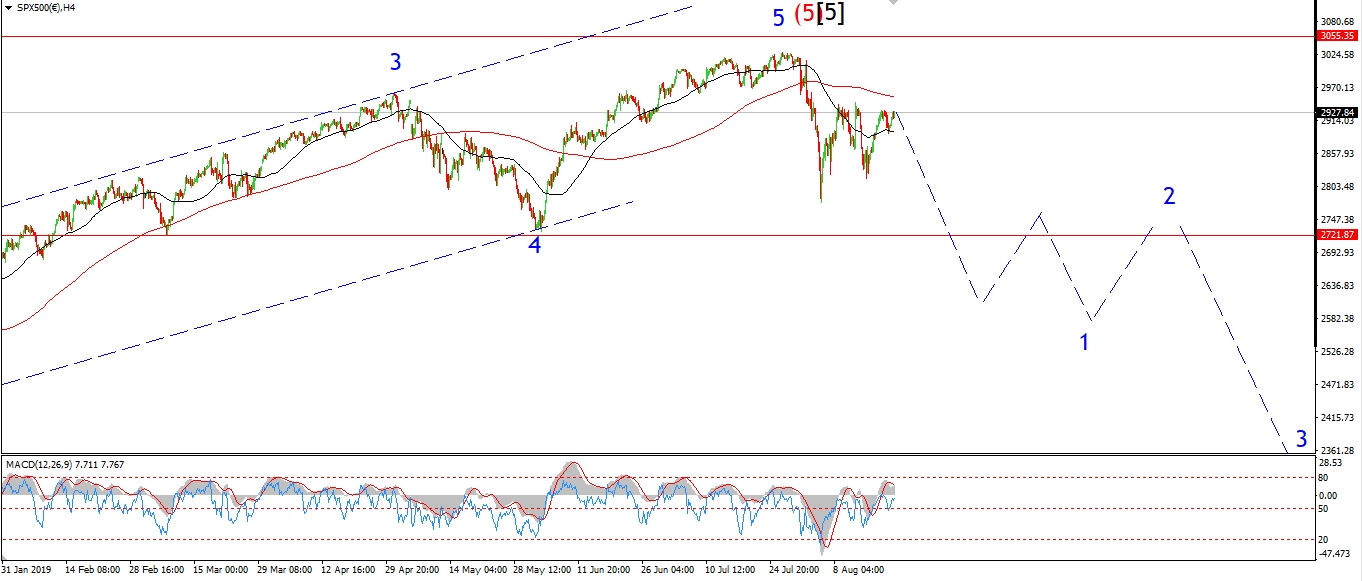 [/vc_column_text][vc_custom_heading text=”Daily” use_theme_fonts=”yes”][vc_column_text]
 [/vc_column_text][/vc_column][/vc_row]
[vc_row][vc_column][vc_column_text]
The S&P is higher again off Fridays selloff in wave ‘i’.
This rally is viewed as wave ‘ii’ of (i) so far.
It is hard to know if todays high has completed wave ‘ii’,
or if we see a larger wave ‘ii’ develop as a flat correction.
Tomorrows action should inform us better on that front.
However,
a sharp decline out of the open tomorrow will favor wave ‘iii’ down as shown.
Whatever form wave ‘ii’ takes,
I think we will see a sharp move lower again this week in wave ‘iii’.
Tomorrow;
Watch for wave ‘ii’ to complete soon.
Wave ‘iii’ down will be confirmed with a drop below 2800 again.
[/vc_column_text][/vc_column][/vc_row]
[vc_row][vc_column][vc_separator border_width=”5″][/vc_column][/vc_row]