
[vc_row][vc_column][vc_separator border_width=”5″][/vc_column][/vc_row]
[vc_row][vc_column][vc_column_text]
Good evening to one and all.
[/vc_column_text][/vc_column][/vc_row]
[vc_row][vc_column][vc_separator border_width=”5″][/vc_column][/vc_row]
[vc_row][vc_column][vc_column_text]
EURUSD
[/vc_column_text][/vc_column][/vc_row]
[vc_row][vc_column][vc_separator border_width=”5″][/vc_column][/vc_row][vc_row][vc_column width=”2/3″][vc_custom_heading text=”1 hr” use_theme_fonts=”yes”][vc_column_text]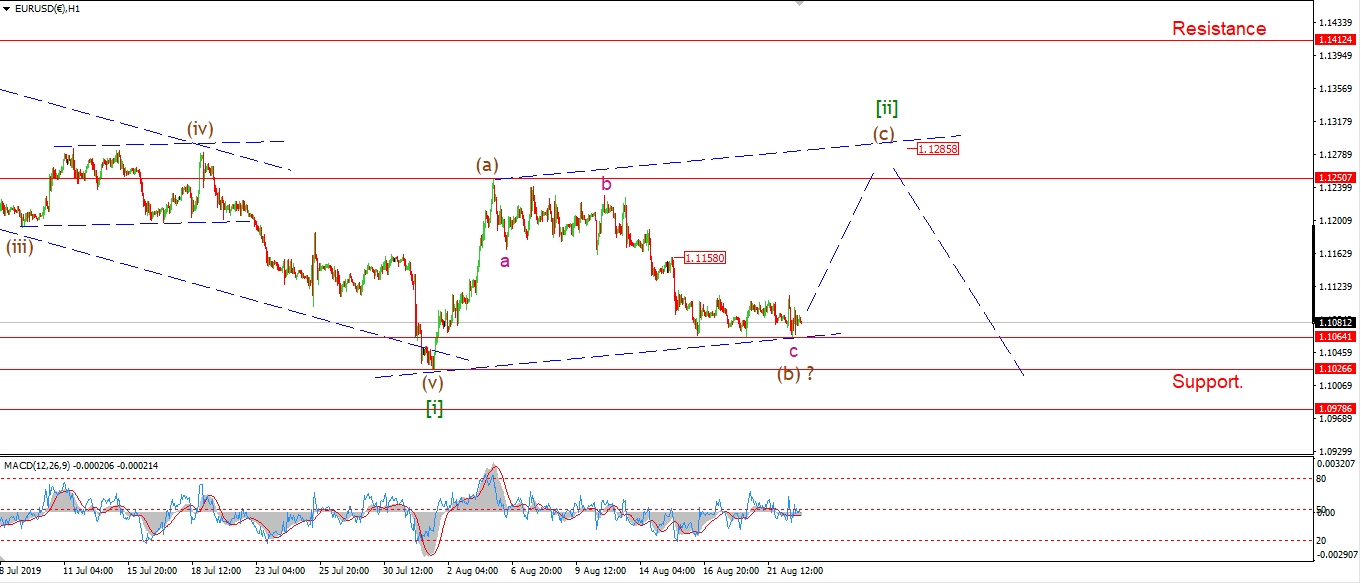 [/vc_column_text][/vc_column][vc_column width=”1/3″][vc_custom_heading text=”4 Hours” use_theme_fonts=”yes”][vc_column_text]
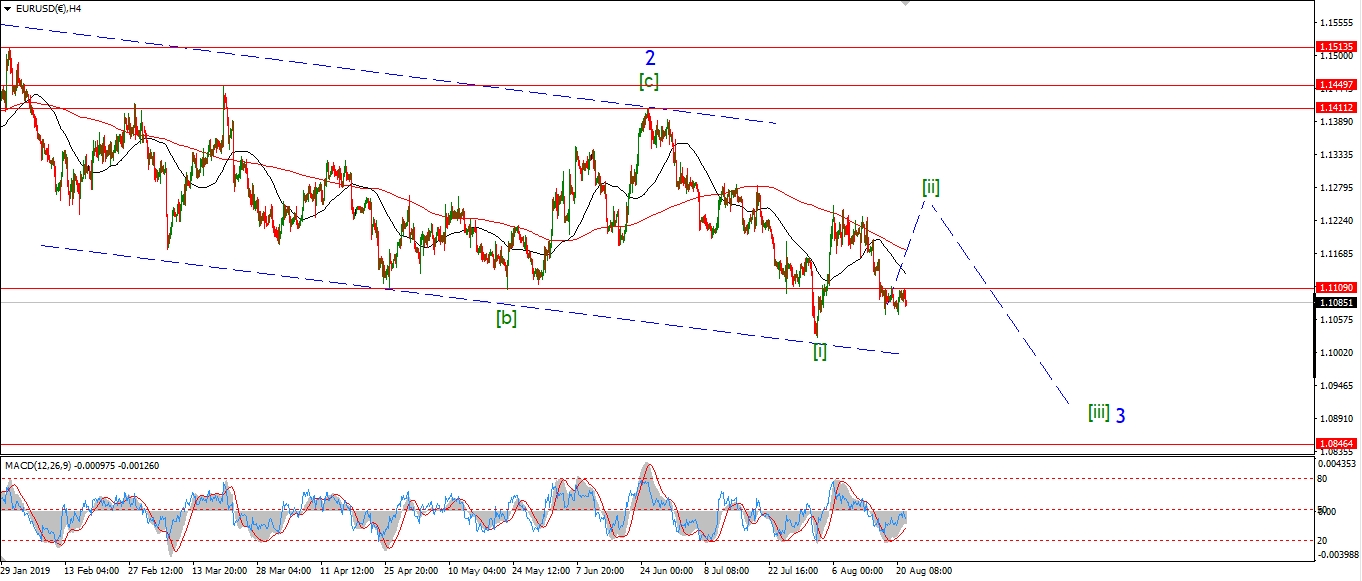 [/vc_column_text][vc_custom_heading text=”Daily” use_theme_fonts=”yes”][vc_column_text]
 [/vc_column_text][/vc_column][/vc_row]
[vc_row][vc_column][vc_column_text]
After a full week of completely flat trading,
we now have a triple bottom in place in EURUSD at the 1.1060 level.
This pair is oversold for a while now,
and the lack of downside momentum is fully supportive of that view.
The market need a relief rally to complete a larger correction before any more downside can be gained.
Tomorrow;
Wave (c) is still the main wave count.
We should see a spike to begin wave (c) by the close tomorrow.
again 1.1060 should hold.
[/vc_column_text][/vc_column][/vc_row]
[vc_row][vc_column][vc_separator border_width=”5″][/vc_column][/vc_row][vc_row][vc_column][vc_column_text]
GBPUSD
[/vc_column_text][/vc_column][/vc_row][vc_row][vc_column][vc_separator border_width=”5″][/vc_column][/vc_row][vc_row][vc_column width=”2/3″][vc_custom_heading text=”1 hr” use_theme_fonts=”yes”][vc_column_text]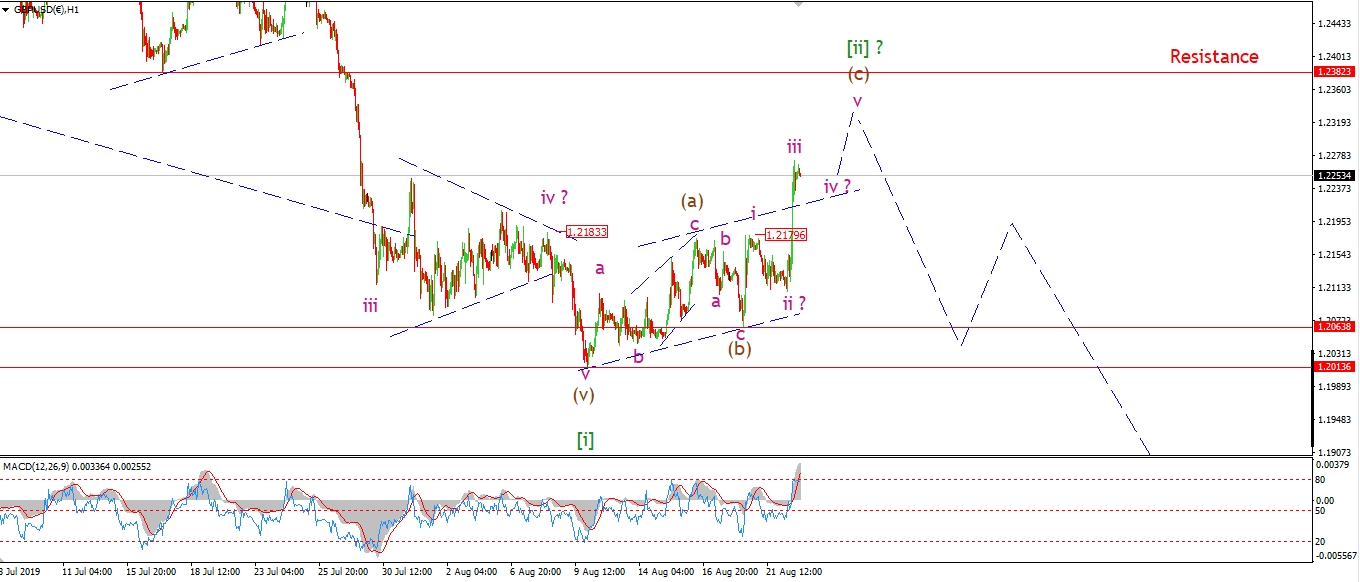 [/vc_column_text][/vc_column][vc_column width=”1/3″][vc_custom_heading text=”4 Hours” use_theme_fonts=”yes”][vc_column_text]
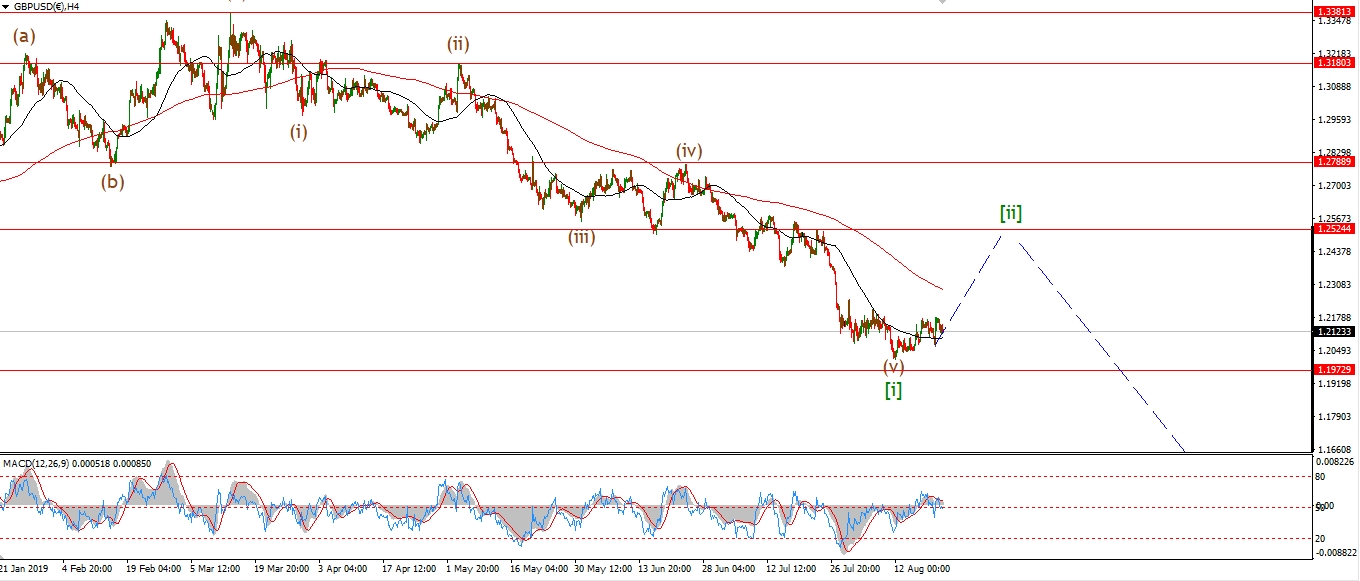 [/vc_column_text][vc_custom_heading text=”Daily” use_theme_fonts=”yes”][vc_column_text]
 [/vc_column_text][/vc_column][/vc_row]
[vc_row][vc_column][vc_column_text]
Finally cable puts in a decent rally to kick off wave (c).
Todays action is labelled wave ‘iii’ of (c),
with a further rally expected in waves ‘iv’ and ‘v’.
There is every chance now that wave (c) will continue higher towards that upper resistance at 1.2382.
So wave ‘v’ may extend into next week.
Tomorrow;
Watch for wave ‘iii’ to top out overnight and wave ‘iv’ to correct sideways tomorrow.
wave ‘iv’ must hold above 1.2180 at the wave ‘i’ high.
[/vc_column_text][/vc_column][/vc_row]
[vc_row][vc_column][vc_separator border_width=”5″][/vc_column][/vc_row][vc_row][vc_column][vc_column_text]
USDJPY
[/vc_column_text][/vc_column][/vc_row][vc_row][vc_column][vc_separator border_width=”5″][/vc_column][/vc_row][vc_row][vc_column width=”2/3″][vc_custom_heading text=”1 hr” use_theme_fonts=”yes”][vc_column_text]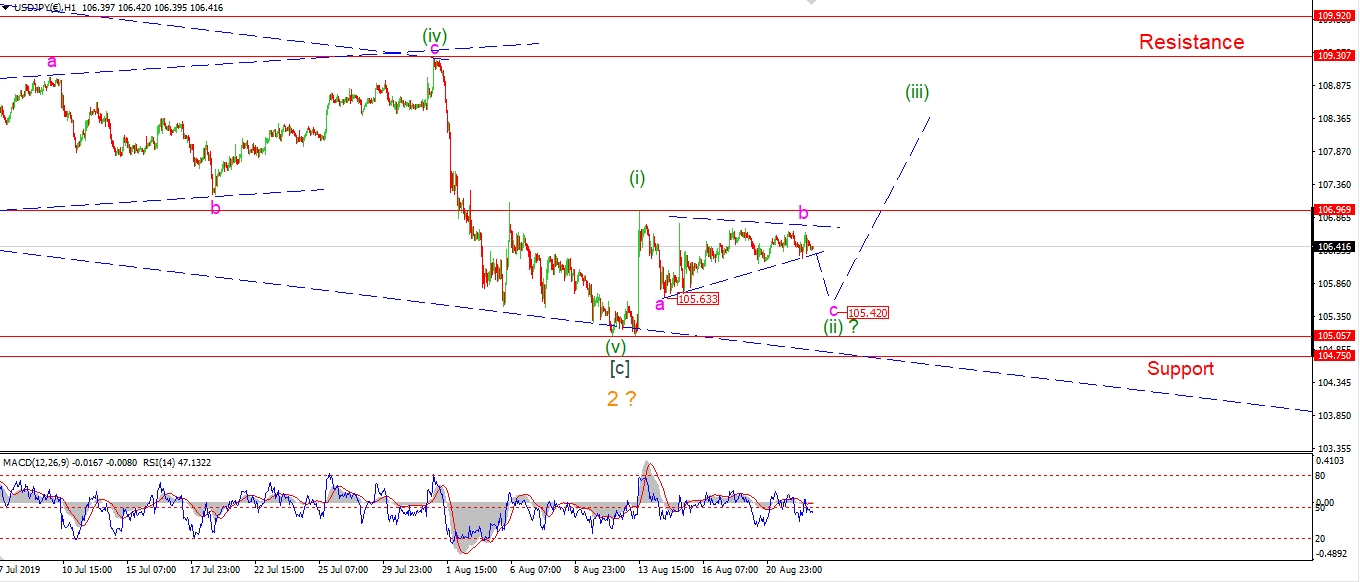 [/vc_column_text][/vc_column][vc_column width=”1/3″][vc_custom_heading text=”4 Hours” use_theme_fonts=”yes”][vc_column_text]
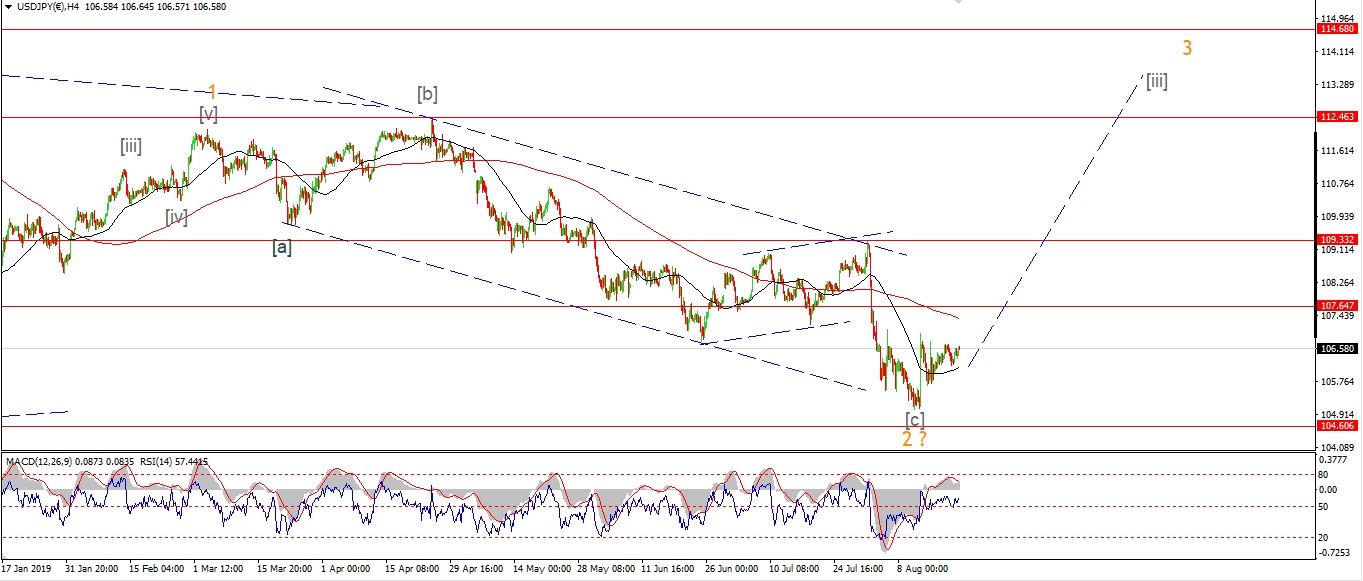 [/vc_column_text][vc_custom_heading text=”Daily” use_theme_fonts=”yes”][vc_column_text]
 [/vc_column_text][/vc_column][/vc_row]
[vc_row][vc_column][vc_column_text]
USDJPY is as quiet as a church mouse over the last week.
We know for certain that this will not last!
And the pattern calls for another drop in wave ‘c’ of (ii)
to complete a correction above 104.75.
Tomorrow;
The triangle in wave ‘b’ should now be complete,
watch for wave ‘c’ to drop below 105.63 to complete wave (ii).
[/vc_column_text][/vc_column][/vc_row]
[vc_row][vc_column][vc_separator border_width=”5″][/vc_column][/vc_row][vc_row][vc_column][vc_column_text]
DOW JONES INDUSTRIALS
[/vc_column_text][/vc_column][/vc_row][vc_row][vc_column][vc_separator border_width=”5″][/vc_column][/vc_row][vc_row][vc_column width=”2/3″][vc_custom_heading text=”1 hr” use_theme_fonts=”yes”][vc_column_text]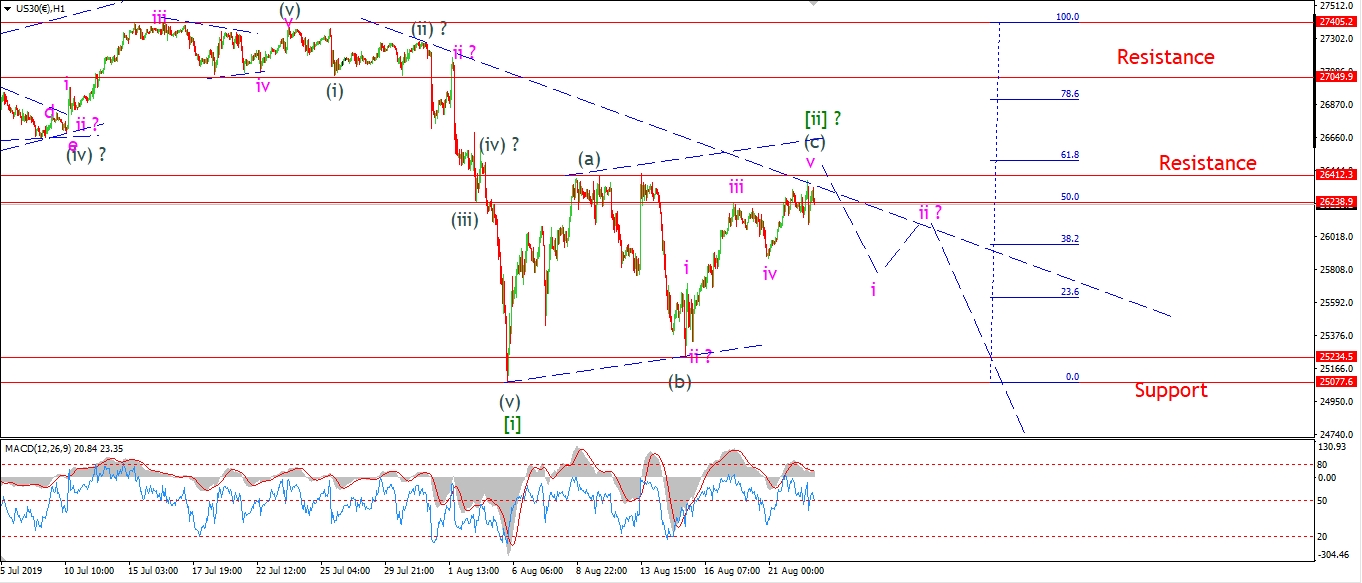 [/vc_column_text][/vc_column][vc_column width=”1/3″][vc_custom_heading text=”4 Hours” use_theme_fonts=”yes”][vc_column_text]
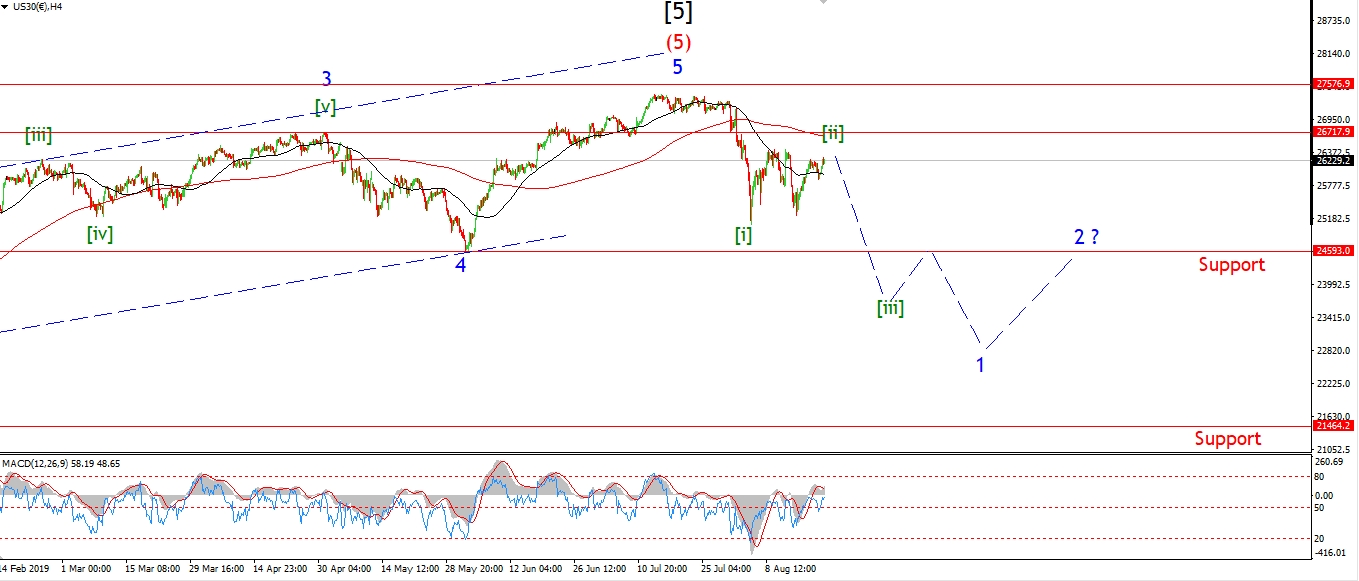 [/vc_column_text][vc_custom_heading text=”Daily” use_theme_fonts=”yes”][vc_column_text]
 [/vc_column_text][/vc_column][/vc_row]
[vc_row][vc_column][vc_column_text]
Todays whipsaw action brought us to within a few points of the previous highs.
This slight new high today,
was enough in my mind to switch to the alternate count for wave[ii] green.
The short term count now shows an all but complete three wave correction in wave [ii].
with a five wave pattern in wave (c) completed.
The overall pattern in wave [ii] can be labelled a running flat correction,
where wave (c) does not make a new high above wave (a).
So here we are again.
A three wave correction ending in a resistance zone.
With a larger bearish lower high in place off the all time high.
If I am correct,
then this market is about to undergo a serious selloff over the coming months.
Inch by inch, day by day!
Tomorrow;
If the high is in for wave (c) then tomorrow should be a turning point down into wave [iii].
Wave [iii] will start slowly and then accelerate as the weeks go on.
Watch for an initial decline towards 26000 again in wave ‘i’ ov (i).
[/vc_column_text][/vc_column][/vc_row]
[vc_row][vc_column][vc_separator border_width=”5″][/vc_column][/vc_row][vc_row][vc_column][vc_column_text]
GOLD
[/vc_column_text][/vc_column][/vc_row][vc_row][vc_column][vc_separator border_width=”5″][/vc_column][/vc_row][vc_row][vc_column width=”2/3″][vc_custom_heading text=”1 hr” use_theme_fonts=”yes”][vc_column_text]
 [/vc_column_text][/vc_column][vc_column width=”1/3″][vc_custom_heading text=”4 Hours” use_theme_fonts=”yes”][vc_column_text]
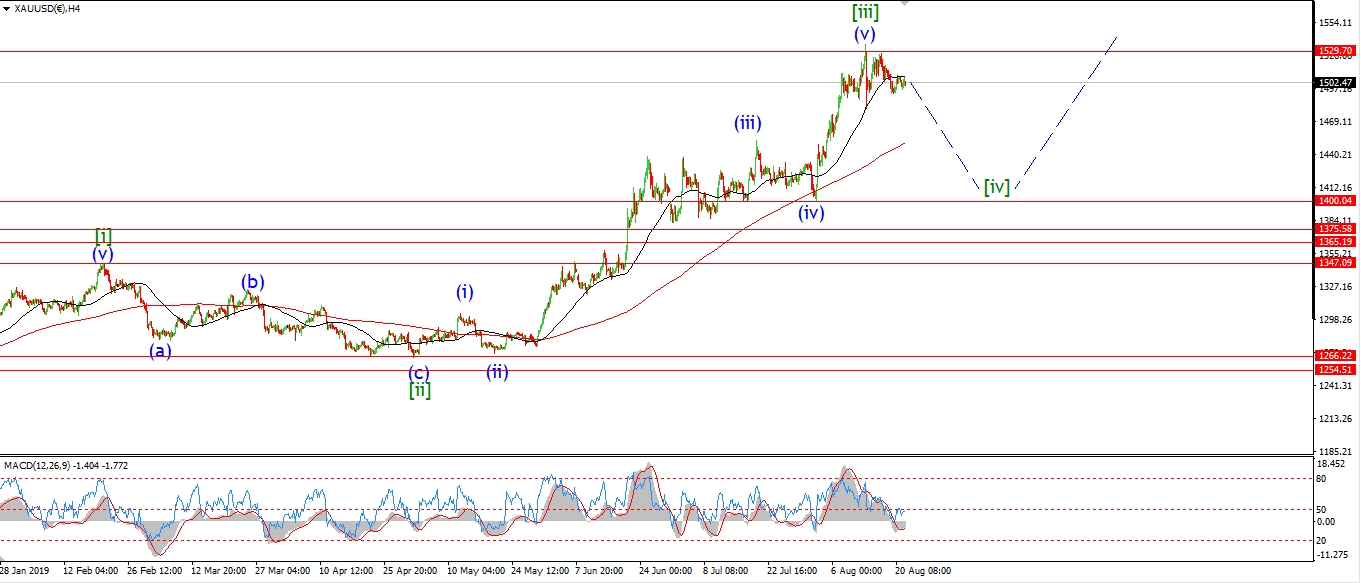 [/vc_column_text][vc_custom_heading text=”Daily” use_theme_fonts=”yes”][vc_column_text]
 [/vc_column_text][/vc_column][/vc_row]
[vc_row][vc_column][vc_column_text]
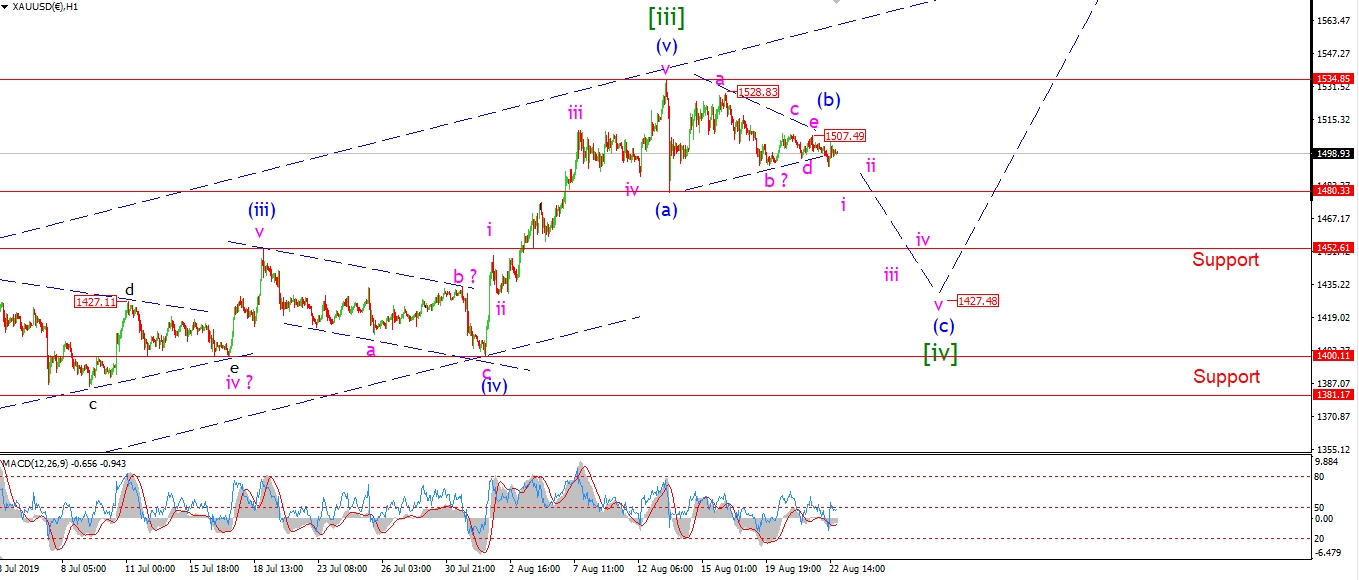
Gold broke slightly lower out of the triangle formation in wave (b).
The price has yet to fall below 1480 to confirm wave (c),
but so long as the price is falling,
The wave (c) is in play.
Tomorrow;
The triangle seems to have completed at 1507 at wave ‘e’.
Watch for price to now hold below that level as wave (c) continues.
[/vc_column_text][/vc_column][/vc_row]
[vc_row][vc_column][vc_separator border_width=”5″][/vc_column][/vc_row][vc_row][vc_column][vc_column_text]
U.S CRUDE OIL
[/vc_column_text][/vc_column][/vc_row][vc_row][vc_column][vc_separator border_width=”5″][/vc_column][/vc_row][vc_row][vc_column width=”2/3″][vc_custom_heading text=”1 hr” use_theme_fonts=”yes”][vc_column_text]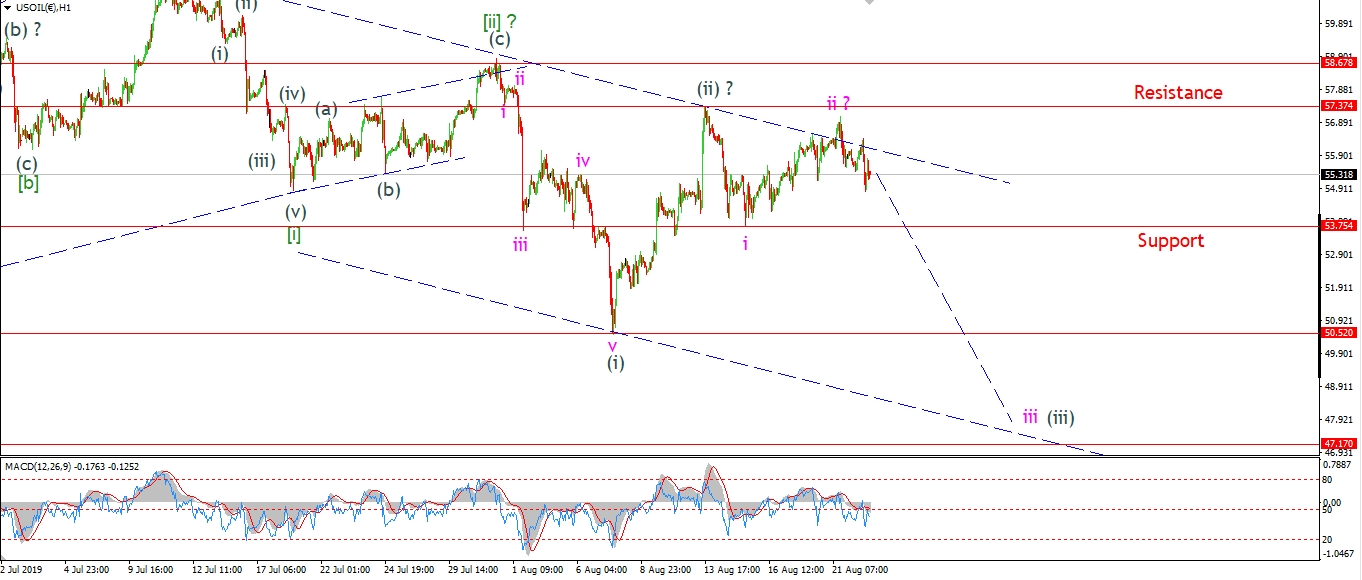 [/vc_column_text][/vc_column][vc_column width=”1/3″][vc_custom_heading text=”4 Hours” use_theme_fonts=”yes”][vc_column_text]
 [/vc_column_text][vc_custom_heading text=”Daily” use_theme_fonts=”yes”][vc_column_text]
 [/vc_column_text][/vc_column][/vc_row]
[vc_row][vc_column][vc_column_text]
Crude pushed lower again today in an early move to begin wave ‘iii’ of (iii) down.
So far we have a three wave pattern in place off the wave ‘ii’ high,
so I want this decline to extend lower tomorrow,
to create a five wave pattern and kick off wave ‘iii’.
Wave (iii) is taking its time in developing,
but I want to see the decline accelerate soon
in order to rule out the alternate count completely.
A break of 50.50 again will do just that.
Tomorrow;
Watch for wave ‘iii’ down to begin with a break of 53.75.
[/vc_column_text][/vc_column][/vc_row]
[vc_row][vc_column][vc_separator border_width=”5″][/vc_column][/vc_row][vc_row][vc_column][vc_column_text]
US 10 yr Treasuries.
[/vc_column_text][/vc_column][/vc_row][vc_row][vc_column][vc_separator border_width=”5″][/vc_column][/vc_row][vc_row][vc_column width=”2/3″][vc_custom_heading text=”1 hr” use_theme_fonts=”yes”][vc_column_text]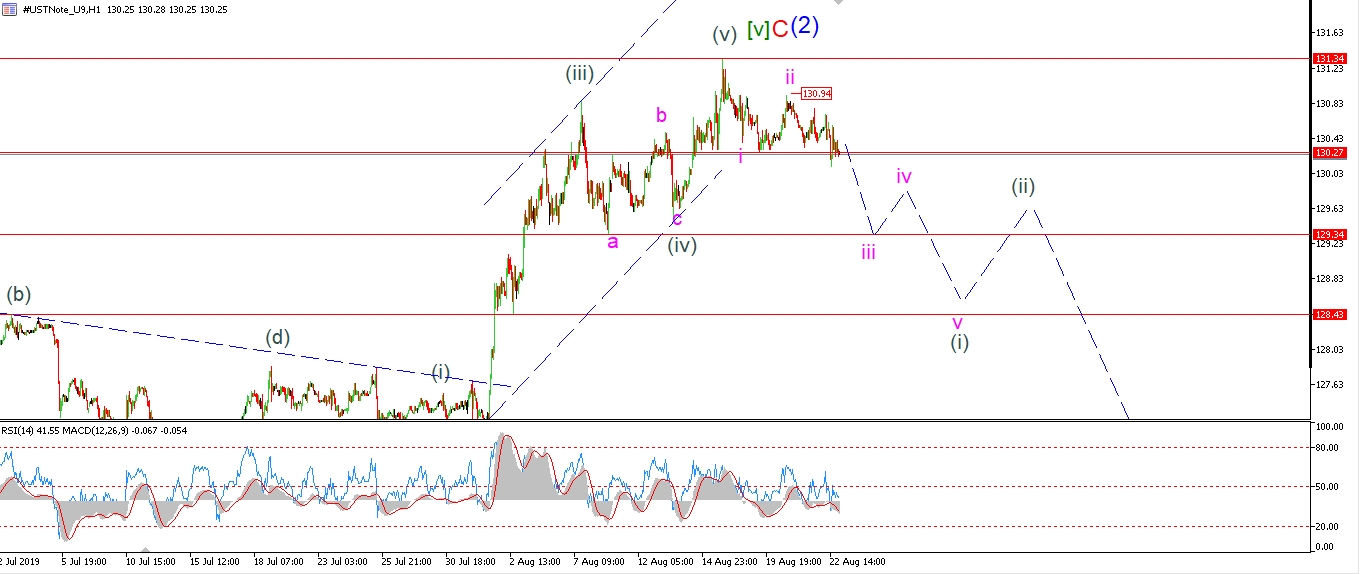 [/vc_column_text][/vc_column][vc_column width=”1/3″][vc_custom_heading text=”4 Hours” use_theme_fonts=”yes”][vc_column_text]
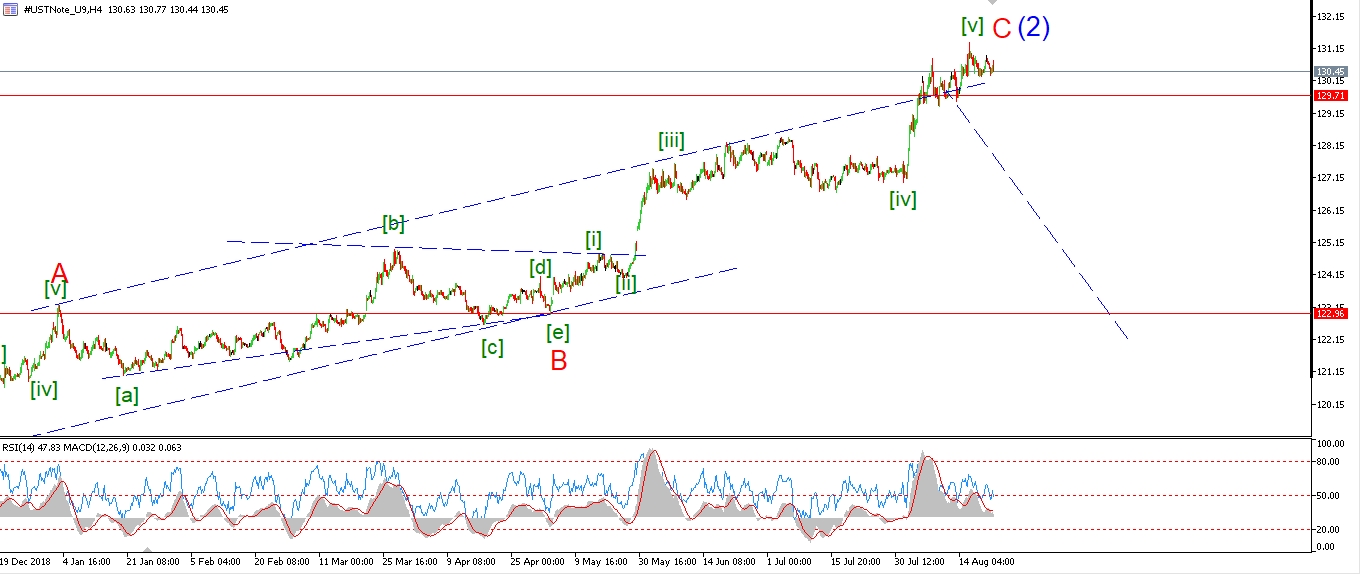 [/vc_column_text][vc_custom_heading text=”Daily” use_theme_fonts=”yes”][vc_column_text]
 [/vc_column_text][/vc_column][/vc_row]
[vc_row][vc_column][vc_column_text]
So far the decline off the recent highs at 131.34 has traced out a three wave pattern.
Unless we see a further drop soon in wave ‘iii’ of (i),
then I will have to consider another alternate.
For the moment,
I am willing to give bonds the benefit of the doubt
to see if a larger five wave decline is underway.
Tomorrow,
Watch for wave ‘iii’ of (i) to continue lower.
130.94 must hold.
[/vc_column_text][/vc_column][/vc_row]
[vc_row][vc_column][vc_separator border_width=”5″][/vc_column][/vc_row][vc_row][vc_column][vc_column_text]
SILVER
[/vc_column_text][/vc_column][/vc_row][vc_row][vc_column][vc_separator border_width=”5″][/vc_column][/vc_row][vc_row][vc_column width=”2/3″][vc_custom_heading text=”1 hr” use_theme_fonts=”yes”][vc_column_text]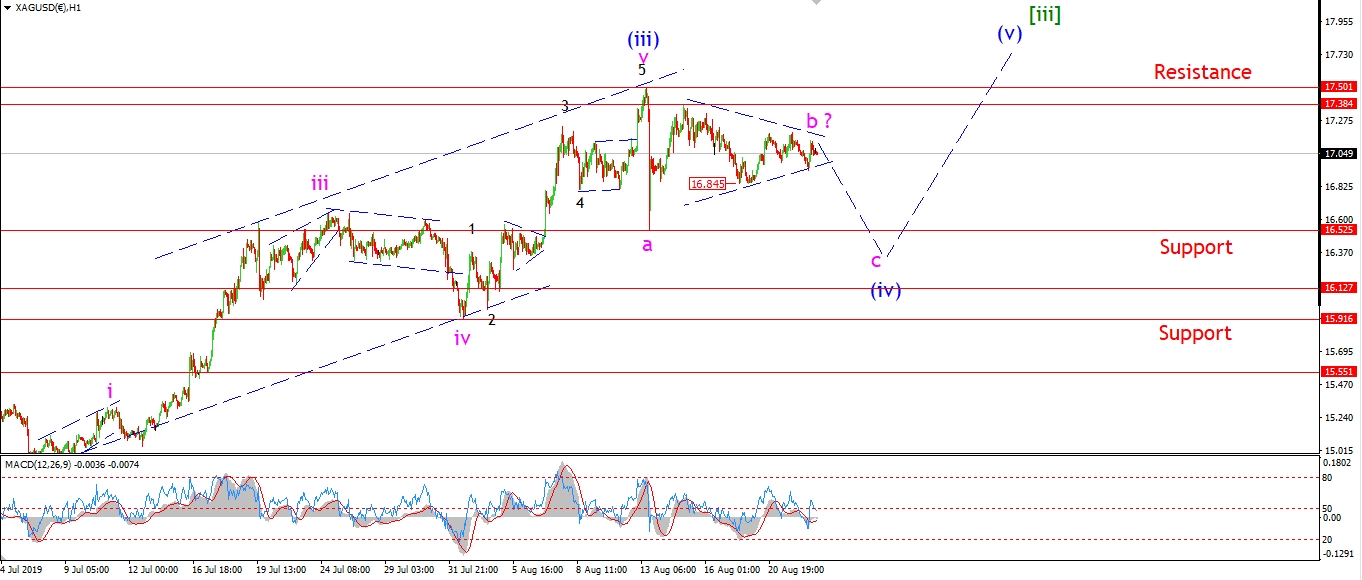 [/vc_column_text][/vc_column][vc_column width=”1/3″][vc_custom_heading text=”4 Hours” use_theme_fonts=”yes”][vc_column_text]
 [/vc_column_text][vc_custom_heading text=”Daily” use_theme_fonts=”yes”][vc_column_text]
 [/vc_column_text][/vc_column][/vc_row]
[vc_row][vc_column][vc_column_text]
The triangle in silver is reaching the end of the road now.
The action continued sideways in a contracting price range.
And todays high has formed another lower high again.
This high may well finish wave ‘b’.
If the price falls again tomorrow and breaks 16.84,
that should be enough to confirm wave ‘c’ has begun.
Tomorrow;
Watch for wave ‘c’ to continue lower and break out of the triangle wave ‘b’.
Wave ‘c’ will reach equality with wave ‘a’ at about 16.12.
[/vc_column_text][/vc_column][/vc_row]
[vc_row][vc_column][vc_separator border_width=”5″][/vc_column][/vc_row][vc_row][vc_column][vc_column_text]
S&P 500.
[/vc_column_text][/vc_column][/vc_row][vc_row][vc_column][vc_separator border_width=”5″][/vc_column][/vc_row][vc_row][vc_column width=”2/3″][vc_custom_heading text=”1 hr” use_theme_fonts=”yes”][vc_column_text]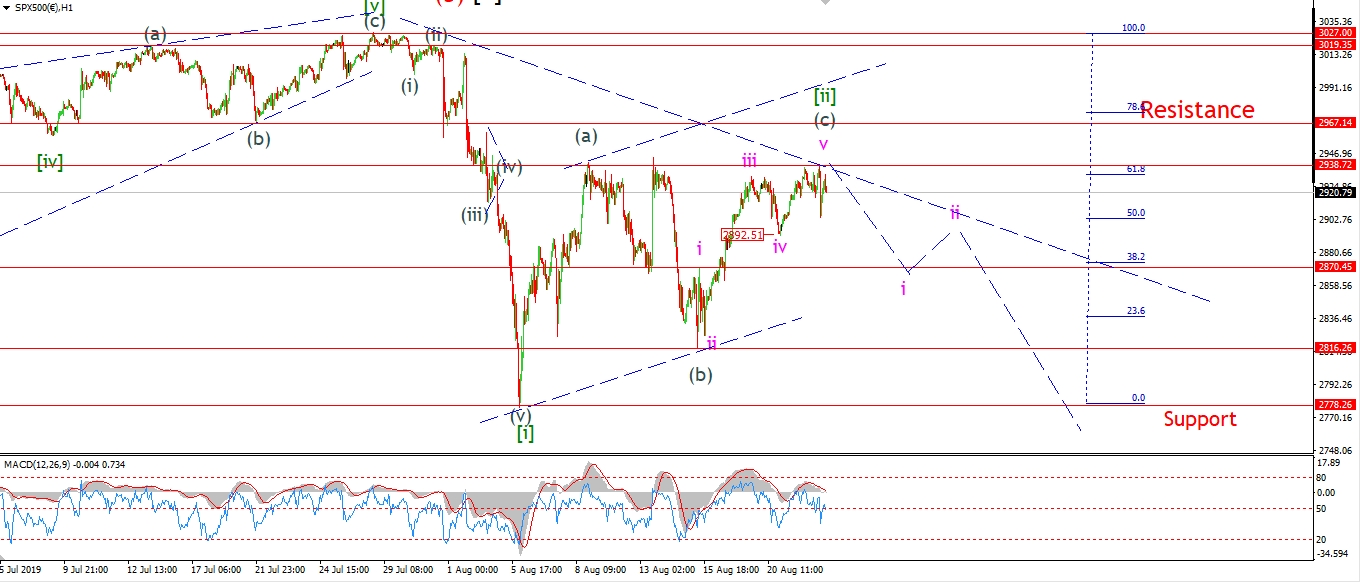 [/vc_column_text][/vc_column][vc_column width=”1/3″][vc_custom_heading text=”4 Hours” use_theme_fonts=”yes”][vc_column_text]
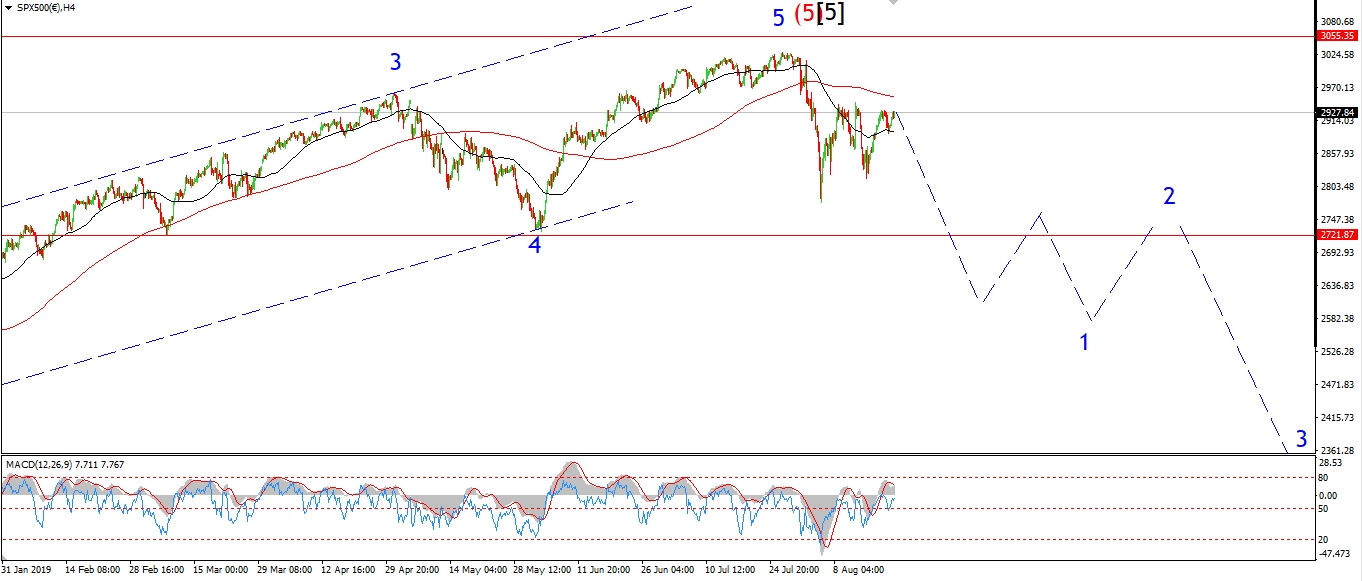 [/vc_column_text][vc_custom_heading text=”Daily” use_theme_fonts=”yes”][vc_column_text]
 [/vc_column_text][/vc_column][/vc_row]
[vc_row][vc_column][vc_column_text]
I have switched to the alternate count in the S&P also today,
The count now shows a completed three wave correction in wave [ii] at todays highs.
The high of wave (a) back on the 8th of this month reached 2938.72.
Todays high in wave (c) reached 2939.08.
So the minimum expected target for wave (c) of the alternate count has been met.
It is interesting that the market rejected off that high
and failed to break out.
So;
just like the DOW,
we have a three wave corrective pattern in place,
a bearish lower high at the 62% retracment level.
and bearish divergence in momentum on the 4hr chart.
Now is a good time for wave [iii] to begin.
Tomorrow;
Watch for wave ‘i’ to fall below 2890 again to turn the tide.
A break of 2816 from these levels should signal that wave [iii] has begun.
[/vc_column_text][/vc_column][/vc_row]
[vc_row][vc_column][vc_separator border_width=”5″][/vc_column][/vc_row]