
[vc_row][vc_column][vc_separator border_width=”5″][/vc_column][/vc_row]
[vc_row][vc_column][vc_column_text]
Good evening everyone.
[/vc_column_text][/vc_column][/vc_row]
[vc_row][vc_column][vc_separator border_width=”5″][/vc_column][/vc_row]
[vc_row][vc_column][vc_column_text]
EURUSD
[/vc_column_text][/vc_column][/vc_row]
[vc_row][vc_column][vc_separator border_width=”5″][/vc_column][/vc_row][vc_row][vc_column width=”2/3″][vc_custom_heading text=”1 hr” use_theme_fonts=”yes”][vc_column_text]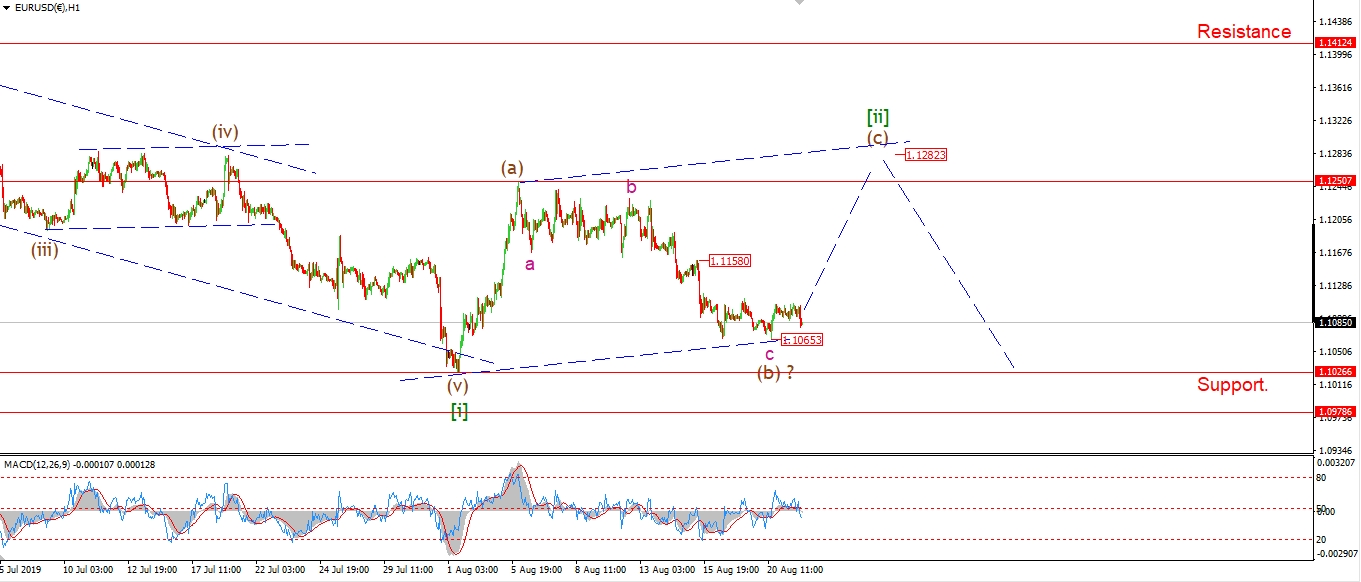 [/vc_column_text][/vc_column][vc_column width=”1/3″][vc_custom_heading text=”4 Hours” use_theme_fonts=”yes”][vc_column_text]
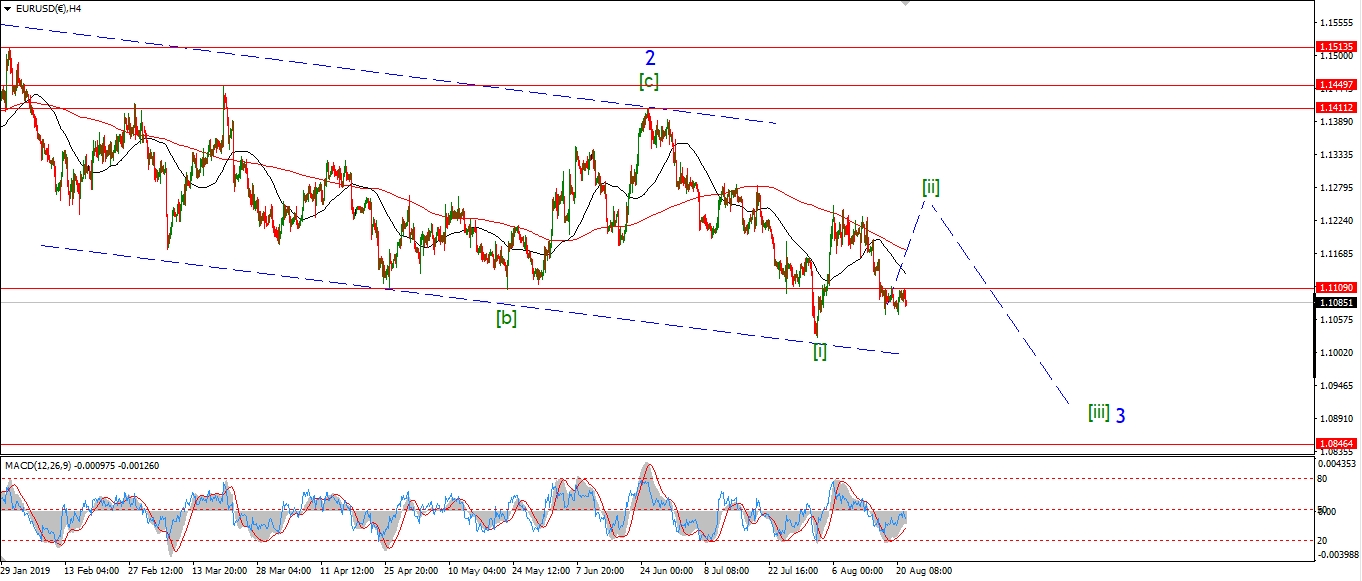 [/vc_column_text][vc_custom_heading text=”Daily” use_theme_fonts=”yes”][vc_column_text]
 [/vc_column_text][/vc_column][/vc_row]
[vc_row][vc_column][vc_column_text]
EURUSD is defying its own wave count and momentum signals at this point!
The rally in wave (c) is delayed but still on the cards.
4hr momentum is rising off an extreme oversold level,
which signals a turn higher at least in the short term as expected.
Tomorrow;
The idea remains the same.
wave (c) up should rally for the rest of the week.
If 1.1065 holds overnight and we see a spike higher tomorrow,
that should signal the beginning of wave (c).
[/vc_column_text][/vc_column][/vc_row]
[vc_row][vc_column][vc_separator border_width=”5″][/vc_column][/vc_row][vc_row][vc_column][vc_column_text]
GBPUSD
[/vc_column_text][/vc_column][/vc_row][vc_row][vc_column][vc_separator border_width=”5″][/vc_column][/vc_row][vc_row][vc_column width=”2/3″][vc_custom_heading text=”1 hr” use_theme_fonts=”yes”][vc_column_text]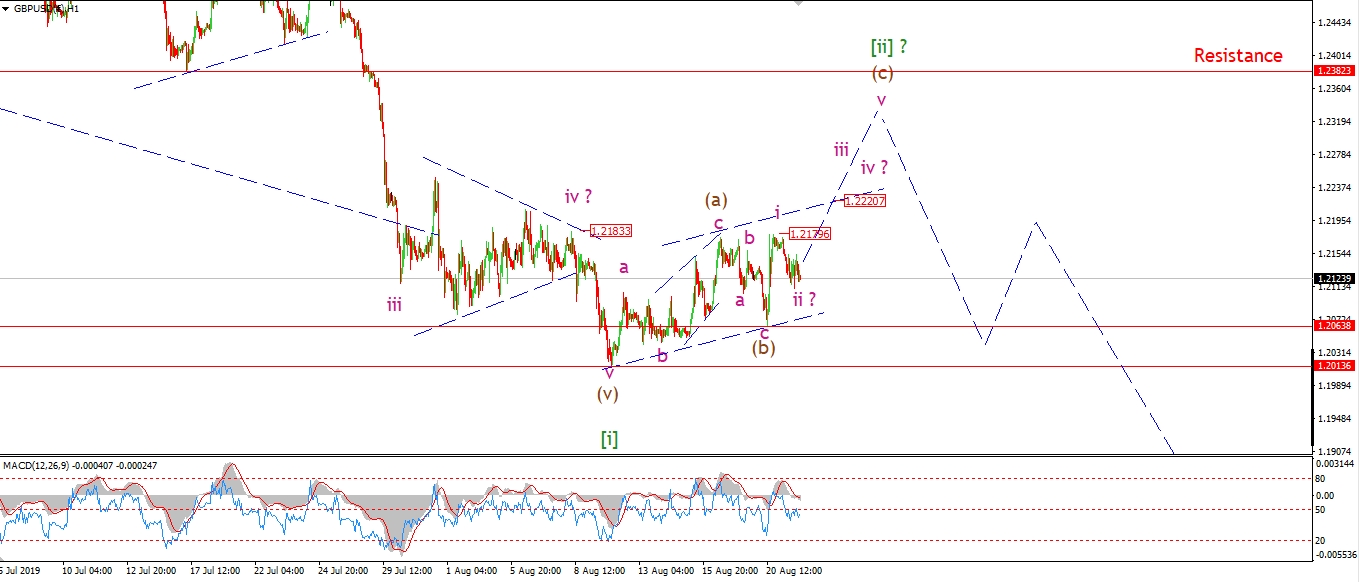 [/vc_column_text][/vc_column][vc_column width=”1/3″][vc_custom_heading text=”4 Hours” use_theme_fonts=”yes”][vc_column_text]
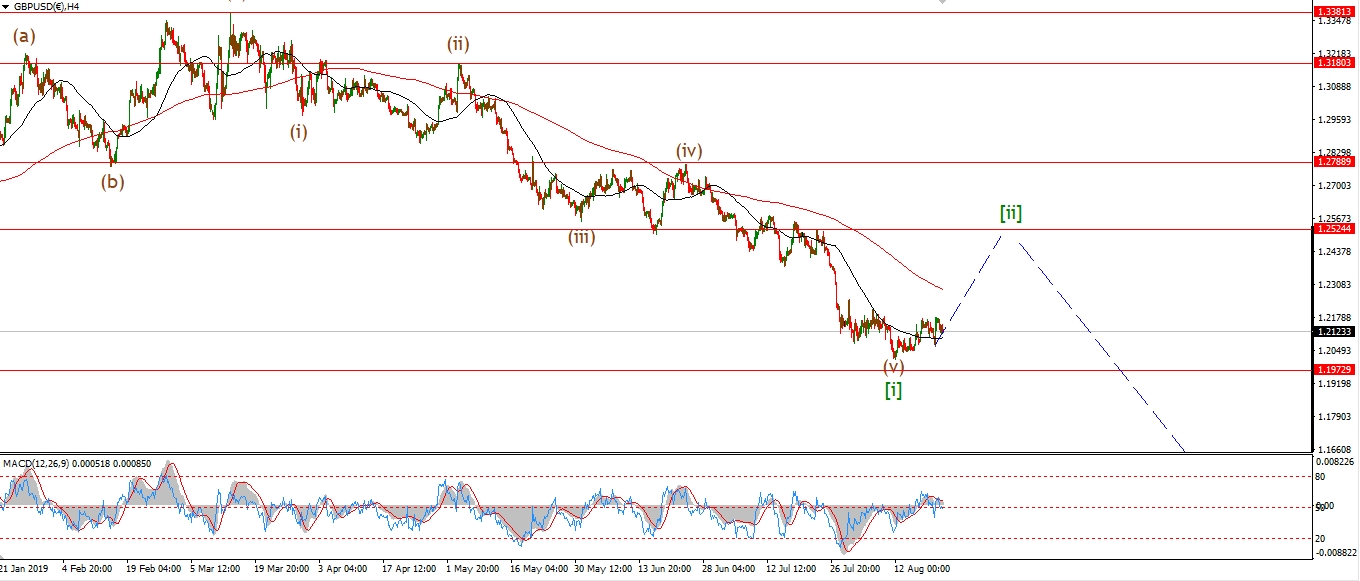 [/vc_column_text][vc_custom_heading text=”Daily” use_theme_fonts=”yes”][vc_column_text]
 [/vc_column_text][/vc_column][/vc_row]
[vc_row][vc_column][vc_column_text]
Cable seems to have traced out a ‘i’ ,’ii’ rally off the wave (b) low at 1.2063.
The price has formed a higher low above 1.2063 this evening,
so we should see a rally in wave ‘iii’ of (c) begin tomorrow.
A break of the wave ‘i’ high at 1.2179 should signal wave ‘iii’ is underway.
Tomorrow;
Watch for wave (c) to continue higher towards 1.2220 at the upper trend line at a minimum.
1.2063 must hold.
[/vc_column_text][/vc_column][/vc_row]
[vc_row][vc_column][vc_separator border_width=”5″][/vc_column][/vc_row][vc_row][vc_column][vc_column_text]
USDJPY
[/vc_column_text][/vc_column][/vc_row][vc_row][vc_column][vc_separator border_width=”5″][/vc_column][/vc_row][vc_row][vc_column width=”2/3″][vc_custom_heading text=”1 hr” use_theme_fonts=”yes”][vc_column_text]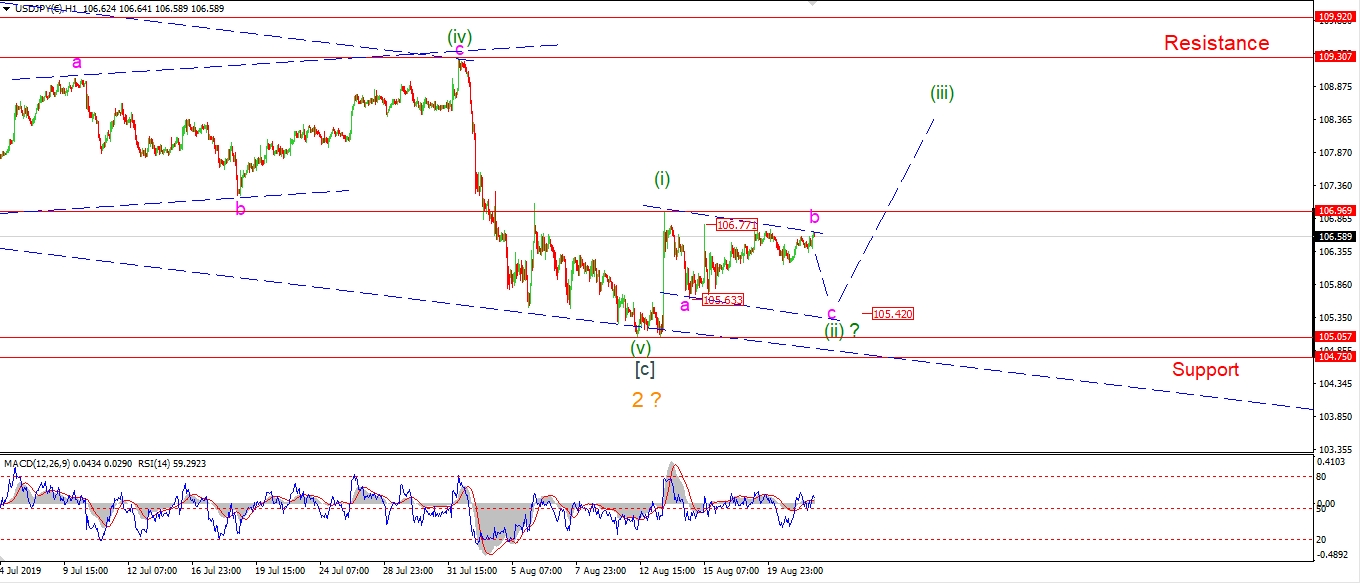 [/vc_column_text][/vc_column][vc_column width=”1/3″][vc_custom_heading text=”4 Hours” use_theme_fonts=”yes”][vc_column_text]
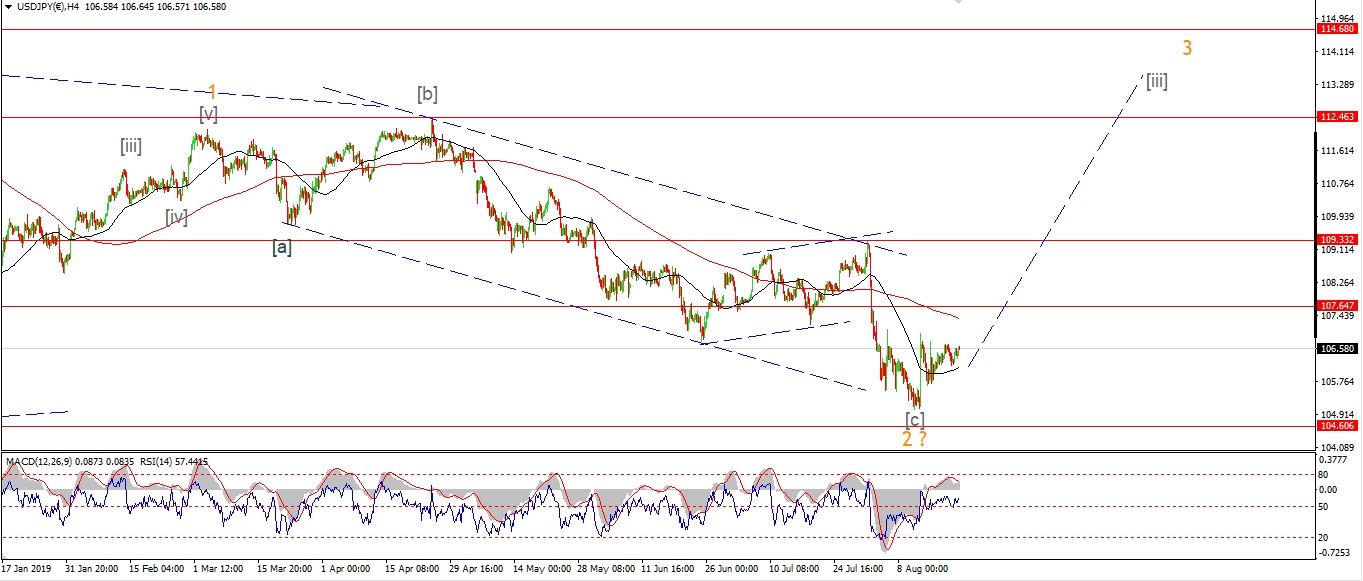 [/vc_column_text][vc_custom_heading text=”Daily” use_theme_fonts=”yes”][vc_column_text]
 [/vc_column_text][/vc_column][/vc_row]
[vc_row][vc_column][vc_column_text]
USDJPY needs one more decline to about 105.40 over the coming few sessions,
to complete a clear three wave pattern sideways in wave (ii).
Wave ‘b’ of (ii) seems to be tracing out a barrier triangle.
In this case,
wave ‘b’ will complete below 106.77 as shown.
And then wave ‘c’ down should break the low for wave ‘a’ at 105.63 to complete wave (ii).
Tomorrow;
watch for wave ‘b’ to complete overnight.
Wave ‘c’ down will be a close call as it must not break support at 104.75.
[/vc_column_text][/vc_column][/vc_row]
[vc_row][vc_column][vc_separator border_width=”5″][/vc_column][/vc_row][vc_row][vc_column][vc_column_text]
DOW JONES INDUSTRIALS
[/vc_column_text][/vc_column][/vc_row][vc_row][vc_column][vc_separator border_width=”5″][/vc_column][/vc_row][vc_row][vc_column width=”2/3″][vc_custom_heading text=”1 hr” use_theme_fonts=”yes”][vc_column_text]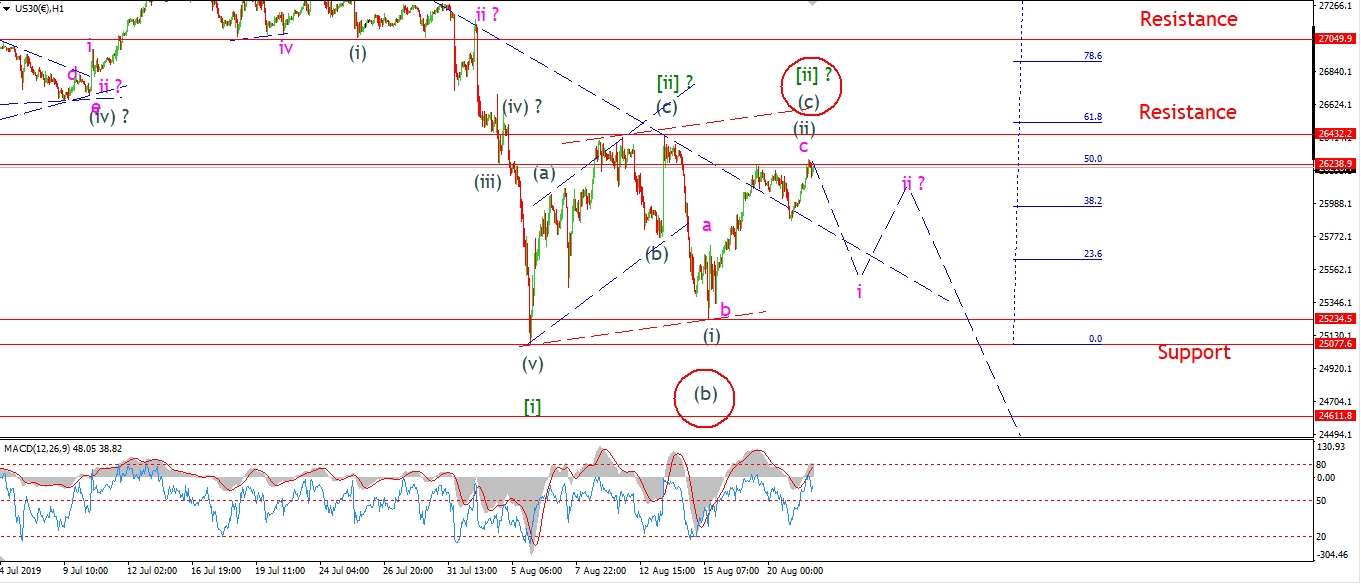 [/vc_column_text][/vc_column][vc_column width=”1/3″][vc_custom_heading text=”4 Hours” use_theme_fonts=”yes”][vc_column_text]
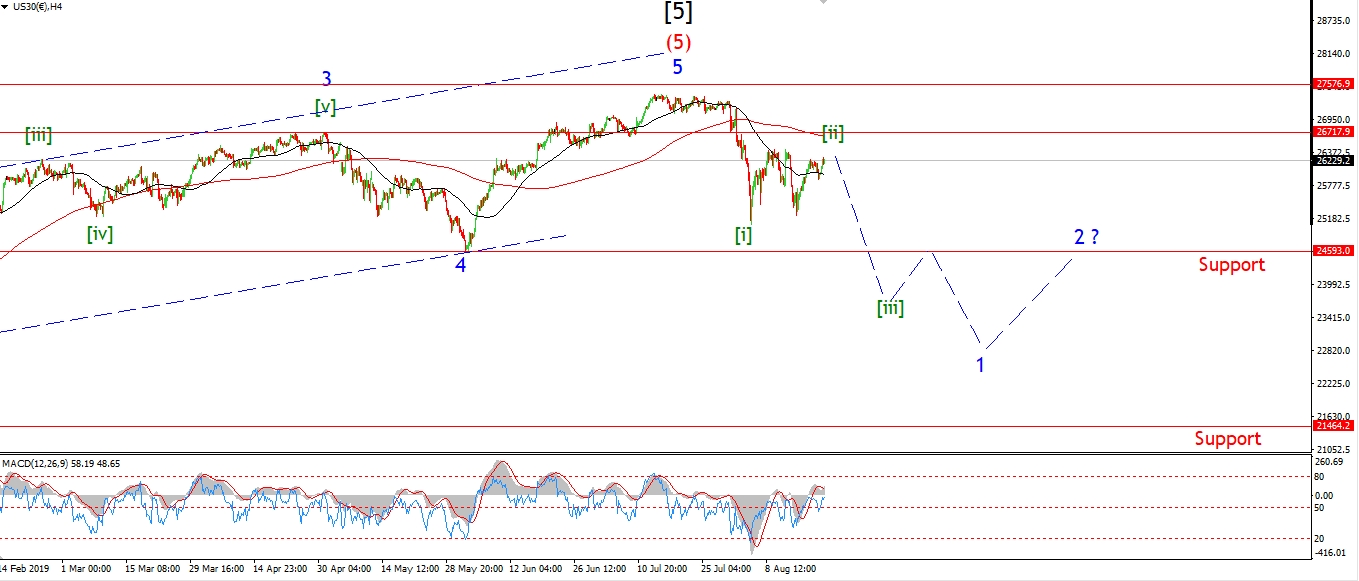 [/vc_column_text][vc_custom_heading text=”Daily” use_theme_fonts=”yes”][vc_column_text]
 [/vc_column_text][/vc_column][/vc_row]
[vc_row][vc_column][vc_column_text]
There was a very slight new high in the DOW today,
but this does not change much in terms of the patterns shown.
The same bearish scenarios are in play now,
Todays slight new high is either the end of wave ‘c’ of (ii).
And wave (iii) down is ready to take over.
Or a larger alternate wave (c) will complete with a break of 26432,
and then wave [iii] down will carry the market lower.
Tomorrow;
Wave [iii] down is now imminent.
Watch for a decline back below the falling trendline.
This should signal wave ‘i’ of (iii) has begun.
26432 should hold.
[/vc_column_text][/vc_column][/vc_row]
[vc_row][vc_column][vc_separator border_width=”5″][/vc_column][/vc_row][vc_row][vc_column][vc_column_text]
GOLD
[/vc_column_text][/vc_column][/vc_row][vc_row][vc_column][vc_separator border_width=”5″][/vc_column][/vc_row][vc_row][vc_column width=”2/3″][vc_custom_heading text=”1 hr” use_theme_fonts=”yes”][vc_column_text]
 [/vc_column_text][/vc_column][vc_column width=”1/3″][vc_custom_heading text=”4 Hours” use_theme_fonts=”yes”][vc_column_text]
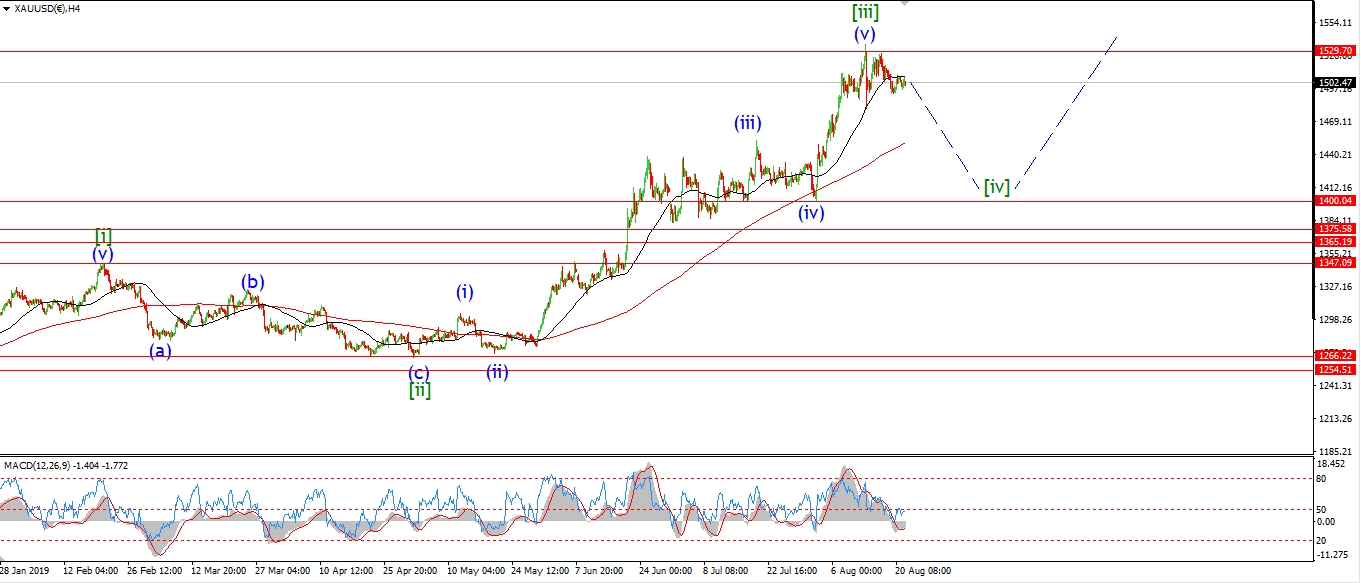 [/vc_column_text][vc_custom_heading text=”Daily” use_theme_fonts=”yes”][vc_column_text]
 [/vc_column_text][/vc_column][/vc_row]
[vc_row][vc_column][vc_column_text]
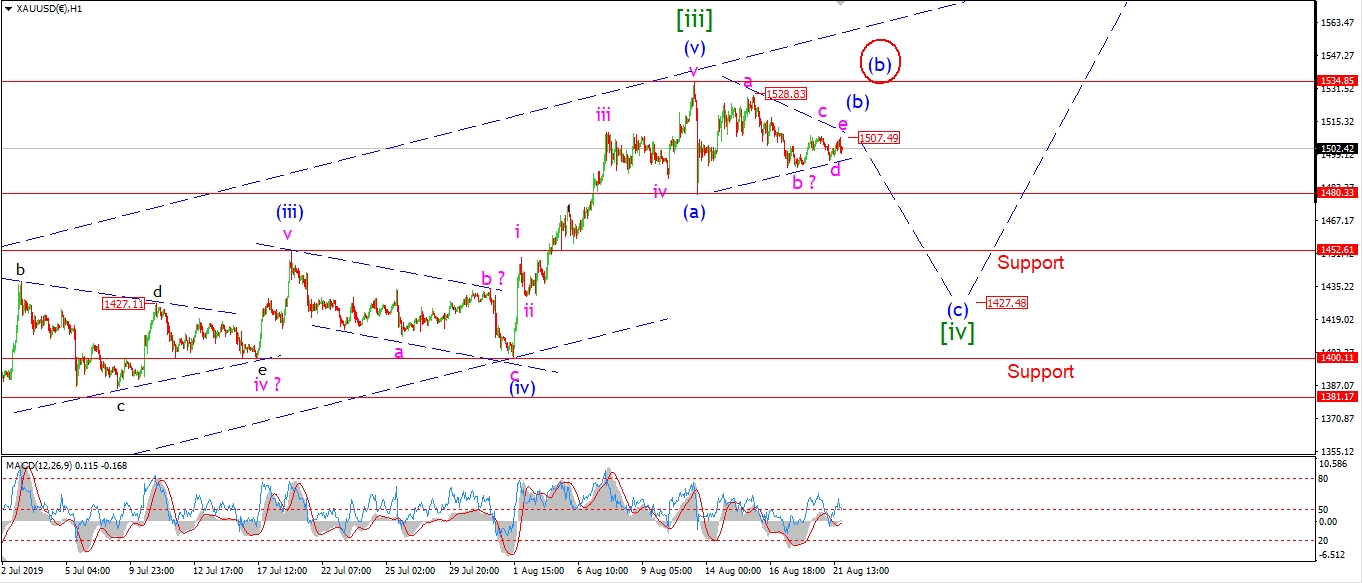
The action in Gold has traced out a near perfect triangle at this evenings highs.
Wave ‘e’ has topped out below Tuesdays high.
And this should complete the larger wave (b) at 1507.50.
The price is moving lower this evening which may be the beginning of wave (c) down.
If we see a break of 1480 tomorrow,
that will signal wave (c) has begun.
The question from here is how low will wave (c) go.
Well,
there is very little appetite for a selloff going on the recent action,
which suggests wave (c) may not reach to the lower support at 1400,
It may even complete above 1450.
But we will have to wait and see.
Tomorrow;
Watch for wave (c) to begin with a break of 1480.
[/vc_column_text][/vc_column][/vc_row]
[vc_row][vc_column][vc_separator border_width=”5″][/vc_column][/vc_row][vc_row][vc_column][vc_column_text]
U.S CRUDE OIL
[/vc_column_text][/vc_column][/vc_row][vc_row][vc_column][vc_separator border_width=”5″][/vc_column][/vc_row][vc_row][vc_column width=”2/3″][vc_custom_heading text=”1 hr” use_theme_fonts=”yes”][vc_column_text]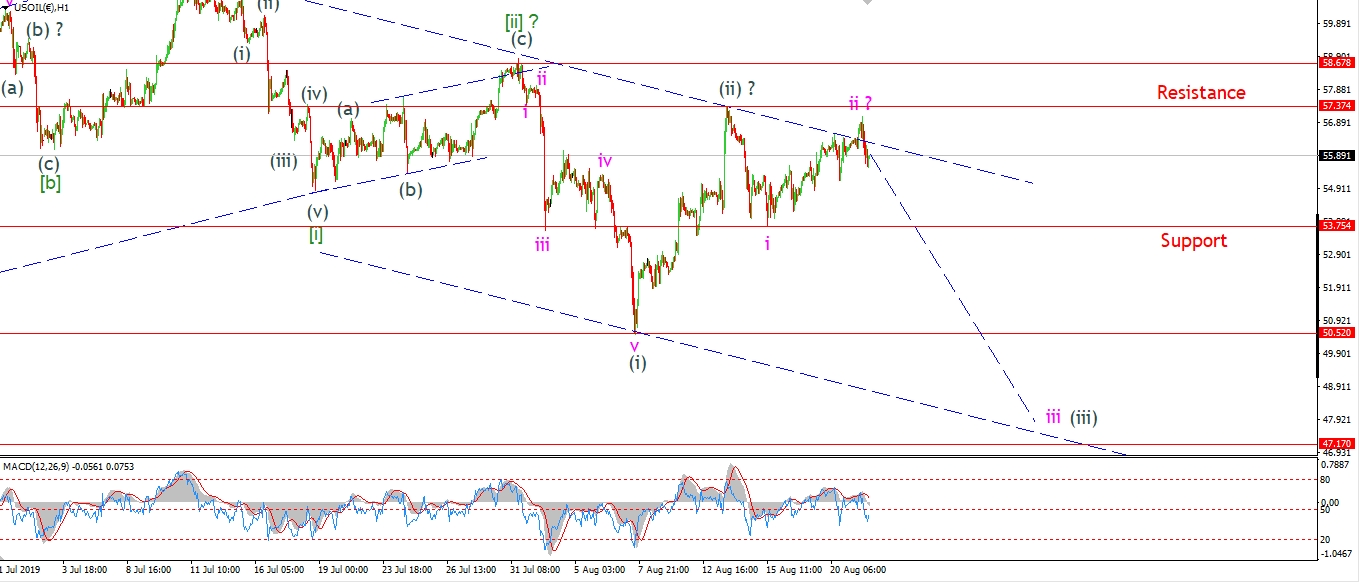 [/vc_column_text][/vc_column][vc_column width=”1/3″][vc_custom_heading text=”4 Hours” use_theme_fonts=”yes”][vc_column_text]
 [/vc_column_text][vc_custom_heading text=”Daily” use_theme_fonts=”yes”][vc_column_text]
 [/vc_column_text][/vc_column][/vc_row]
[vc_row][vc_column][vc_column_text]
The rally off the wave ‘i’ low at 53.75 has been a convoluted mess.
And this action does favor the current wave count
which shows a rise in wave ‘ii’ pink.
The price has again dropped today to push back below the trend channel line.
So we may be seeing the initial moves lower in wave ‘iii’.
Tomorrow;
Tomorrows action should tell us more in that regard.
If the price continues to fall and break 53.75,
that will signal wave ‘iii’ down has begun.
57.37 must hold.
[/vc_column_text][/vc_column][/vc_row]
[vc_row][vc_column][vc_separator border_width=”5″][/vc_column][/vc_row][vc_row][vc_column][vc_column_text]
US 10 yr Treasuries.
[/vc_column_text][/vc_column][/vc_row][vc_row][vc_column][vc_separator border_width=”5″][/vc_column][/vc_row][vc_row][vc_column width=”2/3″][vc_custom_heading text=”1 hr” use_theme_fonts=”yes”][vc_column_text]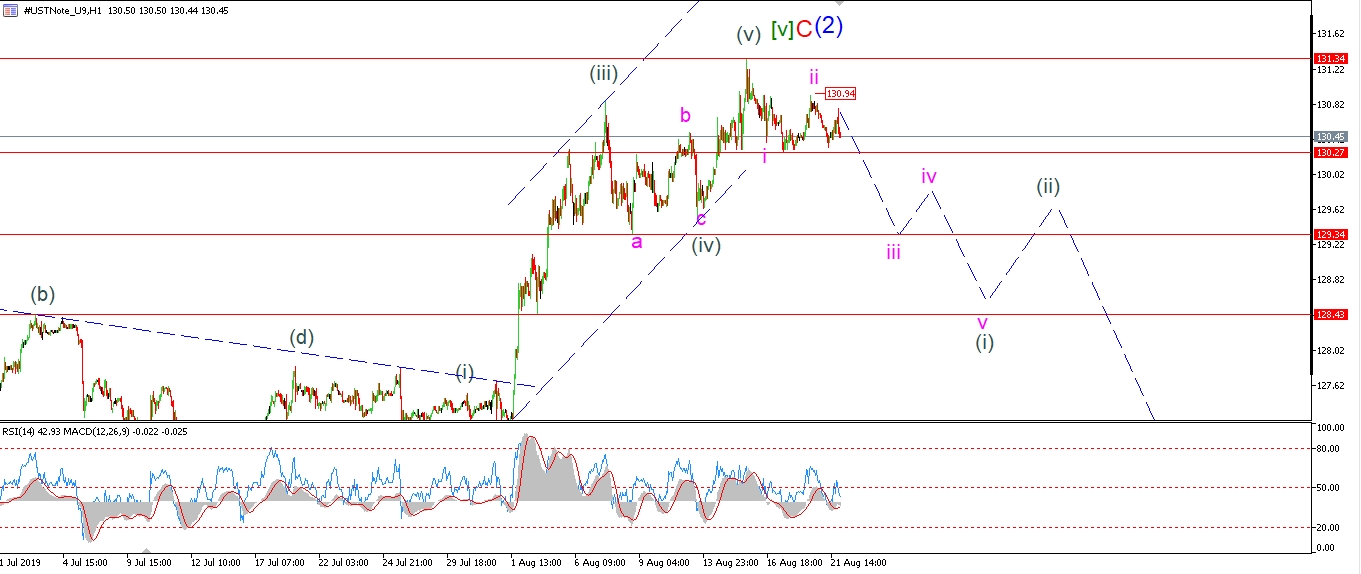 [/vc_column_text][/vc_column][vc_column width=”1/3″][vc_custom_heading text=”4 Hours” use_theme_fonts=”yes”][vc_column_text]
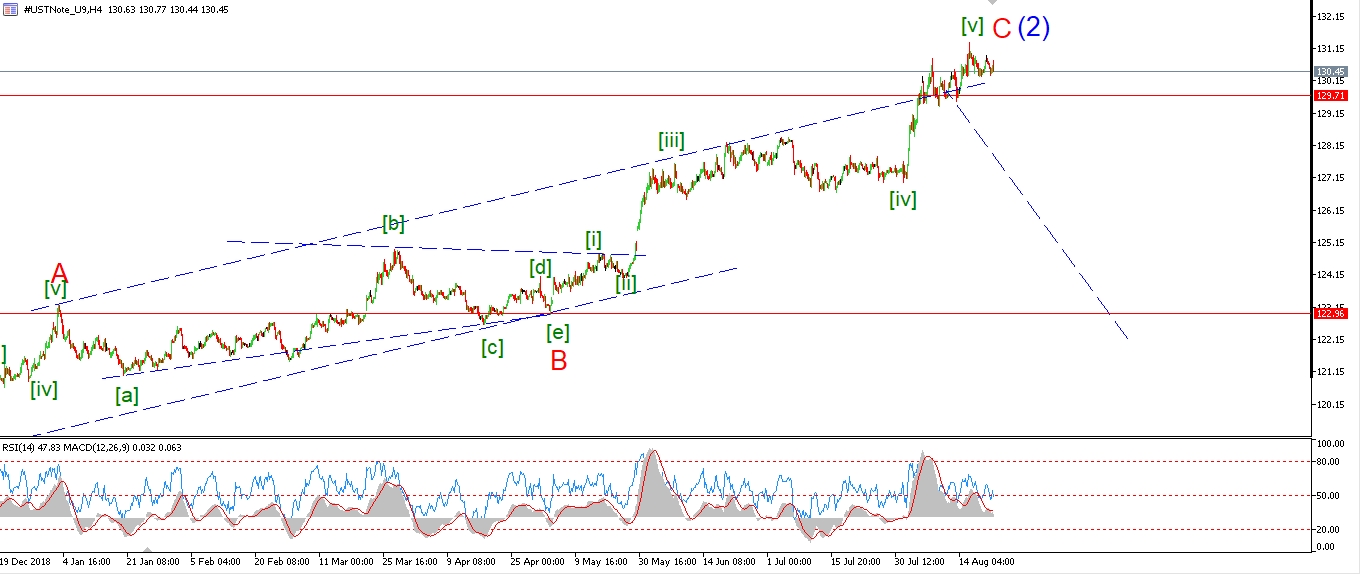 [/vc_column_text][vc_custom_heading text=”Daily” use_theme_fonts=”yes”][vc_column_text]
 [/vc_column_text][/vc_column][/vc_row]
[vc_row][vc_column][vc_column_text]
Bonds did slide lower off Tuesdays high at wave ‘ii’ pink today.
This action is in-keeping with the idea of a fall into wave ‘iii’ down now.
but we have a long way to go to confirm the larger count.
The wave ‘ii’ high topped out at 130.94.
That level should now hold and wave ‘iii’ down should push below 129.34.
Tomorrow;
Watch for 130.94 to hold and wave ‘iii’ down to continue lower.
[/vc_column_text][/vc_column][/vc_row]
[vc_row][vc_column][vc_separator border_width=”5″][/vc_column][/vc_row][vc_row][vc_column][vc_column_text]
SILVER
[/vc_column_text][/vc_column][/vc_row][vc_row][vc_column][vc_separator border_width=”5″][/vc_column][/vc_row][vc_row][vc_column width=”2/3″][vc_custom_heading text=”1 hr” use_theme_fonts=”yes”][vc_column_text]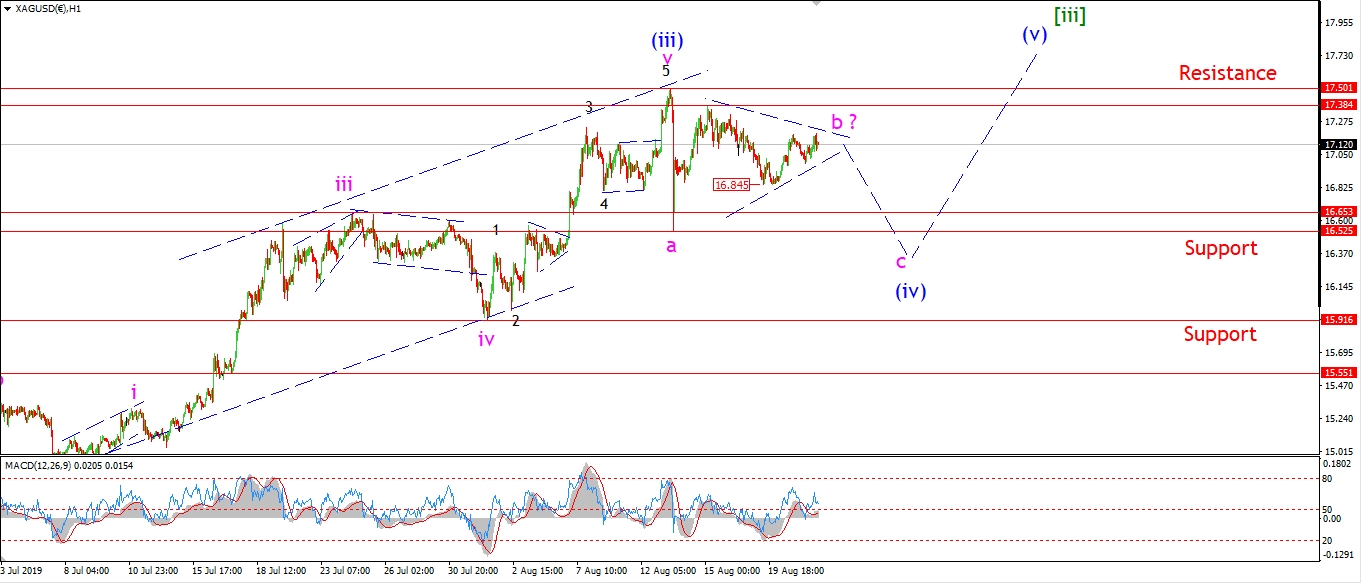 [/vc_column_text][/vc_column][vc_column width=”1/3″][vc_custom_heading text=”4 Hours” use_theme_fonts=”yes”][vc_column_text]
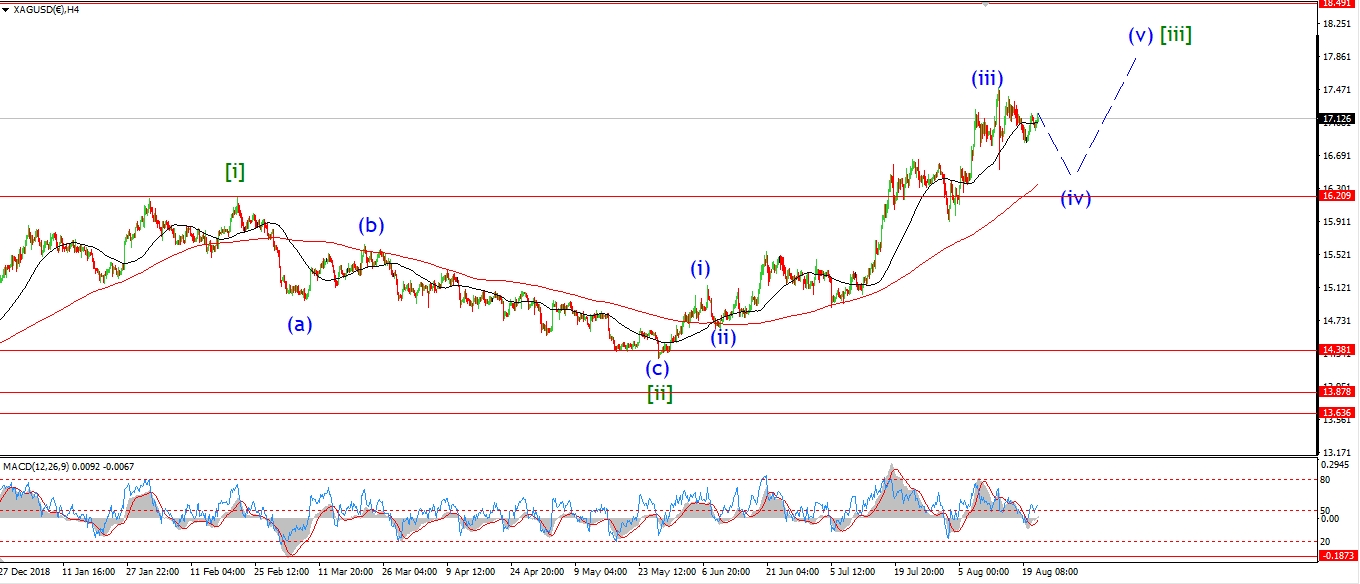 [/vc_column_text][vc_custom_heading text=”Daily” use_theme_fonts=”yes”][vc_column_text]
 [/vc_column_text][/vc_column][/vc_row]
[vc_row][vc_column][vc_column_text]
Silver has maintained the range contraction today,
and with that the idea of a wave ‘b’ triangle is still very possible.
In order for the triangle to remain valid,
price must hold below 17.38 as shown.
A break of the recent interim low at 16.84 will signal that wave ‘c’ has begun.
Tomorrow;
Watch for wave ‘c’ of (iv) to push lower out of the triangle again.
Wave ‘c’ should complete below 16.50.
[/vc_column_text][/vc_column][/vc_row]
[vc_row][vc_column][vc_separator border_width=”5″][/vc_column][/vc_row][vc_row][vc_column][vc_column_text]
S&P 500.
[/vc_column_text][/vc_column][/vc_row][vc_row][vc_column][vc_separator border_width=”5″][/vc_column][/vc_row][vc_row][vc_column width=”2/3″][vc_custom_heading text=”1 hr” use_theme_fonts=”yes”][vc_column_text]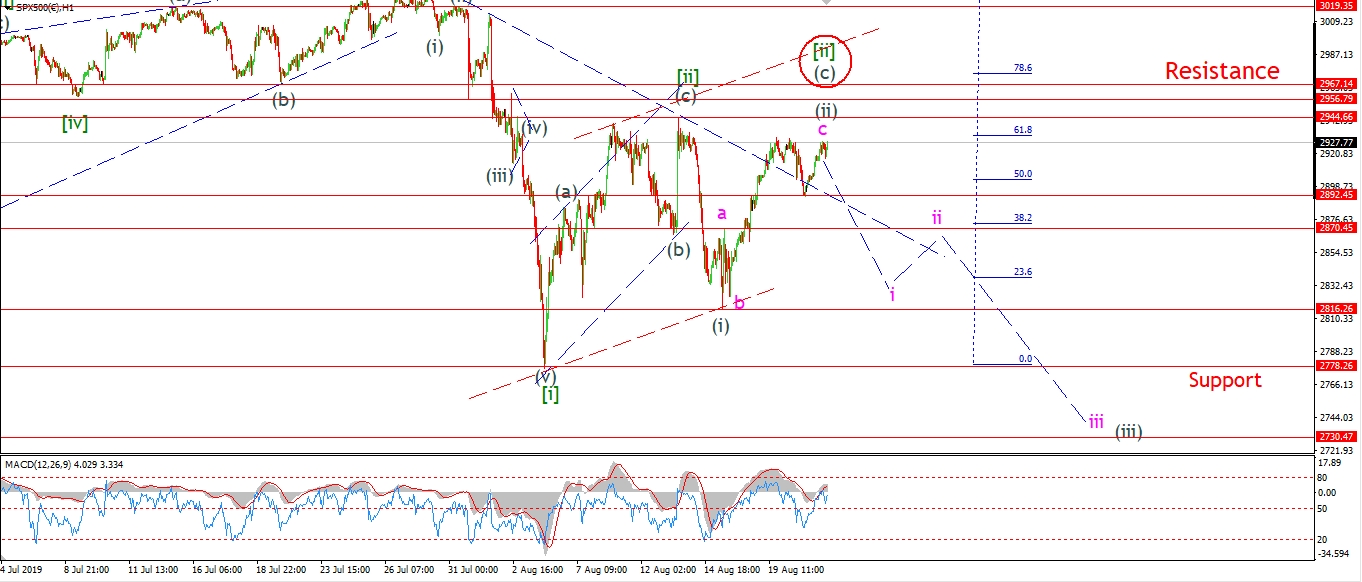 [/vc_column_text][/vc_column][vc_column width=”1/3″][vc_custom_heading text=”4 Hours” use_theme_fonts=”yes”][vc_column_text]
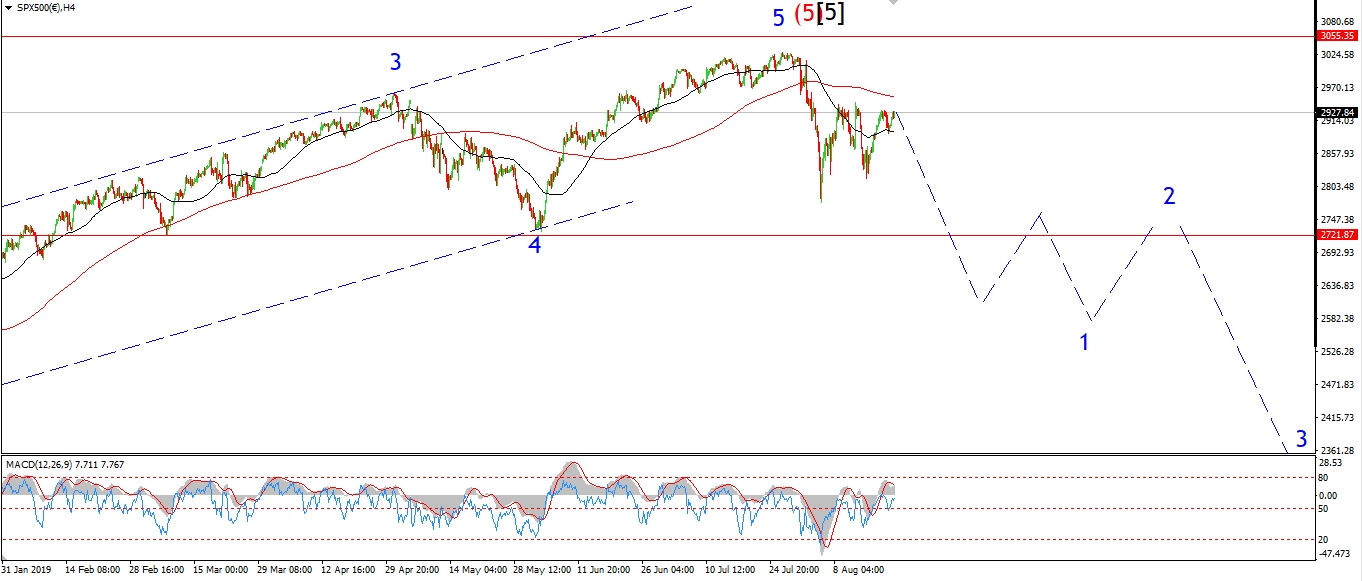 [/vc_column_text][vc_custom_heading text=”Daily” use_theme_fonts=”yes”][vc_column_text]
 [/vc_column_text][/vc_column][/vc_row]
[vc_row][vc_column][vc_column_text]
The S&P did not make a new high today so the short term count is a little less clear here.
The rally today seems to be in five waves,
So this is either a failed fifth wave to complete wave ‘c’.
Or we get another pop tomorrow to break 2944 and complete the alternate count.
In both scenarios I am expecting wave [iii] down to take hold before this week ends.
That leaves us two sessions to finish this correction and move into the main show.
Tomorrow;
A drop back below the trendline again,
A break of 2890 again will increase the odds that wave ‘i’ of (iii) has begun.
[/vc_column_text][/vc_column][/vc_row]
[vc_row][vc_column][vc_separator border_width=”5″][/vc_column][/vc_row]