
[vc_row][vc_column][vc_separator border_width=”5″][/vc_column][/vc_row]
[vc_row][vc_column][vc_column_text]
Good evening all, and welcome to a new week.
[/vc_column_text][/vc_column][/vc_row]
[vc_row][vc_column][vc_separator border_width=”5″][/vc_column][/vc_row]
[vc_row][vc_column][vc_column_text]
EURUSD
[/vc_column_text][/vc_column][/vc_row]
[vc_row][vc_column][vc_separator border_width=”5″][/vc_column][/vc_row][vc_row][vc_column width=”2/3″][vc_custom_heading text=”1 hr” use_theme_fonts=”yes”][vc_column_text]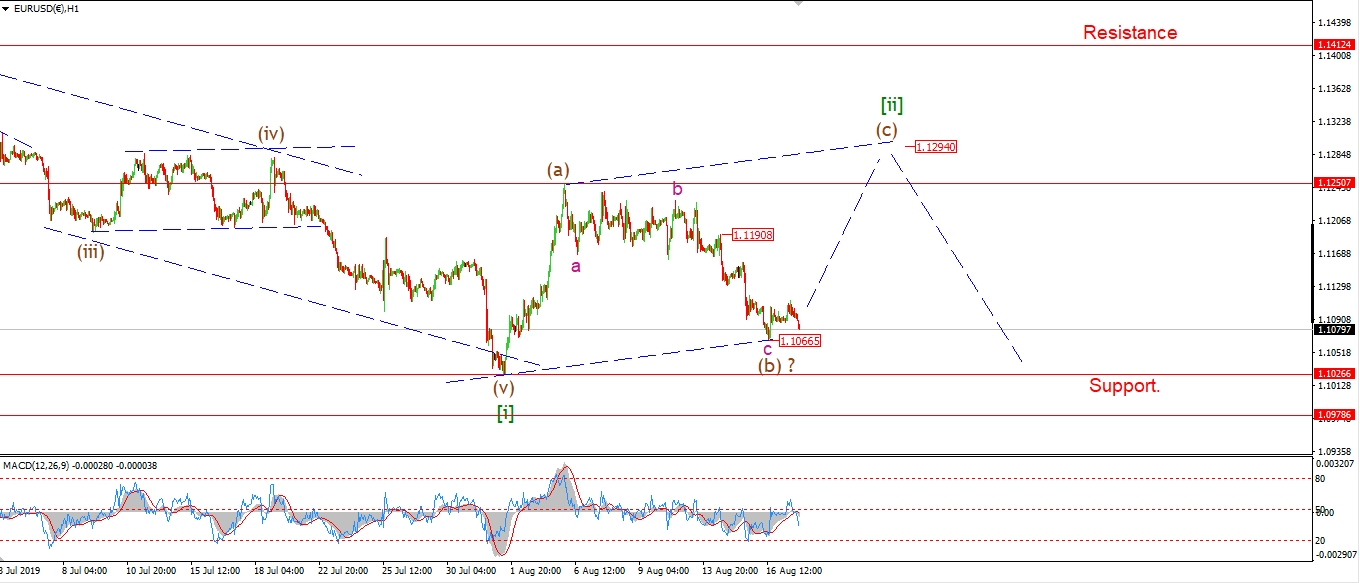 [/vc_column_text][/vc_column][vc_column width=”1/3″][vc_custom_heading text=”4 Hours” use_theme_fonts=”yes”][vc_column_text]
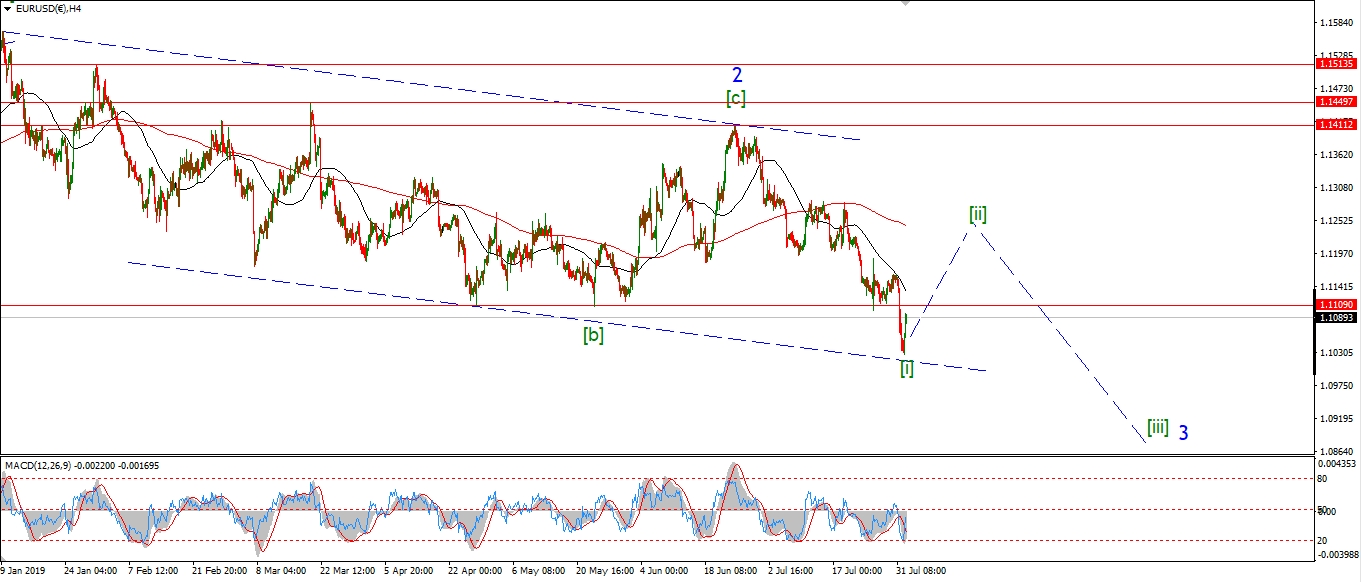 [/vc_column_text][vc_custom_heading text=”Daily” use_theme_fonts=”yes”][vc_column_text]
 [/vc_column_text][/vc_column][/vc_row]
[vc_row][vc_column][vc_column_text]
EURUSD is going nowhere fast!
The price is still holding above Fridays low at 1.1066.
And todays trade look more corrective than otherwise.
So I still think we will get a run higher in wave (c) beginning soon.
Wave (c) should trace out five waves,
lets see if we get a pop tomorrow back above 1.1100 to get us going.
Tomorrow;
Watch for 1.1066 to hold and wave (c) to turn higher again.
[/vc_column_text][/vc_column][/vc_row]
[vc_row][vc_column][vc_separator border_width=”5″][/vc_column][/vc_row][vc_row][vc_column][vc_column_text]
GBPUSD
[/vc_column_text][/vc_column][/vc_row][vc_row][vc_column][vc_separator border_width=”5″][/vc_column][/vc_row][vc_row][vc_column width=”2/3″][vc_custom_heading text=”1 hr” use_theme_fonts=”yes”][vc_column_text]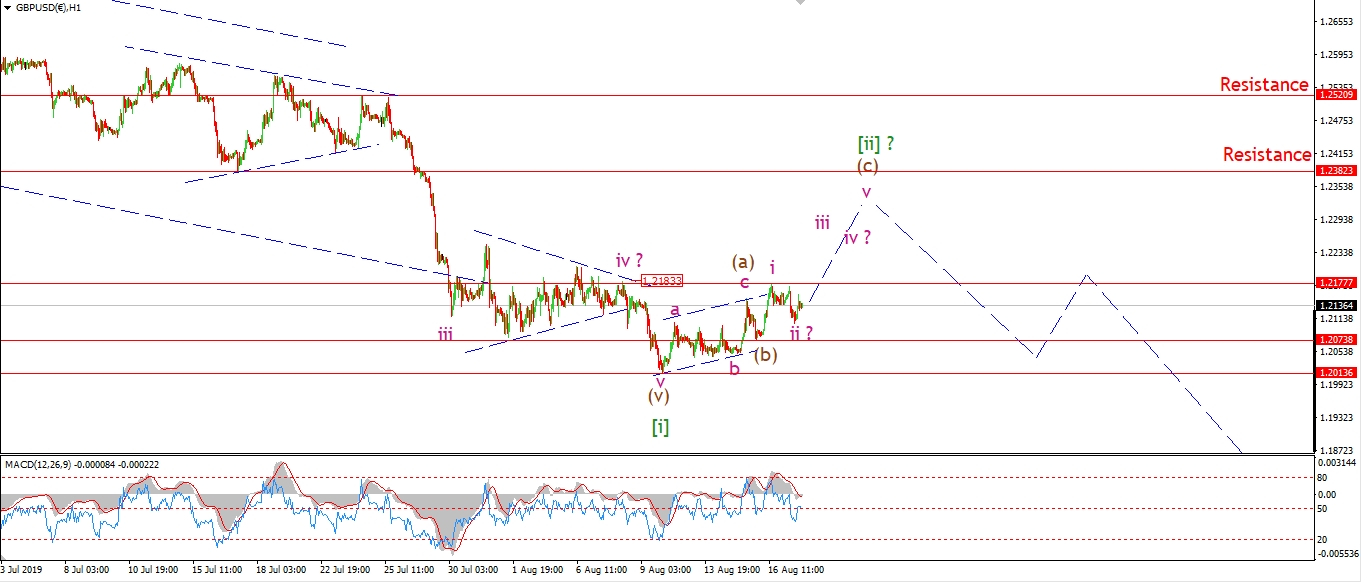 [/vc_column_text][/vc_column][vc_column width=”1/3″][vc_custom_heading text=”4 Hours” use_theme_fonts=”yes”][vc_column_text]
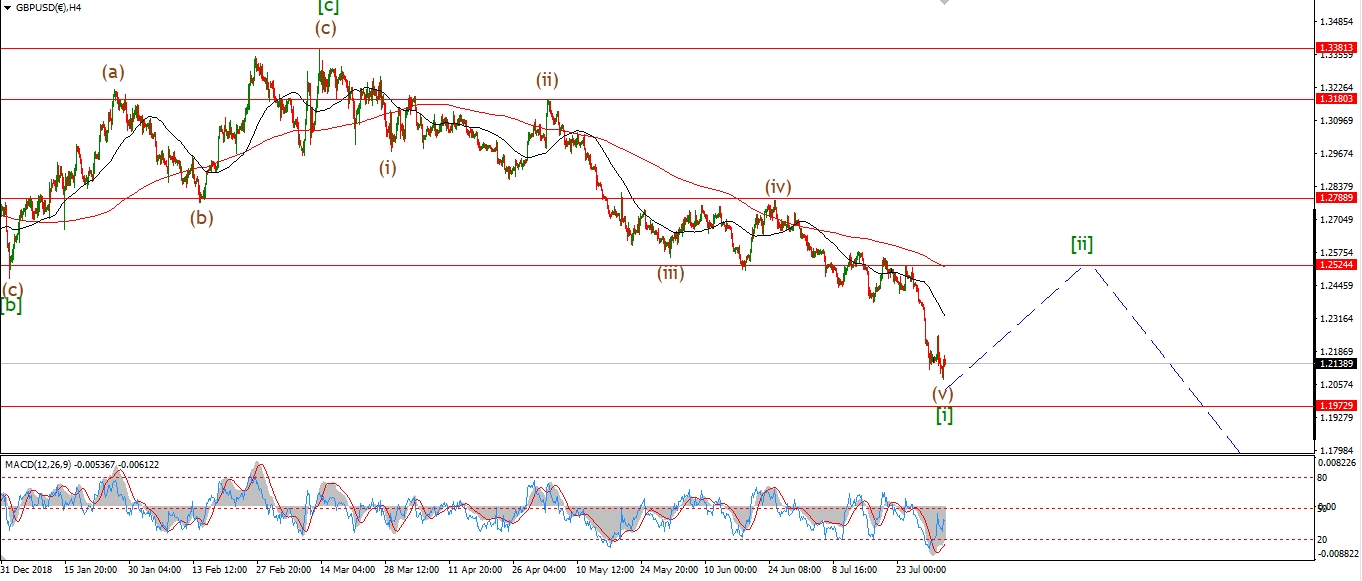 [/vc_column_text][vc_custom_heading text=”Daily” use_theme_fonts=”yes”][vc_column_text]
 [/vc_column_text][/vc_column][/vc_row]
[vc_row][vc_column][vc_column_text]
Cable fell in three waves off Fridays high at 1.2177.
I have labelled todays low as wave ‘ii’ of (c),
with the expectation that wave ‘iii’ of (c) will rally from here towards resistance at 1.2382.
The low at 1.2073 is labelled wave (b) so that level should hold now.
I am aware of how out of proportion that wave (b) looks,
so there is also a chance that a larger structure is building.
Only time will tell on that front.
Tomorrow;
Watch for wave ‘iii’ of (c) to break above 1.2177 tomorrow and confirm the larger pattern.
[/vc_column_text][/vc_column][/vc_row]
[vc_row][vc_column][vc_separator border_width=”5″][/vc_column][/vc_row][vc_row][vc_column][vc_column_text]
USDJPY
[/vc_column_text][/vc_column][/vc_row][vc_row][vc_column][vc_separator border_width=”5″][/vc_column][/vc_row][vc_row][vc_column width=”2/3″][vc_custom_heading text=”1 hr” use_theme_fonts=”yes”][vc_column_text]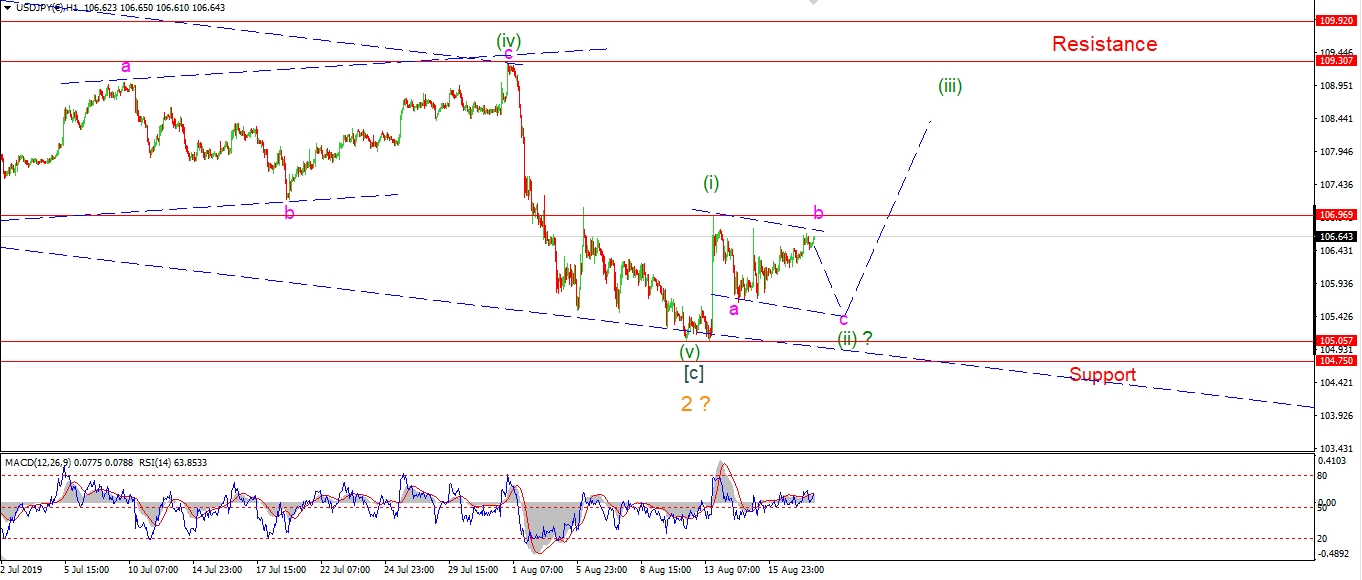 [/vc_column_text][/vc_column][vc_column width=”1/3″][vc_custom_heading text=”4 Hours” use_theme_fonts=”yes”][vc_column_text]
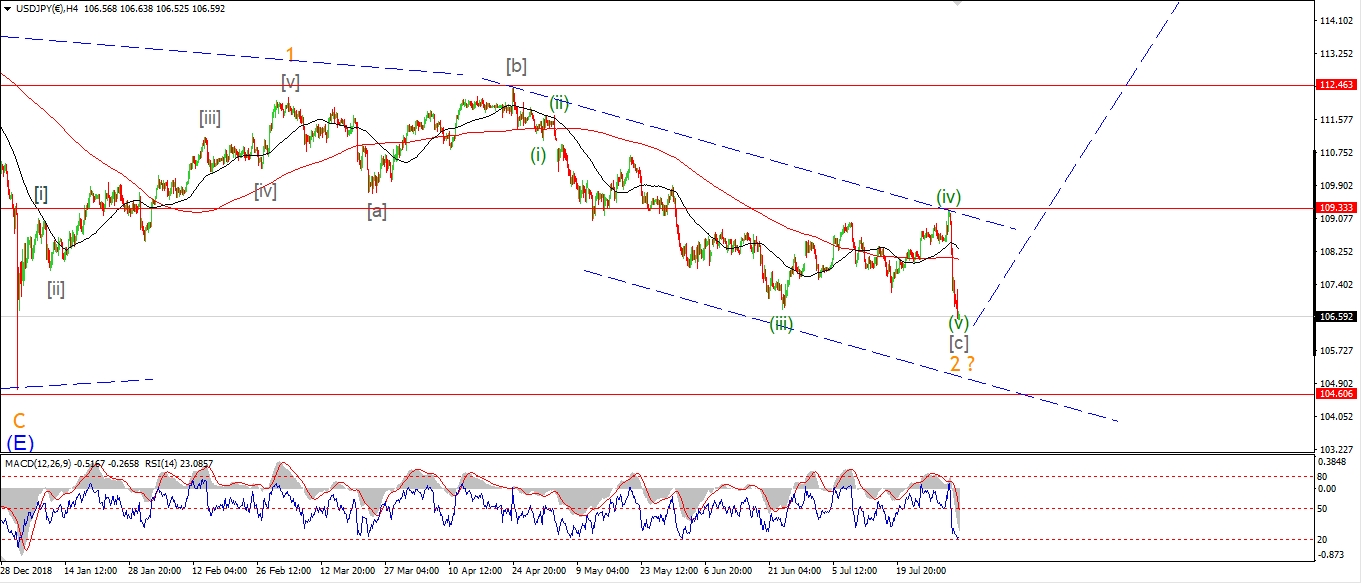 [/vc_column_text][vc_custom_heading text=”Daily” use_theme_fonts=”yes”][vc_column_text]
 [/vc_column_text][/vc_column][/vc_row]
[vc_row][vc_column][vc_column_text]
I think we can safely say that the rise off last weeks lows at wave ‘a’
is still corrective to the upside.
This action is labelled wave ‘b’ of (ii),
And wave ‘c’ is left to fall back into the danger territory again at about 105.40.
The larger wave (ii) should then be complete,
and we will be set for a rally in wave (iii) of [i] to pull us up and out of this danger zone.
Tomorrow;
This week will be critical for the long term pattern in USDJPY.
The price must hold above 104.75,
and an impulsive rally must begin.
[/vc_column_text][/vc_column][/vc_row]
[vc_row][vc_column][vc_separator border_width=”5″][/vc_column][/vc_row][vc_row][vc_column][vc_column_text]
DOW JONES INDUSTRIALS
[/vc_column_text][/vc_column][/vc_row][vc_row][vc_column][vc_separator border_width=”5″][/vc_column][/vc_row][vc_row][vc_column width=”2/3″][vc_custom_heading text=”1 hr” use_theme_fonts=”yes”][vc_column_text]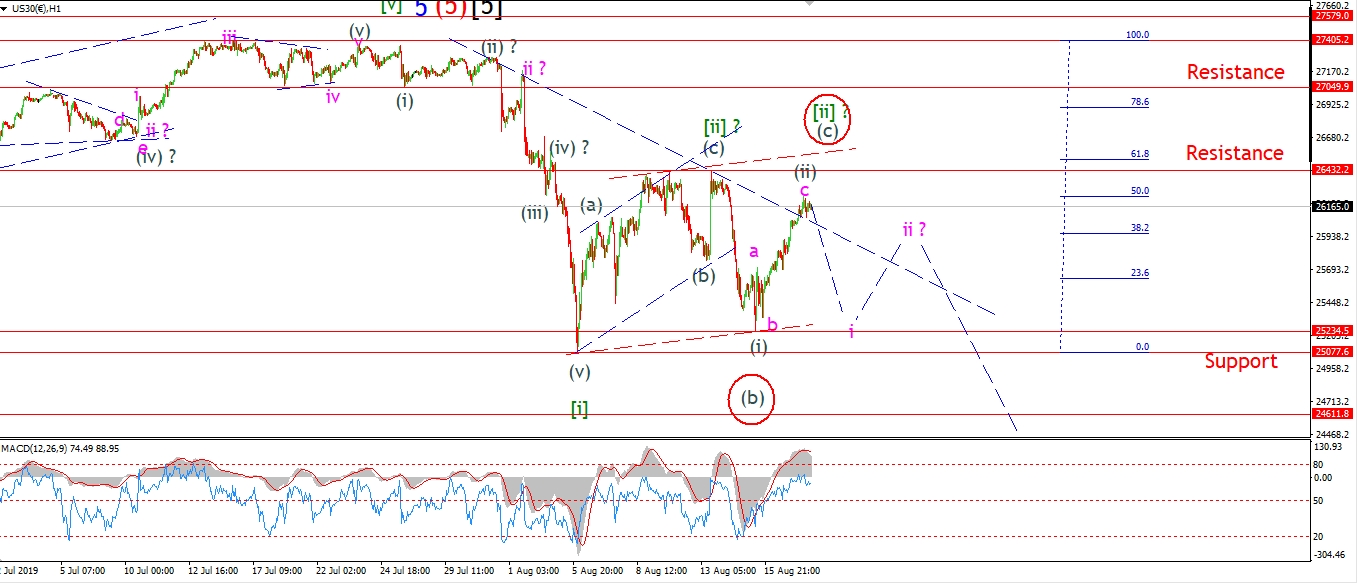 [/vc_column_text][/vc_column][vc_column width=”1/3″][vc_custom_heading text=”4 Hours” use_theme_fonts=”yes”][vc_column_text]
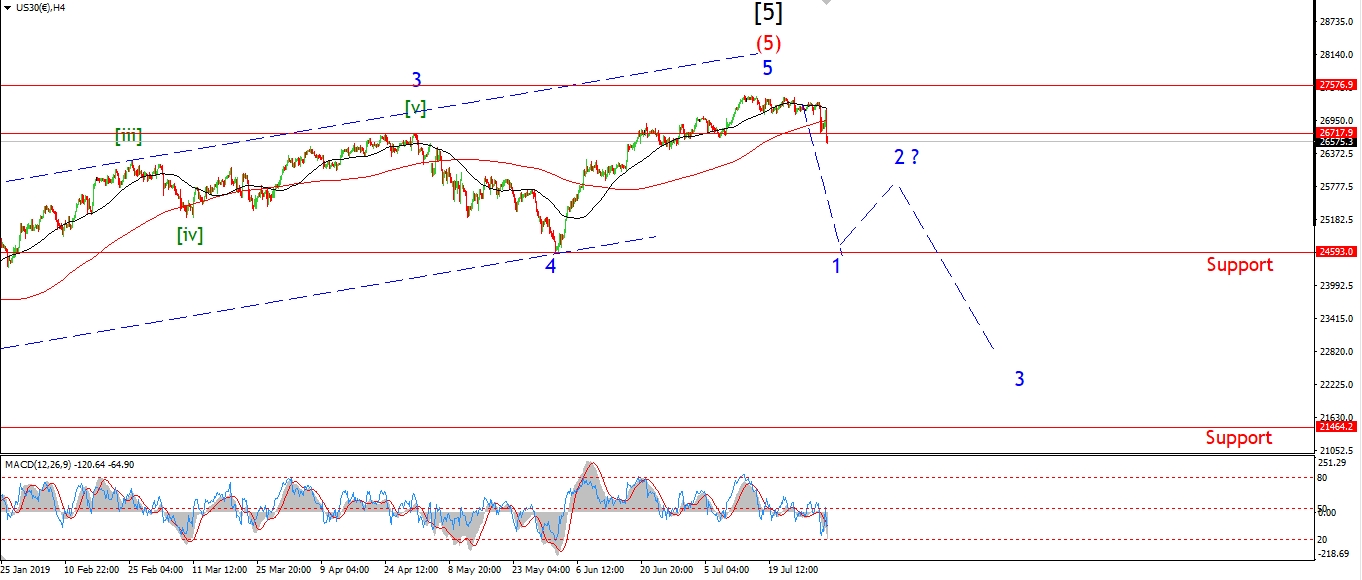 [/vc_column_text][vc_custom_heading text=”Daily” use_theme_fonts=”yes”][vc_column_text]
 [/vc_column_text][/vc_column][/vc_row]
[vc_row][vc_column][vc_column_text]
There are a few ways that we can read the recent corrective action to the upside.
I went over a couple of them in the weekend video.
Todays action has opened up another possibility,
and that is shown on the short term chart as the alternate count.
This involves an expanded flat wave (b),
and the rise off the low is wave (c) of [ii].
The high at 26430 should still offer some serious resistance to this larger wave [ii] pattern.
A break of that level in wave (c) would be very short lived going by that trend channel.
Tomorrow;
This rally will end as either wave ‘c’ of (ii),
or wave (c) of [ii].
Both wave counts are calling for a serious decline to begin this week.
Watch for wave ‘i’ of (iii) to begin tomorrow.
A break of 26430 will trigger that alternate count.
[/vc_column_text][/vc_column][/vc_row]
[vc_row][vc_column][vc_separator border_width=”5″][/vc_column][/vc_row][vc_row][vc_column][vc_column_text]
GOLD
[/vc_column_text][/vc_column][/vc_row][vc_row][vc_column][vc_separator border_width=”5″][/vc_column][/vc_row][vc_row][vc_column width=”2/3″][vc_custom_heading text=”1 hr” use_theme_fonts=”yes”][vc_column_text]
 [/vc_column_text][/vc_column][vc_column width=”1/3″][vc_custom_heading text=”4 Hours” use_theme_fonts=”yes”][vc_column_text]
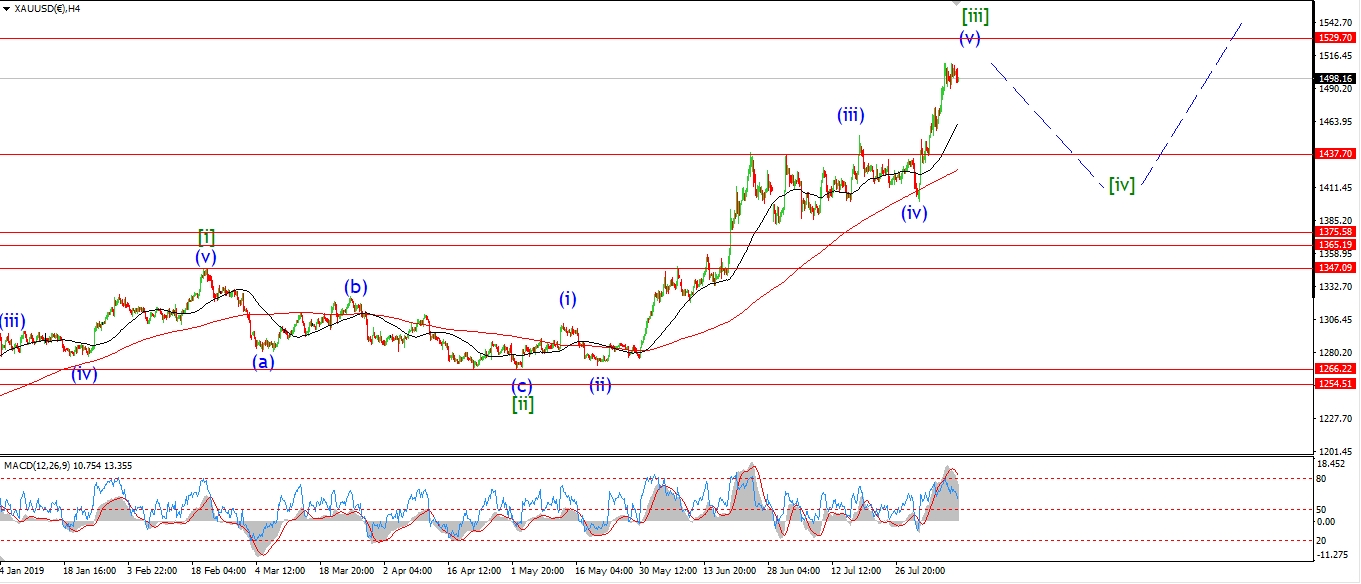 [/vc_column_text][vc_custom_heading text=”Daily” use_theme_fonts=”yes”][vc_column_text]
 [/vc_column_text][/vc_column][/vc_row]
[vc_row][vc_column][vc_column_text]
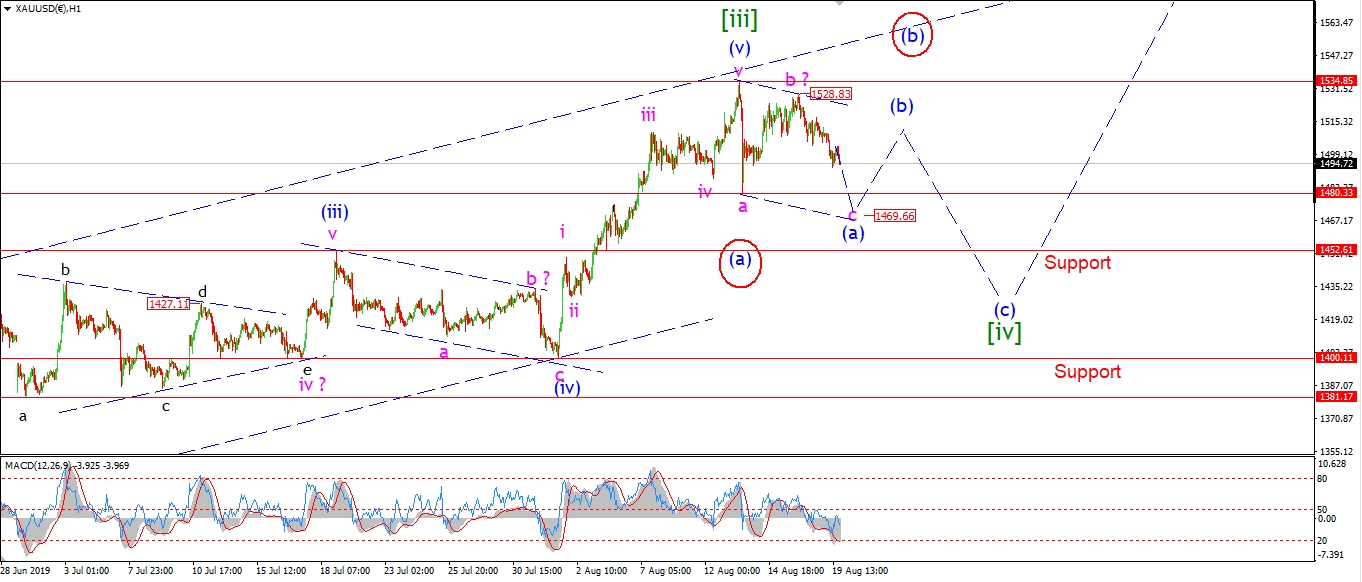
Gold is heading lower today off Fridays high.
The decline is inline with the current wave count,
but it has not ruled out the alternate wave (b) scenario either.
If the market rallies back above 1530 tomorrow,
that will trigger the alternate count shown circled in red.
A break of the initial support level at 1480 will rule out that alternate count.
Tomorrow;
Watch for wave ‘c’ of (a) to continue lower and hit 1470 to complete.
Watch for 1528 to hold at wave ‘b’.
[/vc_column_text][/vc_column][/vc_row]
[vc_row][vc_column][vc_separator border_width=”5″][/vc_column][/vc_row][vc_row][vc_column][vc_column_text]
U.S CRUDE OIL
[/vc_column_text][/vc_column][/vc_row][vc_row][vc_column][vc_separator border_width=”5″][/vc_column][/vc_row][vc_row][vc_column width=”2/3″][vc_custom_heading text=”1 hr” use_theme_fonts=”yes”][vc_column_text]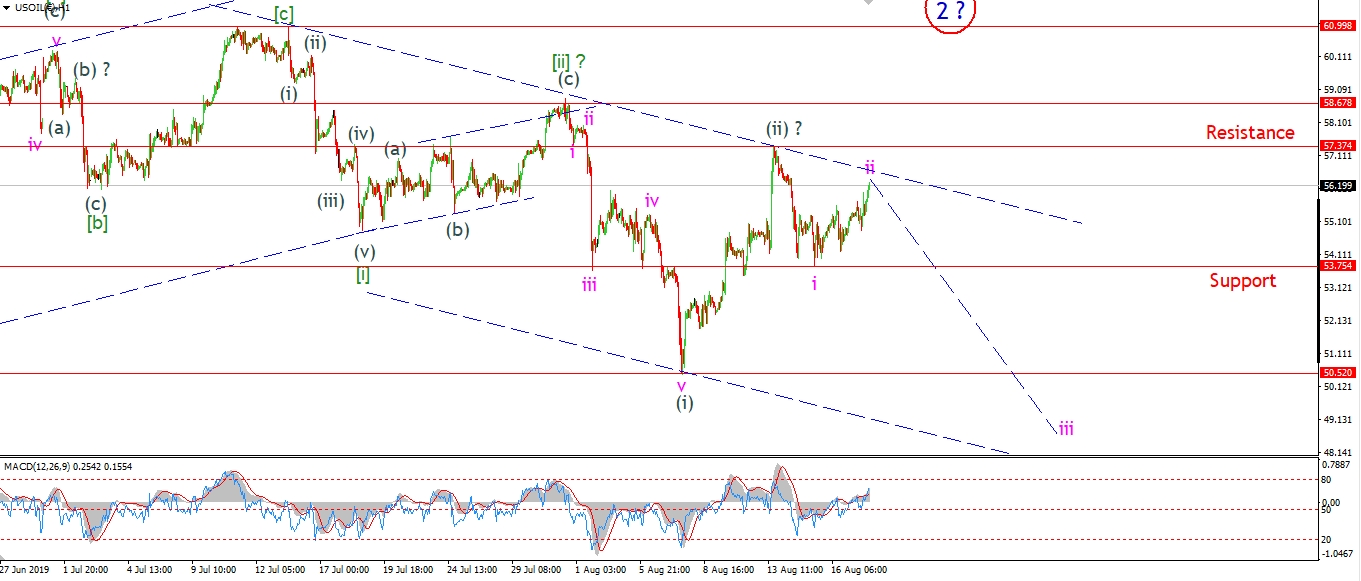 [/vc_column_text][/vc_column][vc_column width=”1/3″][vc_custom_heading text=”4 Hours” use_theme_fonts=”yes”][vc_column_text]
 [/vc_column_text][vc_custom_heading text=”Daily” use_theme_fonts=”yes”][vc_column_text]
 [/vc_column_text][/vc_column][/vc_row]
[vc_row][vc_column][vc_column_text]
The rally in crude is still viewed as corrective to the upside in a possible wave ‘ii’ of (iii).
The current short term count is very bearish indeed,
with a decline in wave ‘iii’ of (iii) dead ahead.
If the market turns lower tomorrow and breaks 53.75,
that will signal that wave ‘iii’ down has begun.
And then we are in real danger of seeing a very large acceleration lower this week.
Tomorrow;
So far the rise off wave ‘i’ pink is still in three waves,
this suggests a correction higher in wave ‘ii’ pink.
Watch for watch for wave ‘ii’ to complete below 57.37,
and turn lower again.
[/vc_column_text][/vc_column][/vc_row]
[vc_row][vc_column][vc_separator border_width=”5″][/vc_column][/vc_row][vc_row][vc_column][vc_column_text]
US 10 yr Treasuries.
[/vc_column_text][/vc_column][/vc_row][vc_row][vc_column][vc_separator border_width=”5″][/vc_column][/vc_row][vc_row][vc_column width=”2/3″][vc_custom_heading text=”1 hr” use_theme_fonts=”yes”][vc_column_text]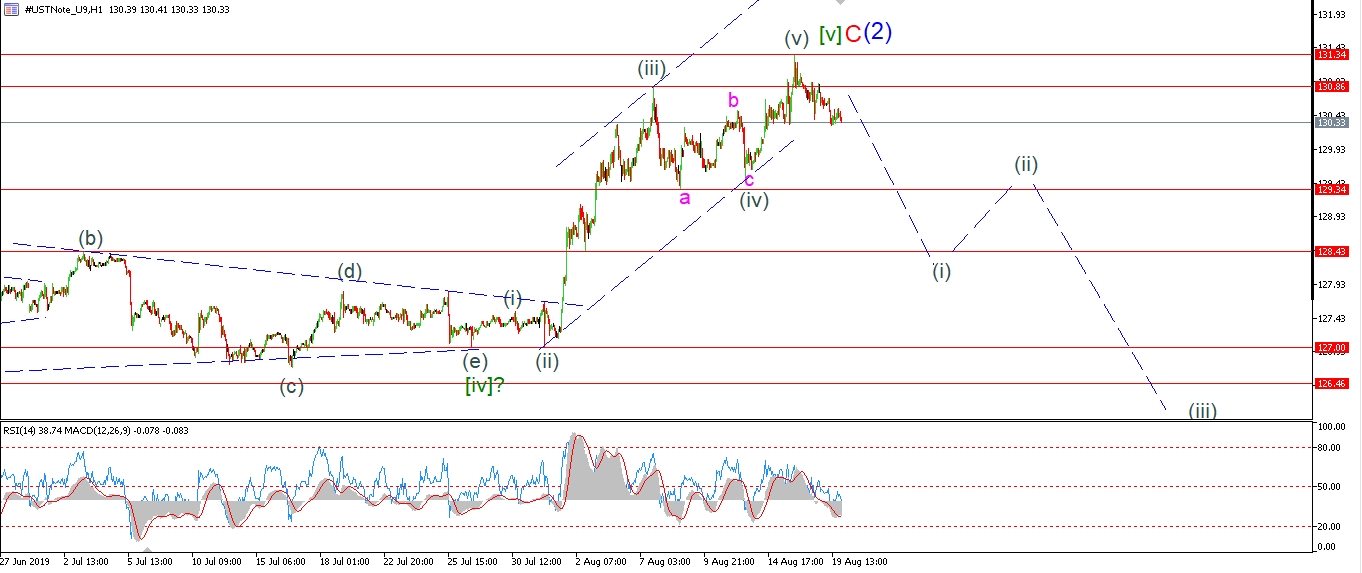 [/vc_column_text][/vc_column][vc_column width=”1/3″][vc_custom_heading text=”4 Hours” use_theme_fonts=”yes”][vc_column_text]
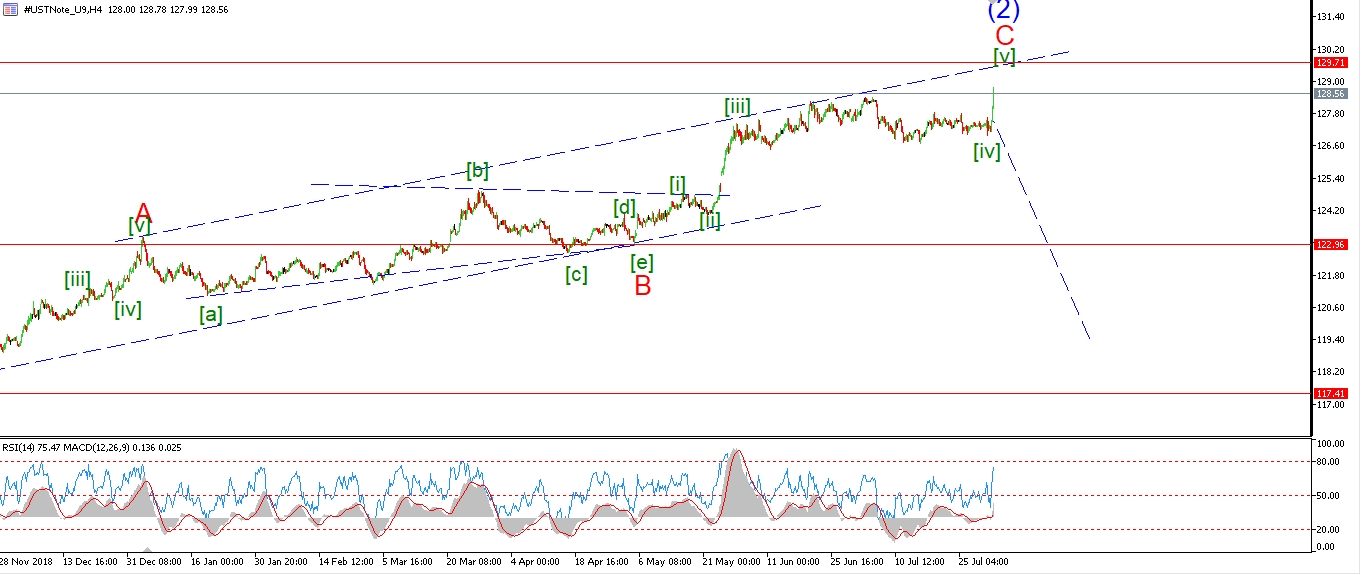 [/vc_column_text][vc_custom_heading text=”Daily” use_theme_fonts=”yes”][vc_column_text]
 [/vc_column_text][/vc_column][/vc_row]
[vc_row][vc_column][vc_column_text]
The price continued lower today for bonds,
but we will need to see much more downside to confirm that wave (i) is underway.
Initial support lies at 129.34,
a break of this level will favor the bearish count
as is should rule out any further extension higher in wave [v] green.
Tomorrow;
Watch for the downside to dominate this week as wave (i) take hold.
Price must hold below 131.34 now and head lower again tomorrow.
[/vc_column_text][/vc_column][/vc_row]
[vc_row][vc_column][vc_separator border_width=”5″][/vc_column][/vc_row][vc_row][vc_column][vc_column_text]
SILVER
[/vc_column_text][/vc_column][/vc_row][vc_row][vc_column][vc_separator border_width=”5″][/vc_column][/vc_row][vc_row][vc_column width=”2/3″][vc_custom_heading text=”1 hr” use_theme_fonts=”yes”][vc_column_text]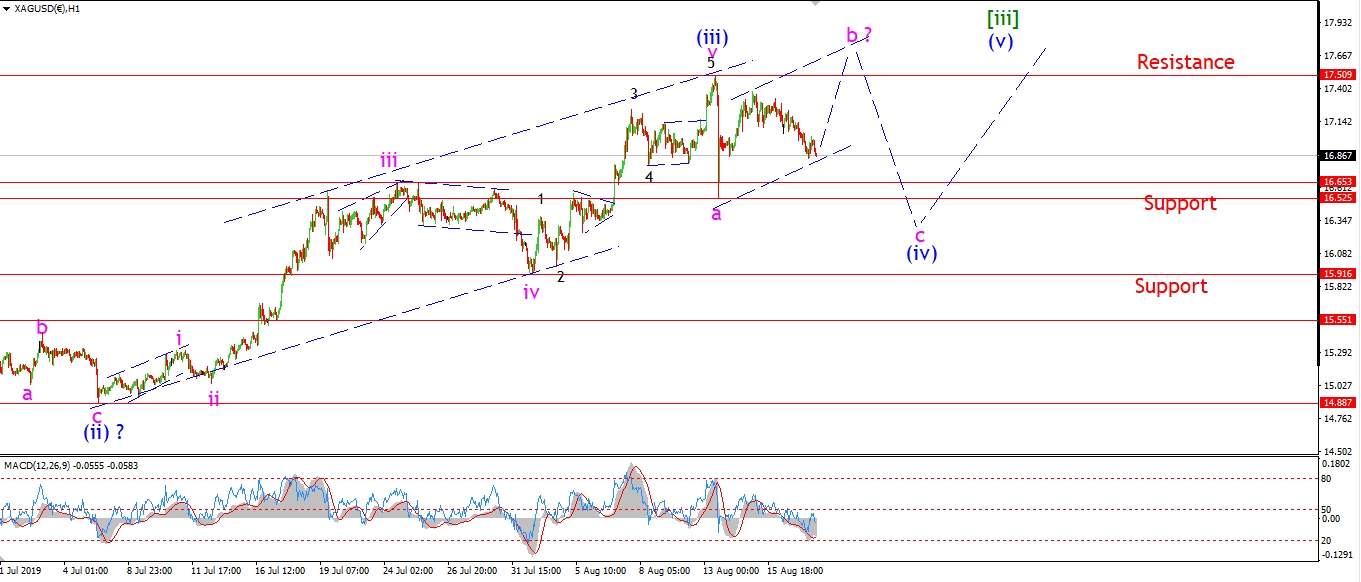 [/vc_column_text][/vc_column][vc_column width=”1/3″][vc_custom_heading text=”4 Hours” use_theme_fonts=”yes”][vc_column_text]
 [/vc_column_text][vc_custom_heading text=”Daily” use_theme_fonts=”yes”][vc_column_text]
 [/vc_column_text][/vc_column][/vc_row]
[vc_row][vc_column][vc_column_text]
Wave ‘b’ of (iv) is still in force this evening,
although it is hard to tell what pattern wave ‘b’ is tracing out at the moment.
It is possible that wave ‘b’ will form a triangle also,
in this case the price will drift sideways for much of the week.
And then wave ‘c’ of (iv) will drop lower next week.
This is the joy of corrections,
never knowing quite what is happening, and always kept on your toes!
Tomorrow;
Watch for wave ‘b’ to continue.
The price range tomorrow should lean in favor of a particular pattern for wave ‘b’.
[/vc_column_text][/vc_column][/vc_row]
[vc_row][vc_column][vc_separator border_width=”5″][/vc_column][/vc_row][vc_row][vc_column][vc_column_text]
S&P 500.
[/vc_column_text][/vc_column][/vc_row][vc_row][vc_column][vc_separator border_width=”5″][/vc_column][/vc_row][vc_row][vc_column width=”2/3″][vc_custom_heading text=”1 hr” use_theme_fonts=”yes”][vc_column_text]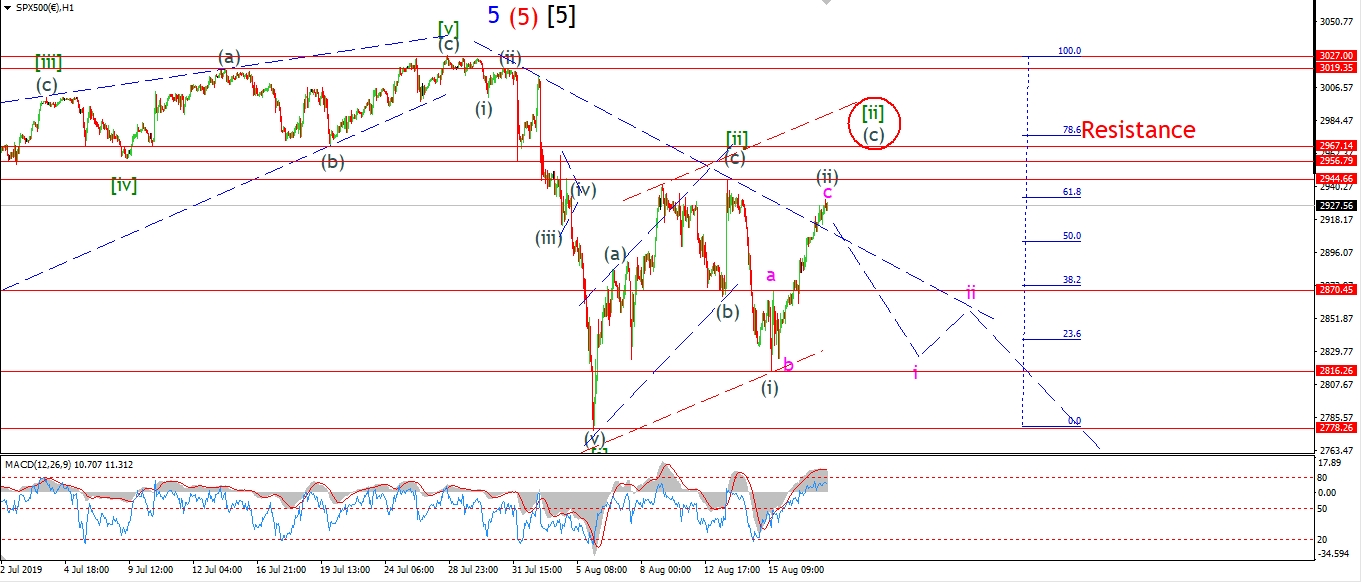 [/vc_column_text][/vc_column][vc_column width=”1/3″][vc_custom_heading text=”4 Hours” use_theme_fonts=”yes”][vc_column_text]
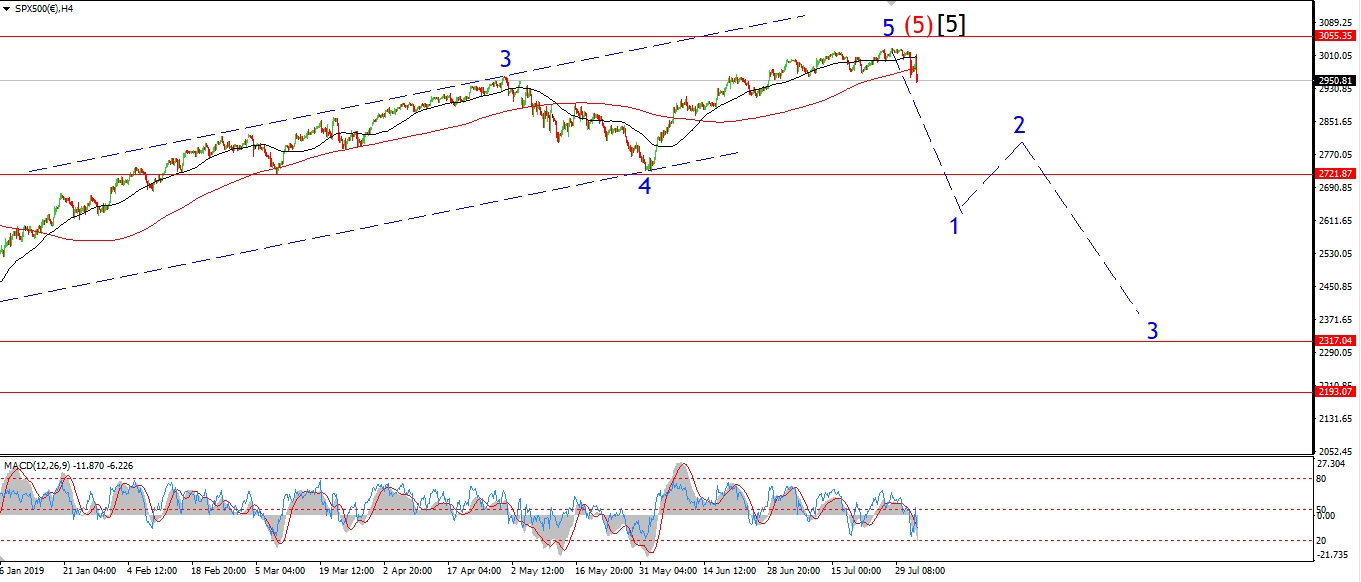 [/vc_column_text][vc_custom_heading text=”Daily” use_theme_fonts=”yes”][vc_column_text]
 [/vc_column_text][/vc_column][/vc_row]
[vc_row][vc_column][vc_column_text]
I have shown a similar alternate count in the S&P this evening.
The rally off the recent low has broken above the declining trend channel line today,
so this opens up the possibility that wave [ii] is still in force
and tracing out a larger pattern as shown.
A break of 2944 will trigger this interpretation.
But even this alternate wave count has major bearish implications in the short term.
And we should see that play very soon.
The larger wave [iii] is expected to take hold this week.
And that wave should carry the market far lower relatively quick.
Tomorrow;
Watch for the high at 2944 to hold and wave (iii) down begin with a push back below 2870.
[/vc_column_text][/vc_column][/vc_row]
[vc_row][vc_column][vc_separator border_width=”5″][/vc_column][/vc_row]