
Good evening folks, the Lord’s Blessings to you all.
The economic Reality is actually plain to see if you wish to look, but so far no one is willing to look.
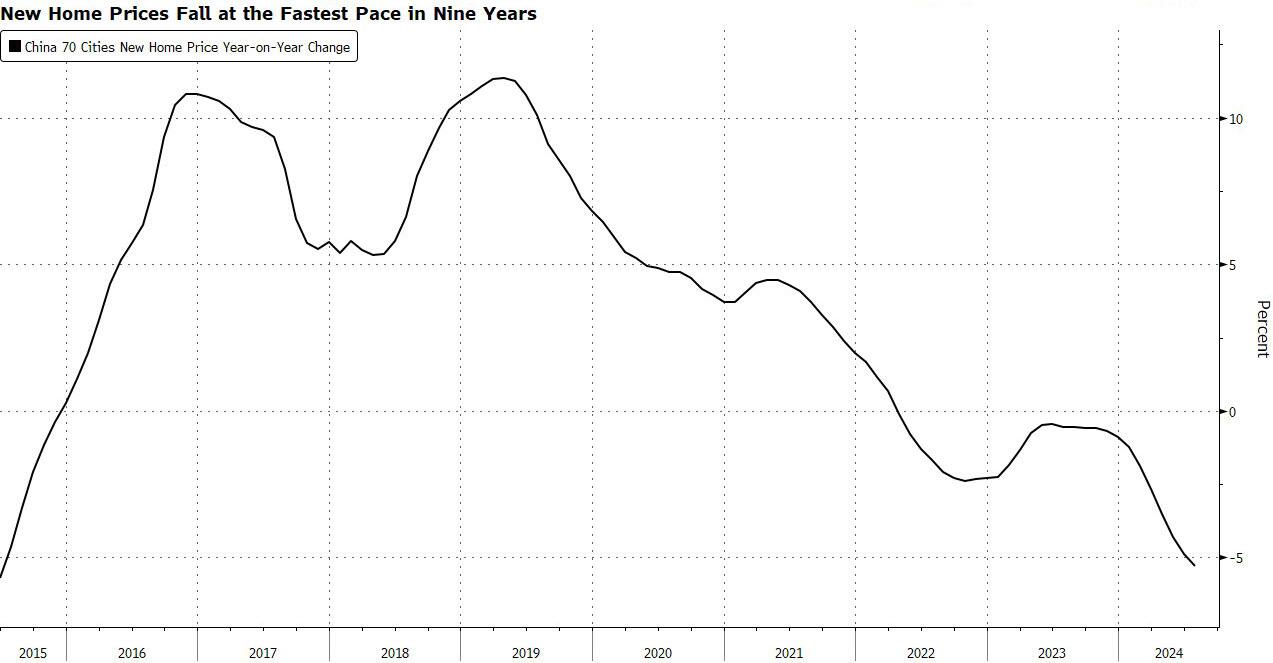
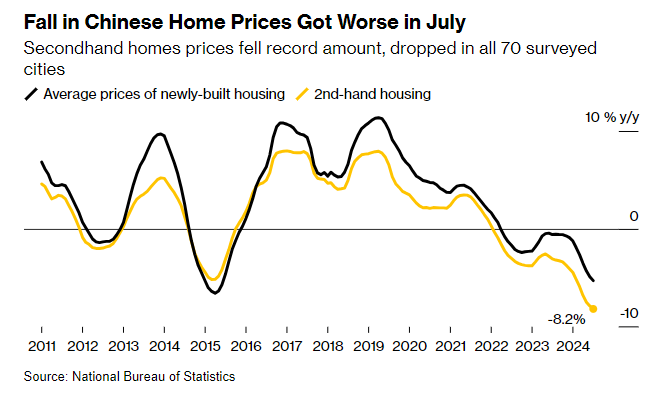
China Home Prices Just Plunged The Most Since 2015
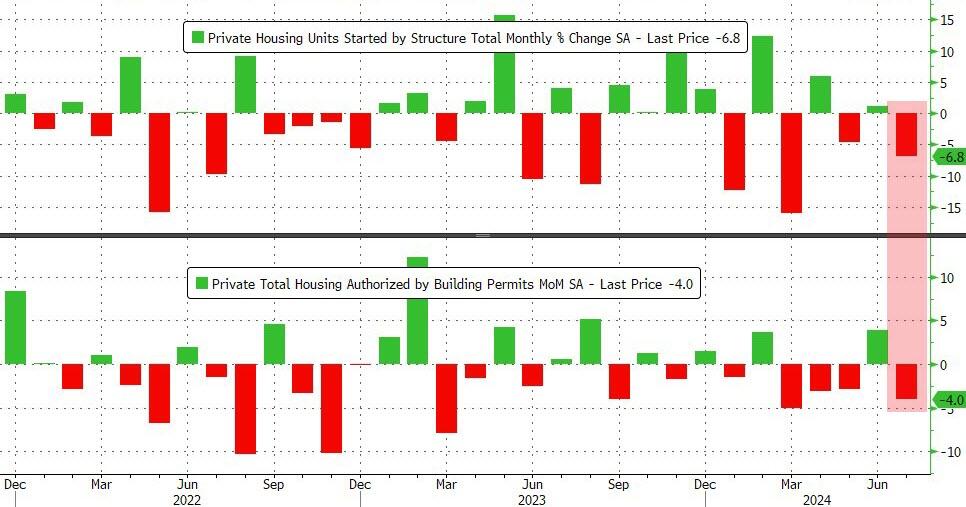
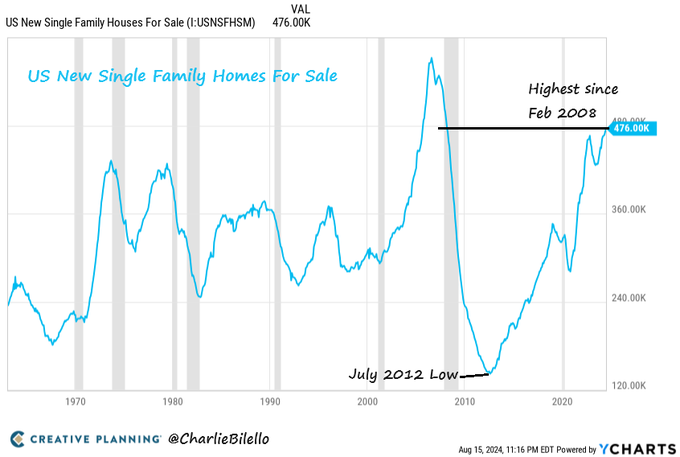
Housing Starts & Building Permits Plunged To COVID Lows In July
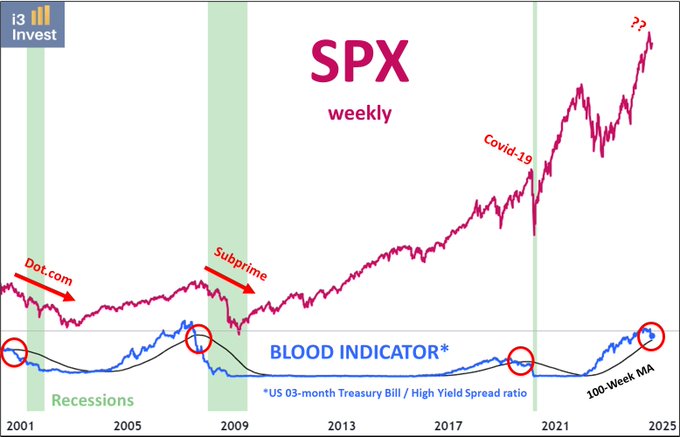
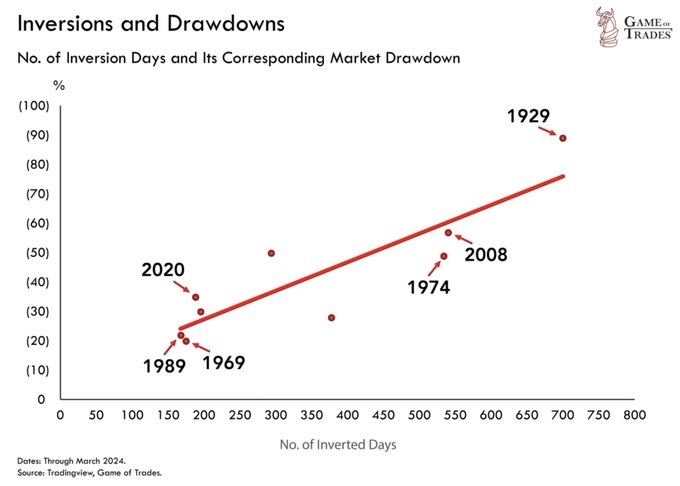
History tells us it’s about to get ugly More inversion days = deeper drawdown We’re already at +750 days This ONLY occurred in 1929
https://twitter.com/bullwavesreal
EURUSD.
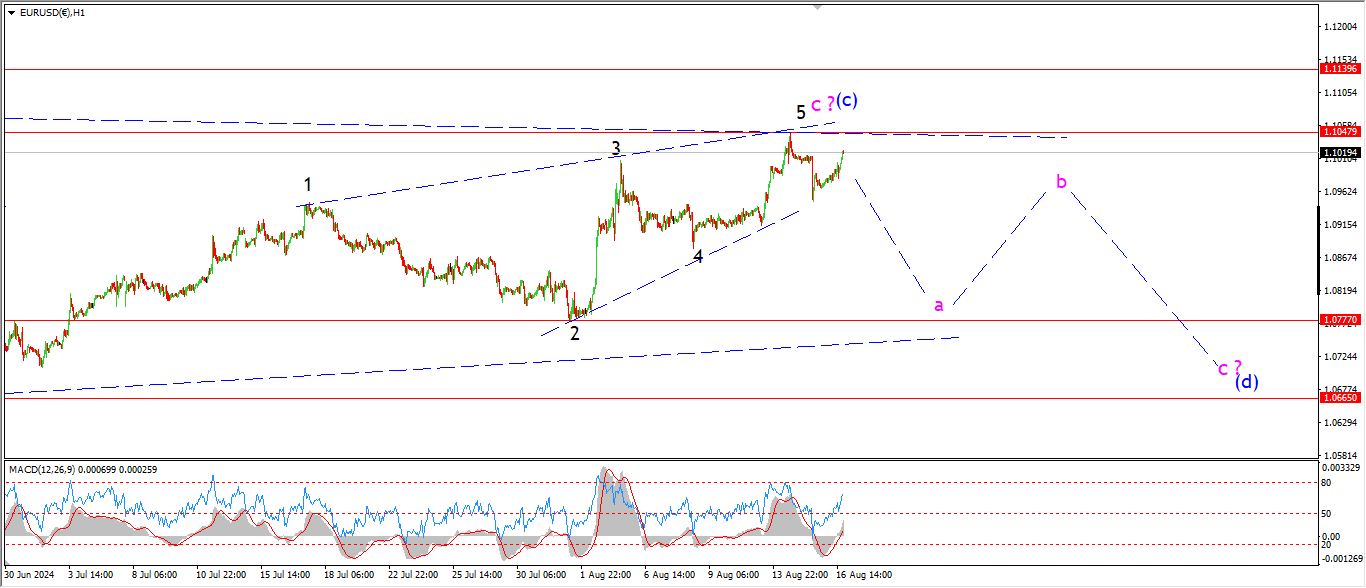
EURUSD 1hr.
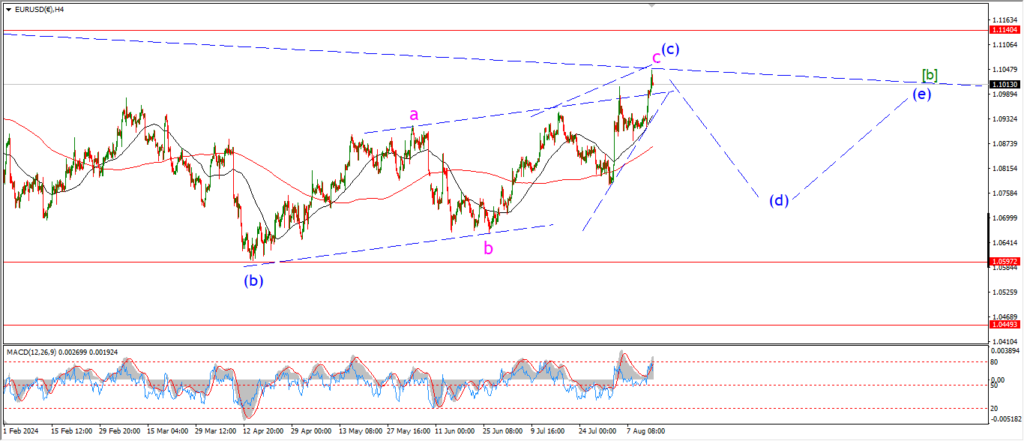
EURUSD 4hr.
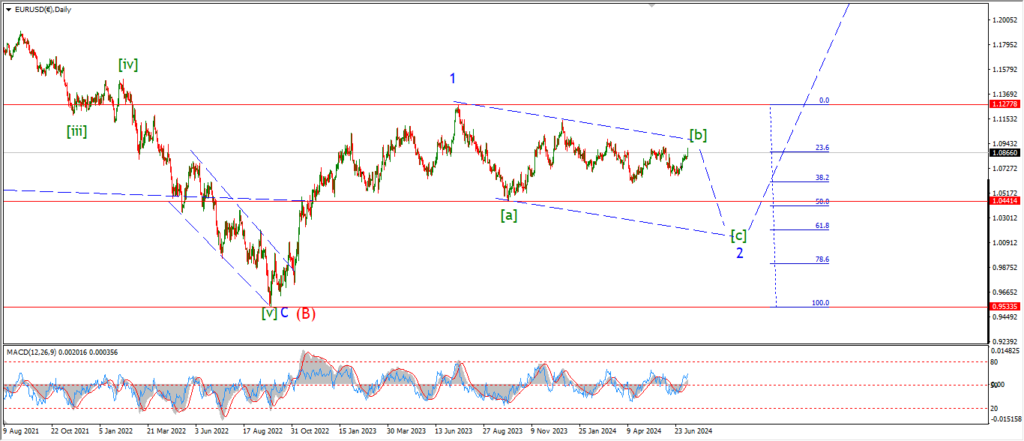
EURUSD daily.
EURUSD is building a small lower high off the wave (c) top today but again there is no confirmation of wave (d) yet.
Next week it will be imperative that this pair turns down in a significant manner to confirm the count.
This triangle pattern in wave [b] will remain valid as long as the price holds below 1.1140 at wave (a).
So there is room to move here,
but I don’t want to see another test of that wave (a) high.
Tomorrow;
Watch for wave ‘a’ to continue lower in three waves with support at the 1.0777 level.
wave (c) should hold at 1.1048.
GBPUSD
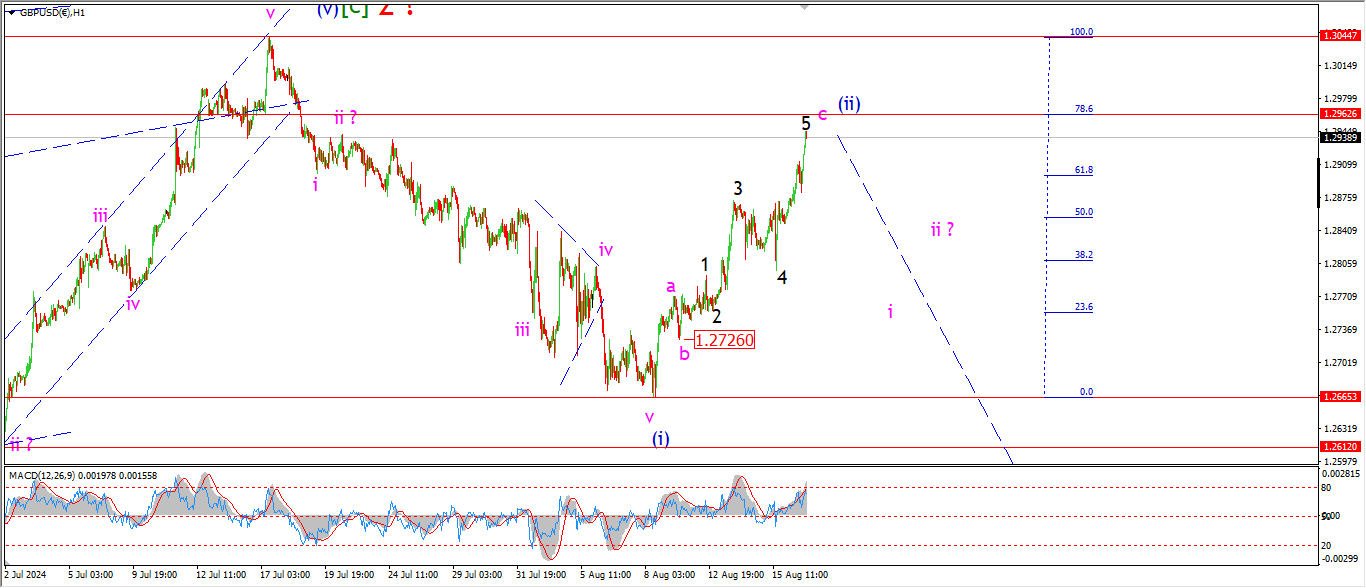
GBPUSD 1hr.
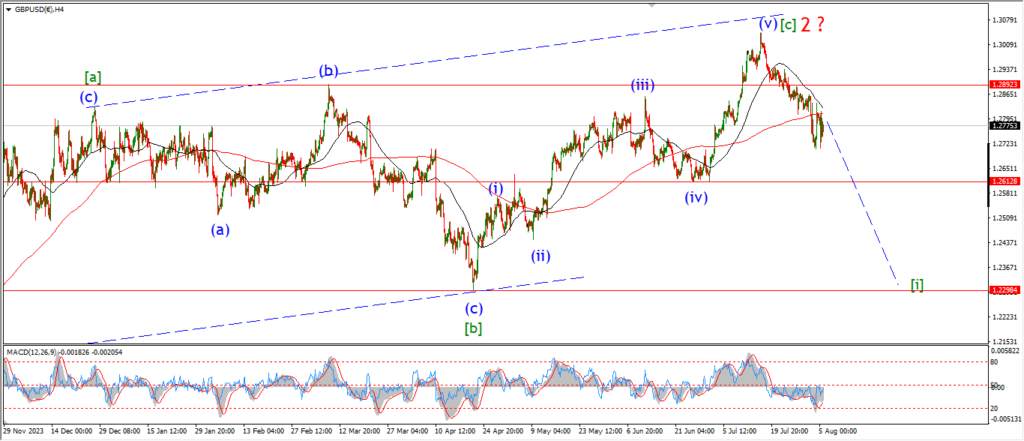
GBPUSD 4hr.
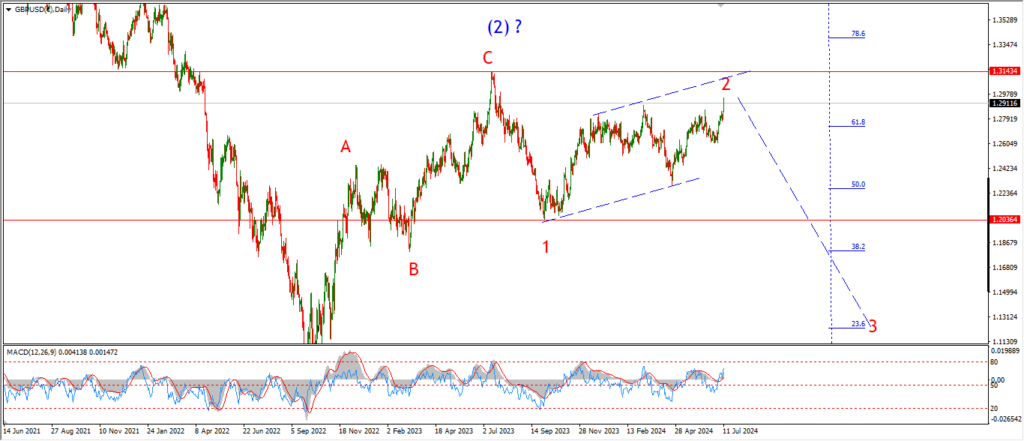
GBPUSD daily.
Wave ‘c’ continues to push higher today and the price is now within reach of the 78.6% retracement level at 1.2963.
The pattern is quite extended in wave ‘c’ now,
so it is critical now that this rally in wave (ii) will top out and wave ‘i’ of (iii) must begin.
Monday;
Wave ‘c’ of (ii) has traced out five waves up now,
and even wave ‘5’ of ‘c’ has completed a five wave pattern.
this is more than enough to close out this correction and turn lower into wave (iii).
USDJPY.
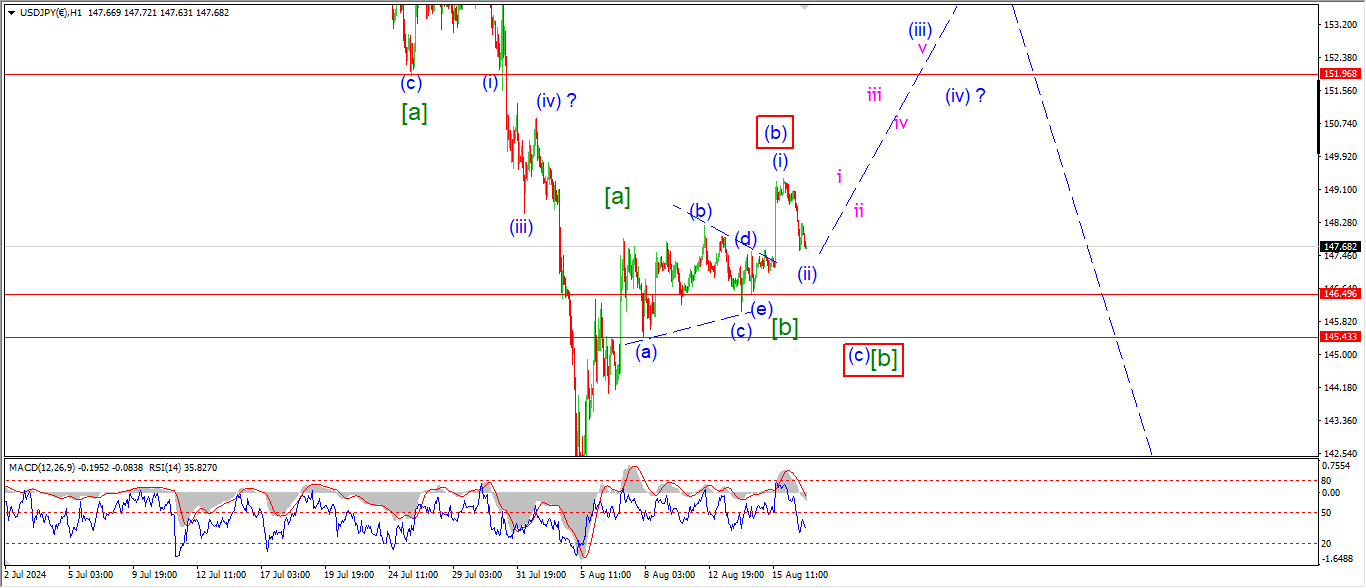
USDJPY 1hr.
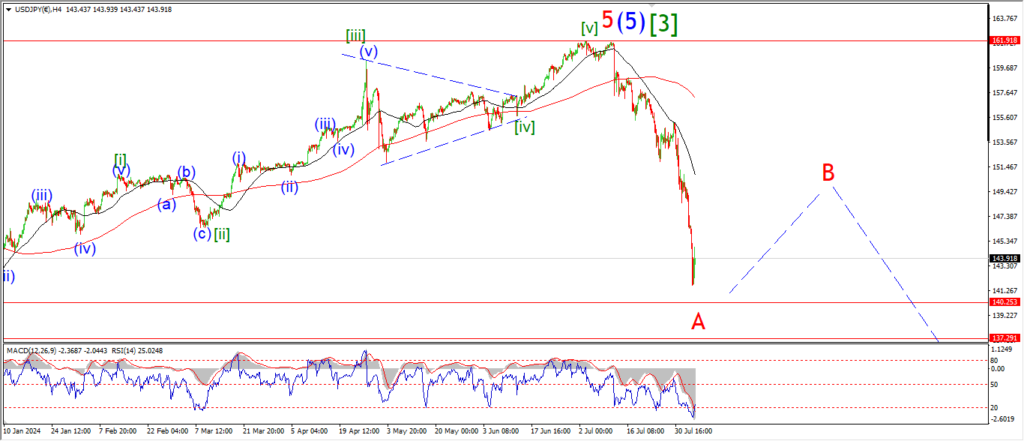
USDJPY 4hr.
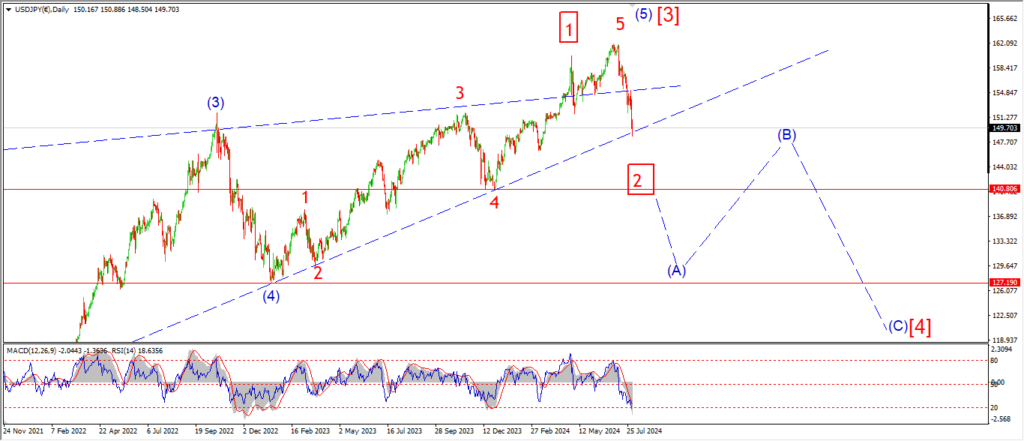
USDJPY daily.
The rally in wave (i) of [c] came to an abrupt end overnight and now we have a decline into wave (ii) of [c].
Wave (ii) must complete above 146.50.
and then turn higher early next week into wave (iii) of [c].
The alternate count for wave [b] is shown also.
this involves an expanded flat pattern rather than a triangle.
A break of 146.50 will trigger that idea.
Monday;
watch for wave [b] to hold,
wave (iii) of [c] must turn higher again as shown.
DOW JONES.
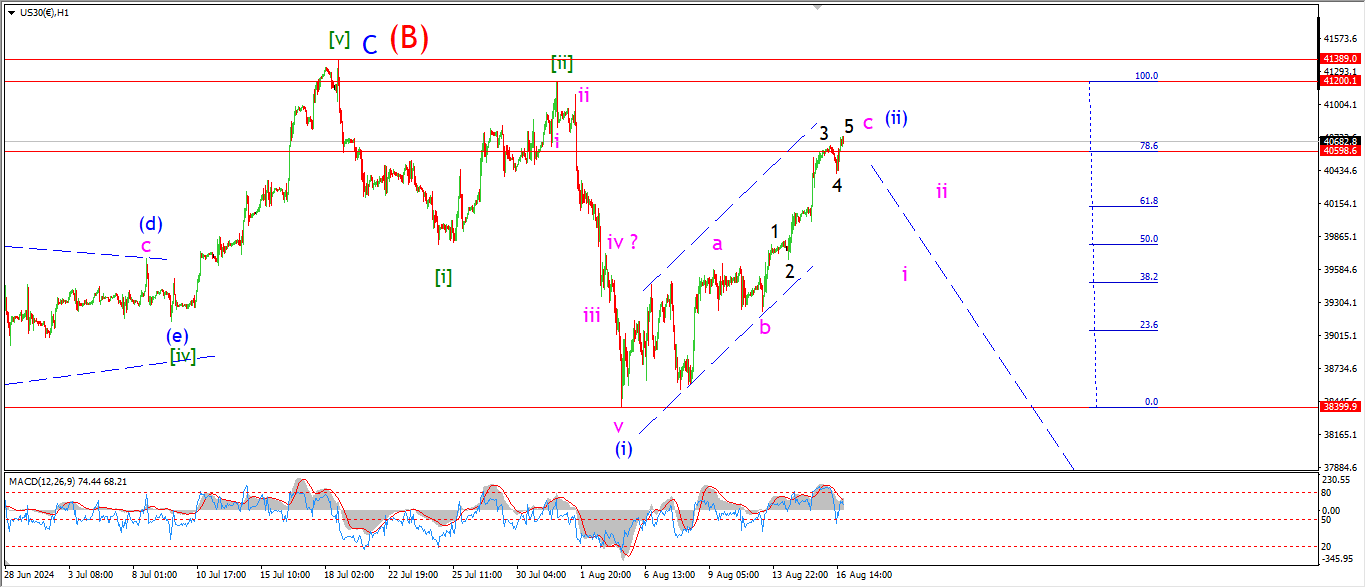
DOW 1hr.
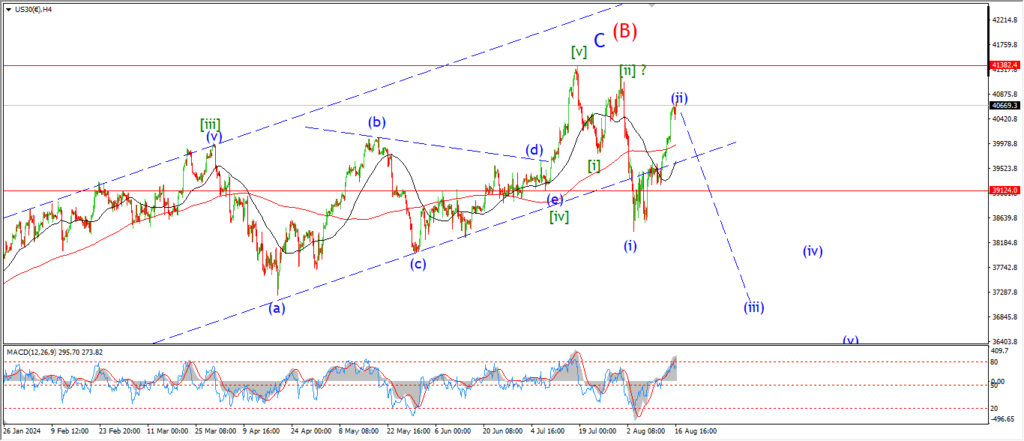
DOW 4hr
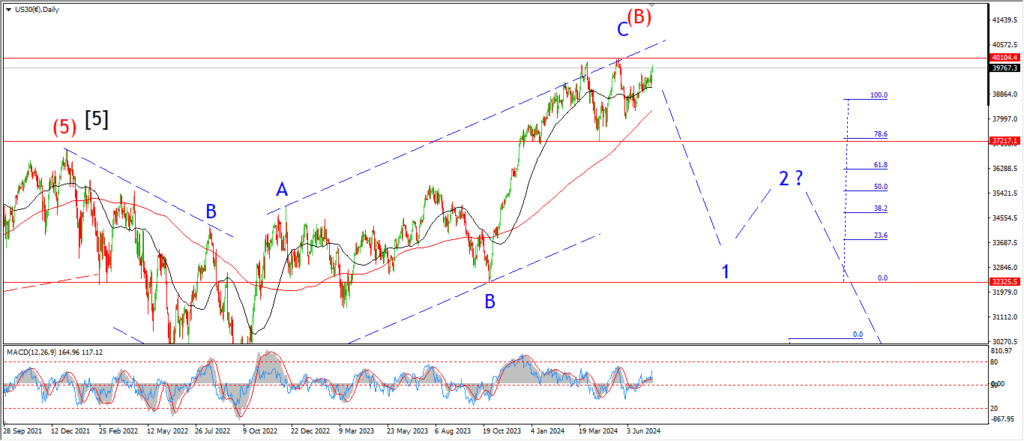
DOW daily.
Wave ‘c’ of (ii) is labelled slightly different this evening.
I am showing an extension in wave ‘3’ of ‘c’,
and a smaller waves ‘4’ and ‘5’ to complete wave ‘c’ this evening.
the market is delusional of course,
and that simply means people are in full denial of all contradicting evidence to the bullish story.
So,
this market is as likely to rally on to a new high,
as it is likely to completely collapse into a third wave down.
I cannot rule either scenario out.
Delusion will only last so long when the floor falls out from underneath you.
Monday;
Watch for this wave (ii) correction to stop and reverse into wave ‘i’ of (iii).
GOLD
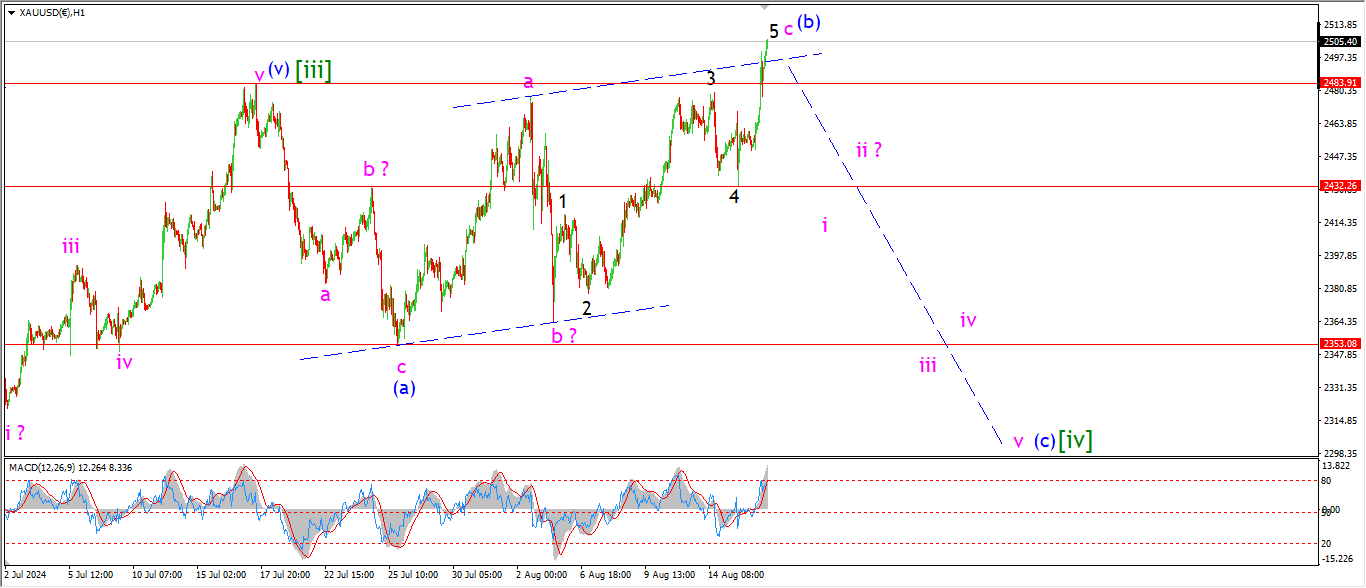
GOLD 1hr.
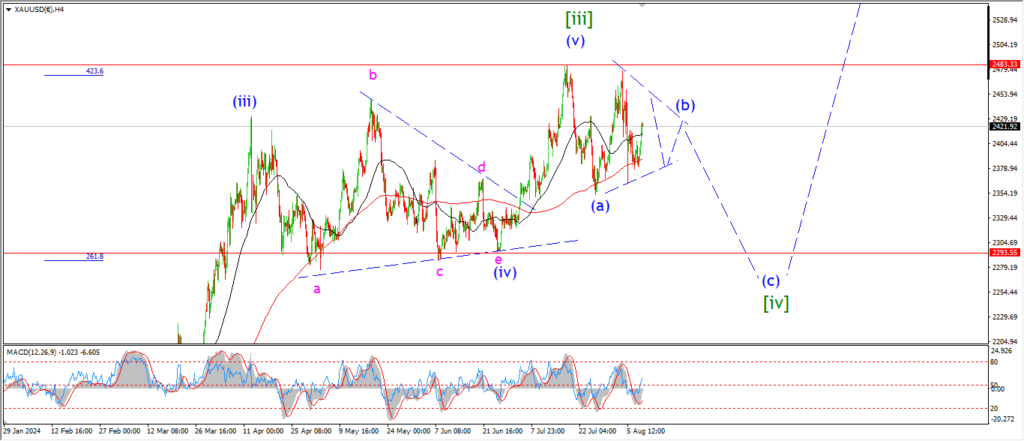
GOLD 4hr.
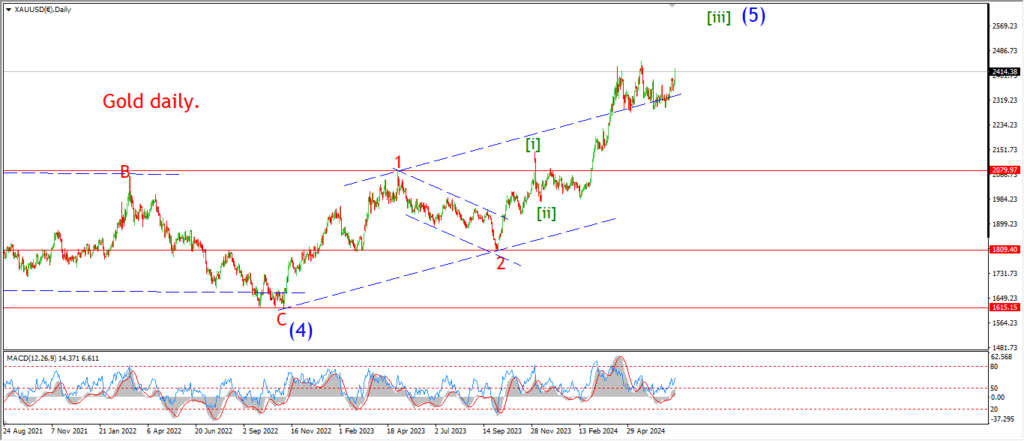
GOLD daily.
It is extension everywhere today as Gold reaches out above the upper trend channel line in wave ‘c’ of (b).
This changes nothing in the larger pattern.
An expanded flat with a throw over in wave (b) is what we are looking at.
Wave (c) will retrace all of this recent rally and we may even see a break of the 2300 level when this is done.
wave (b) has gone on for long enough,
wave (c) will begin early next week.
Monday;
watch for wave ‘i’ of (c) to fall back below 2432 at the wave ‘4’ low to confirm wave (c) is underway.
CRUDE OIL.
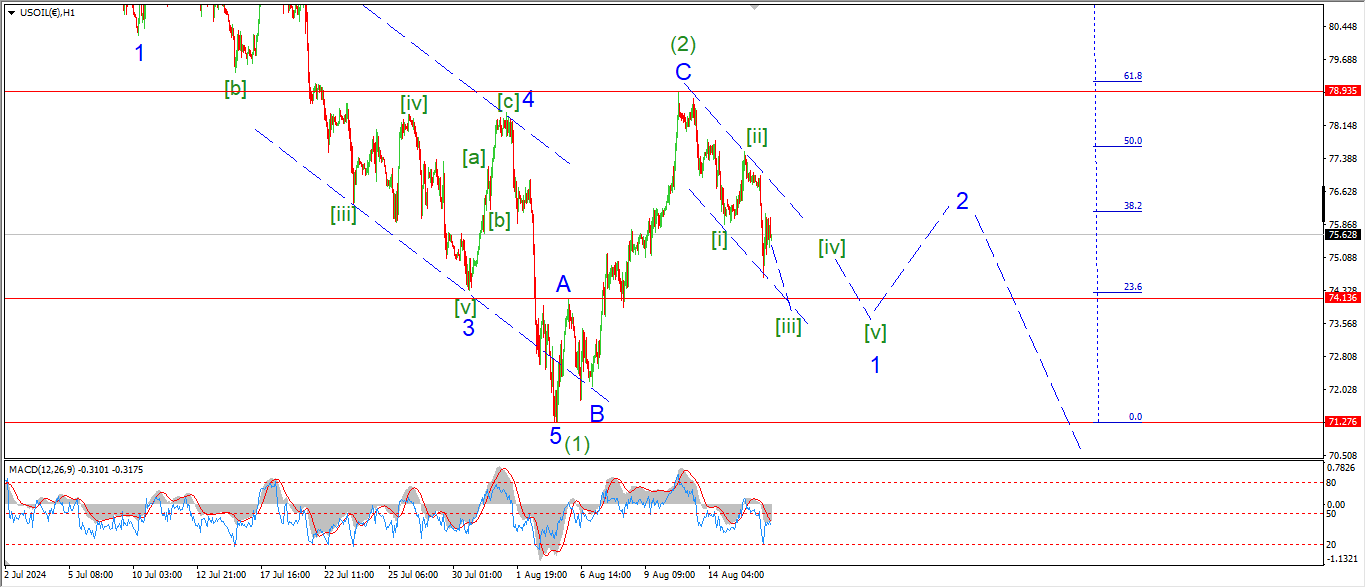
CRUDE OIL 1hr.
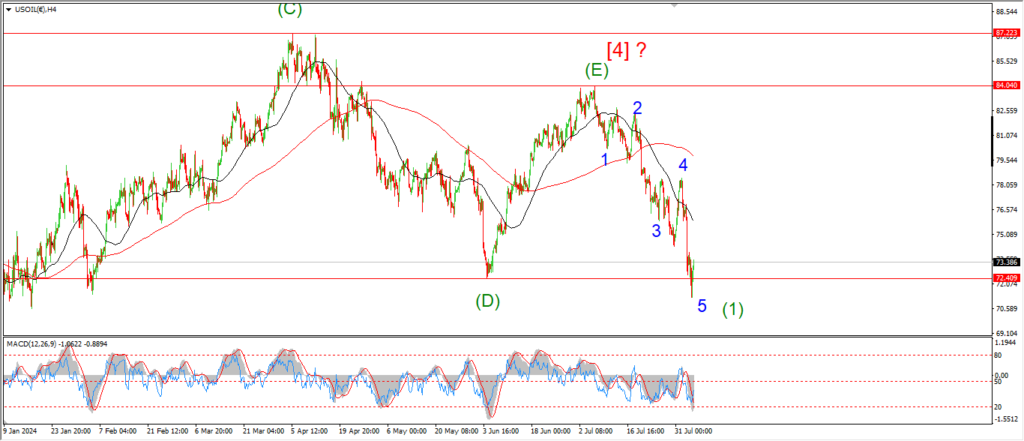
CRUDE OIL 4hr.
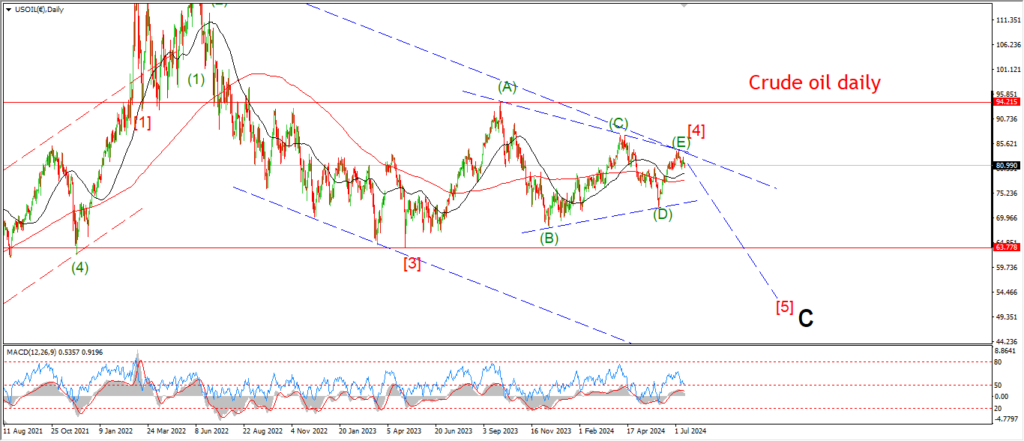
CRUDE OIL daily.
A further drop in crude today suggests wave [iii] of ‘1’ is underway.
Wave [iii] does not have a completed internal pattern yet though,
so I suspect we will see a drop into support at 74.13 to complete that pattern.
So far there is a three wave decline in place off the wave (2) high and we need more downside to confirm the turn into wave (3) next week.
Monday;
Watch for wave ‘1’ to complete a five wave pattern lower somewhere near 73.00.
S&P 500.
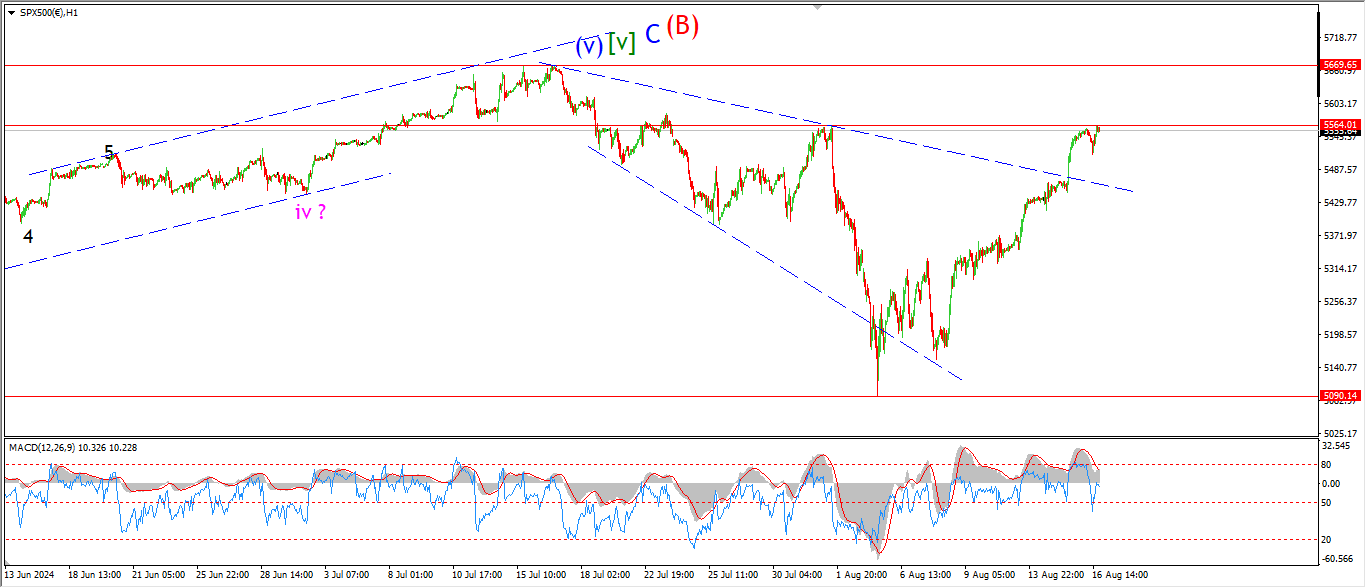
S&P 500 1hr
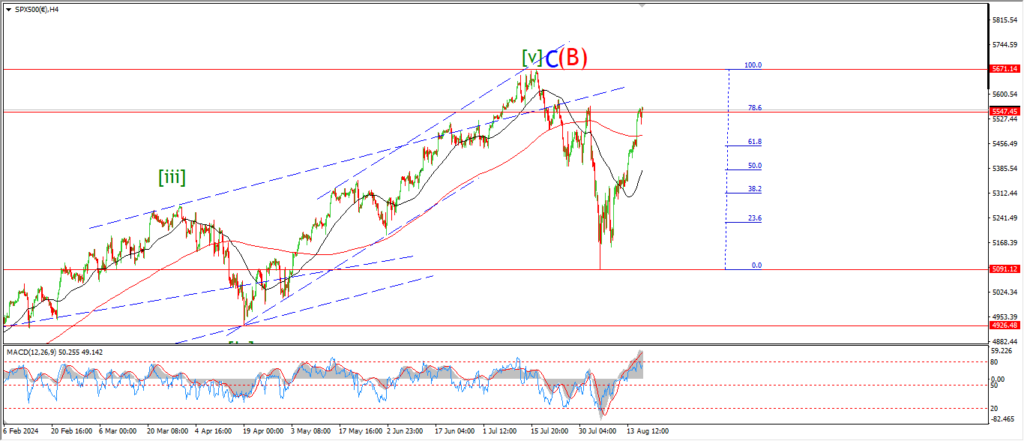
S&P 500 4hr
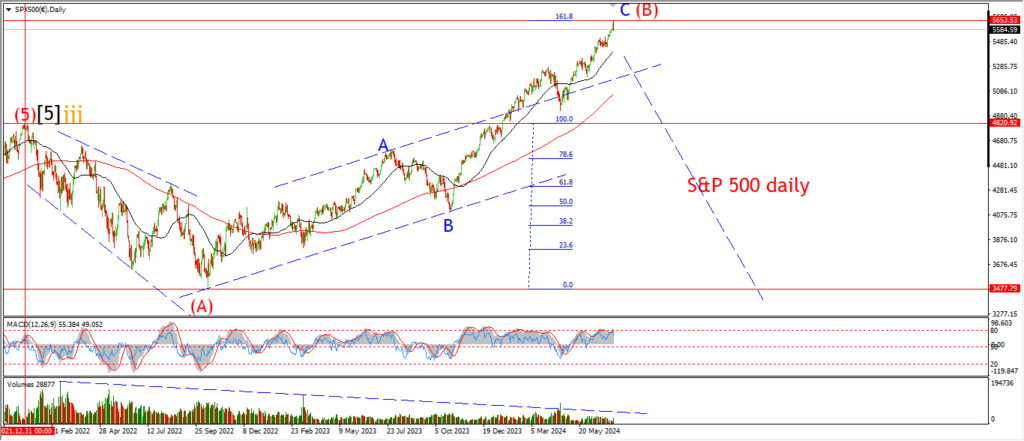
S&P 500 daily.
Take a look at the 4hr chart to begin with.
The recent rally has retraced the full acceleration lower from two weeks ago.
This happens to be a 78.6% retracement of the decline off the all time highs.
And if you look at the momentum indicator at the bottom of the chart you will see a massive extreme now in place which suggests this rally is done.
At the moment I am favoring the corrective rally scenario over a new bullish run.
I can be proved wrong next week of course.
But the extreme nature of this rally is unnatural in my eyes!
Next week will tell a whole lot.
Monday;
WAtch for signs of a top on Monday.
the potential for a sharp drop is present given the extended state of this rally.
SILVER.
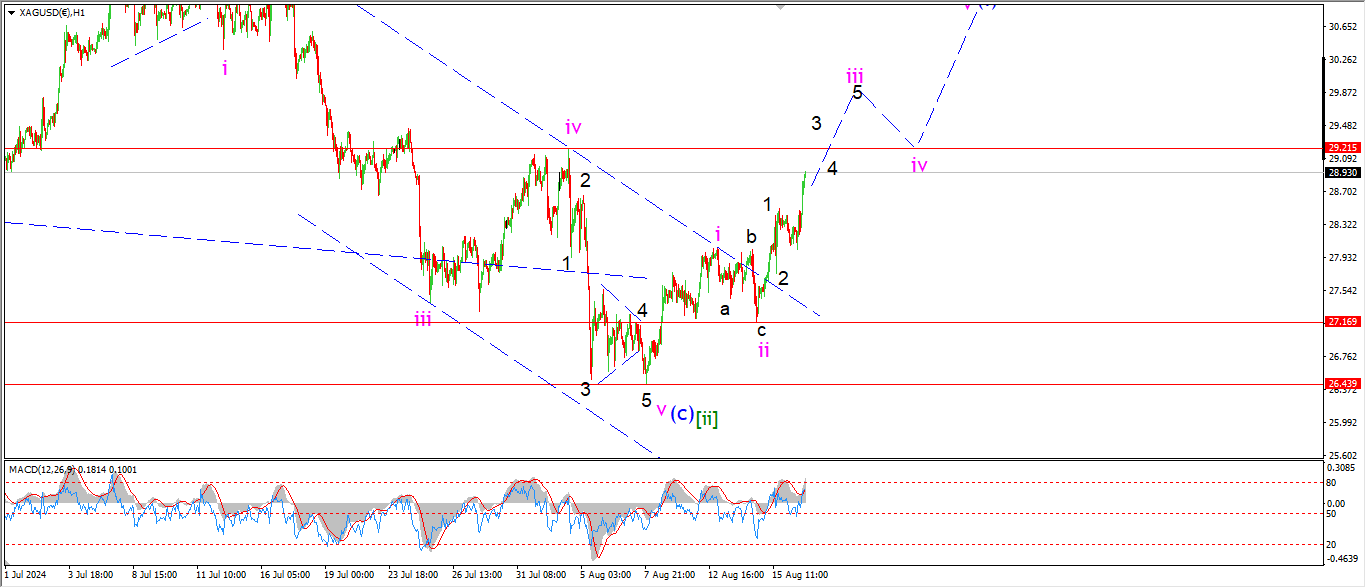
SILVER 1hr
SILVER 4hr.
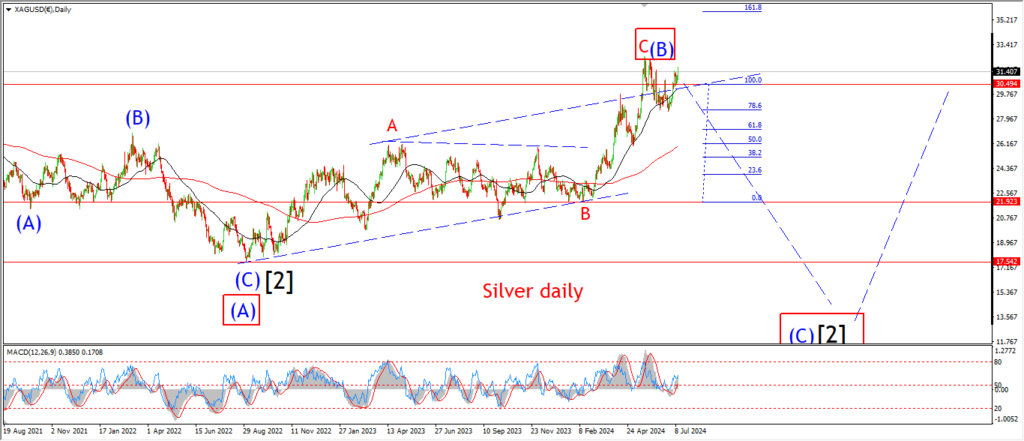
SILVER daily.
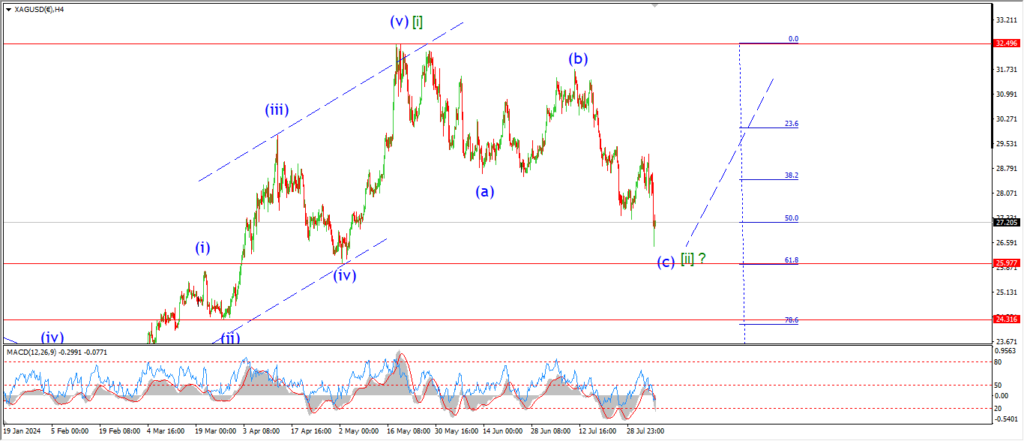
another pop today in silver is pushing towards the resistance at 29.21 at wave ‘iv’.
The action is still in line with the wave ‘iii’ idea here,
and the price should break above the wave ‘iv’ high to complete wave ‘iii’,
and then wave ‘iv’ should correct lower and use the same level as support as wave (i) continues to build next week.
Monday;
Watch for wave ‘iii’ of (i) to complete five waves up and break above resistance at 29.21.
BITCOIN
BITCOIN 1hr.

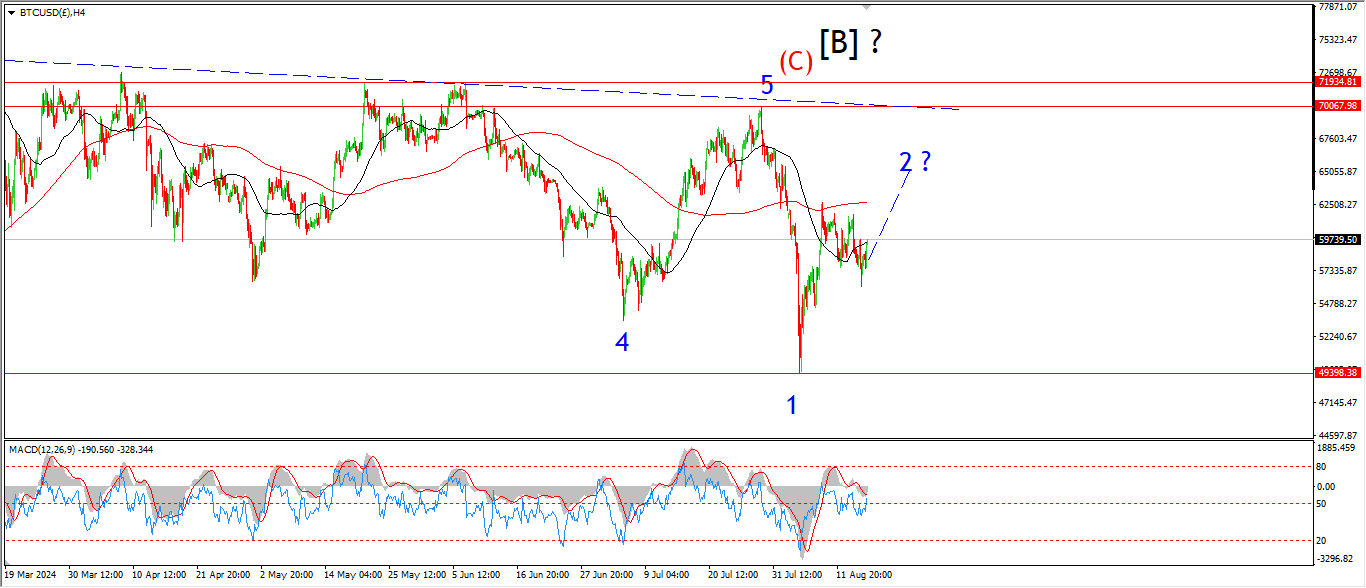
BITCOIN 4hr.
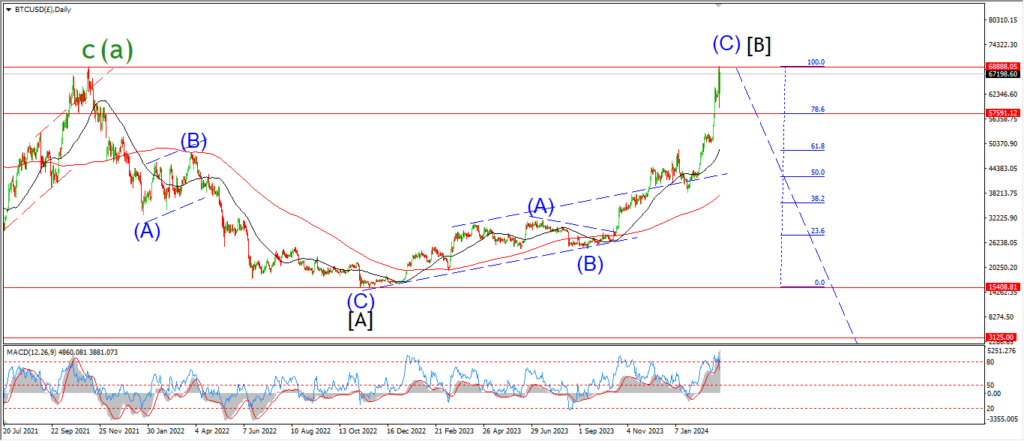
BITCOIN daily.
….
FTSE 100.
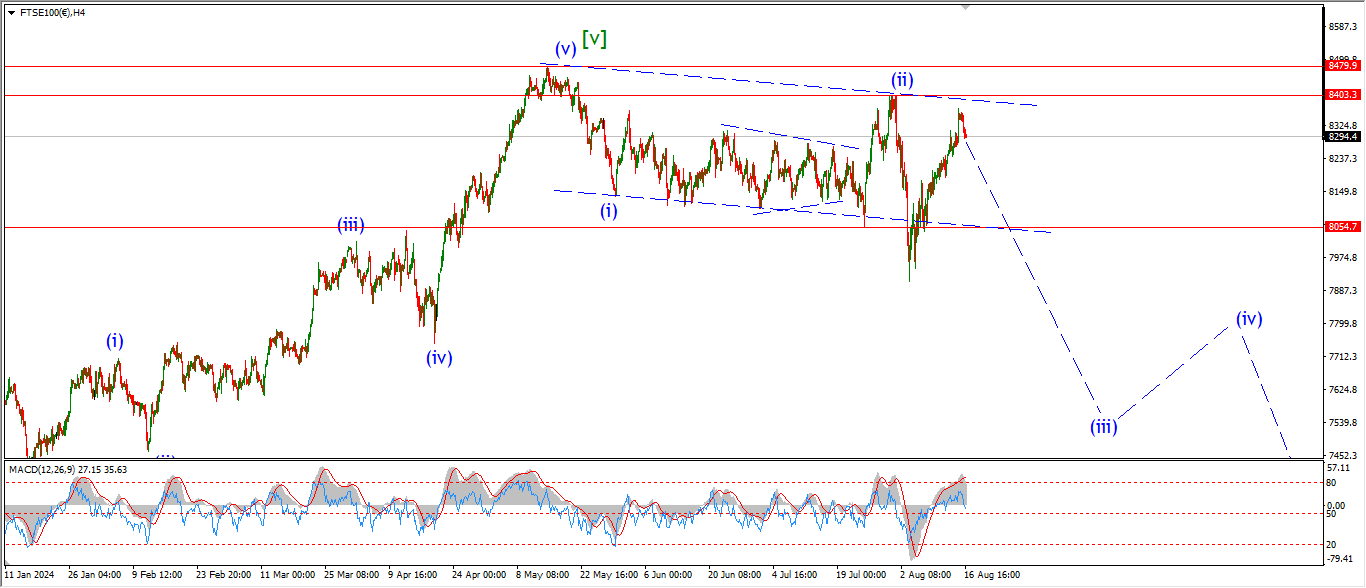
FTSE 100 1hr.

FTSE 100 4hr.

FTSE 100 daily.
….
DAX.
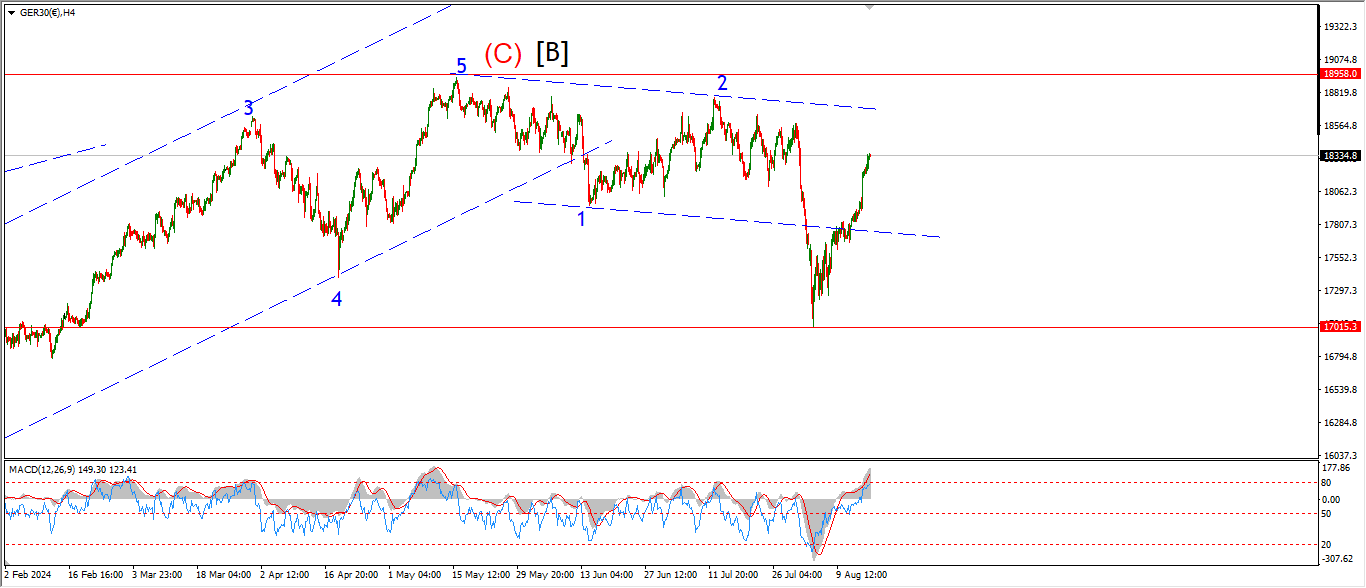
DAX 1hr
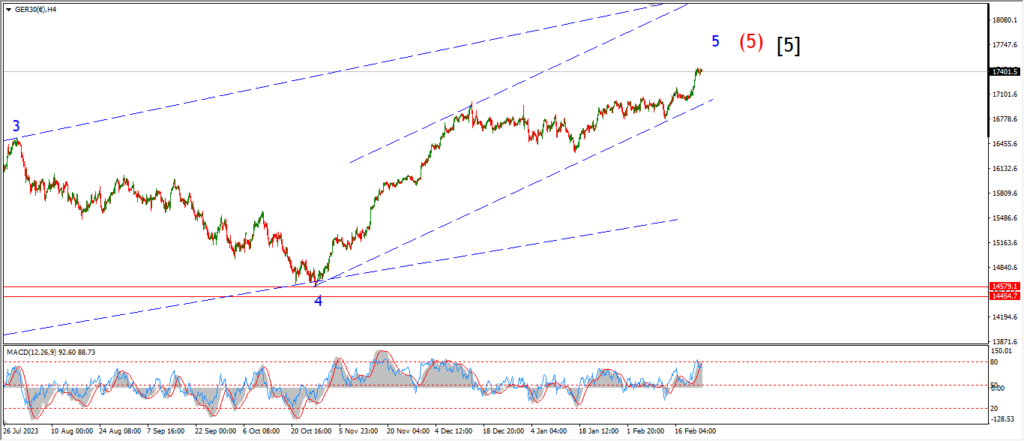
DAX 4hr

DAX daily.
….
NASDAQ 100.
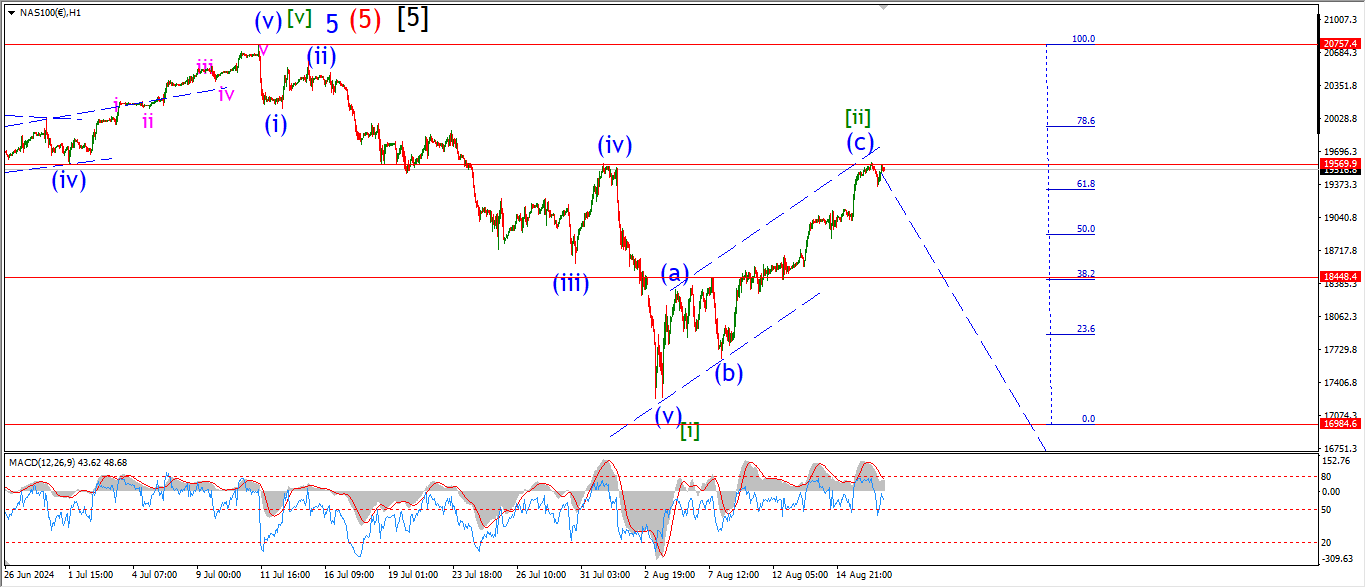
NASDAQ 1hr
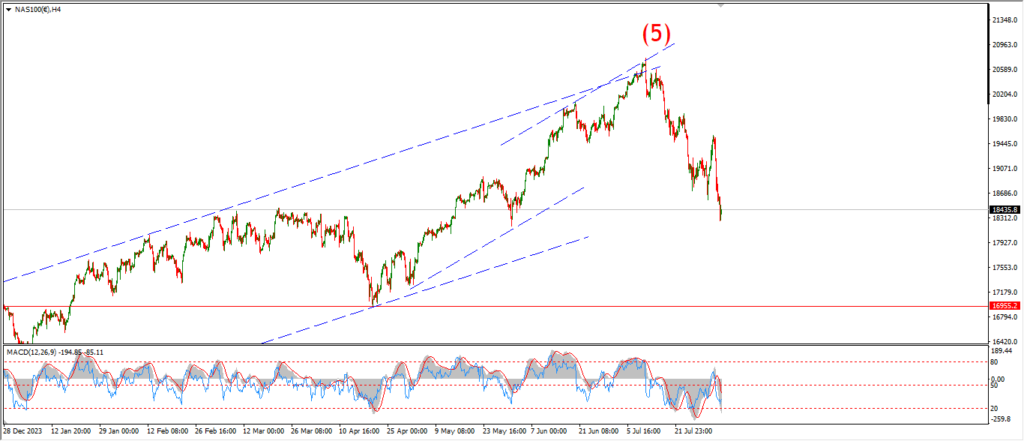
NASDAQ 4hr.
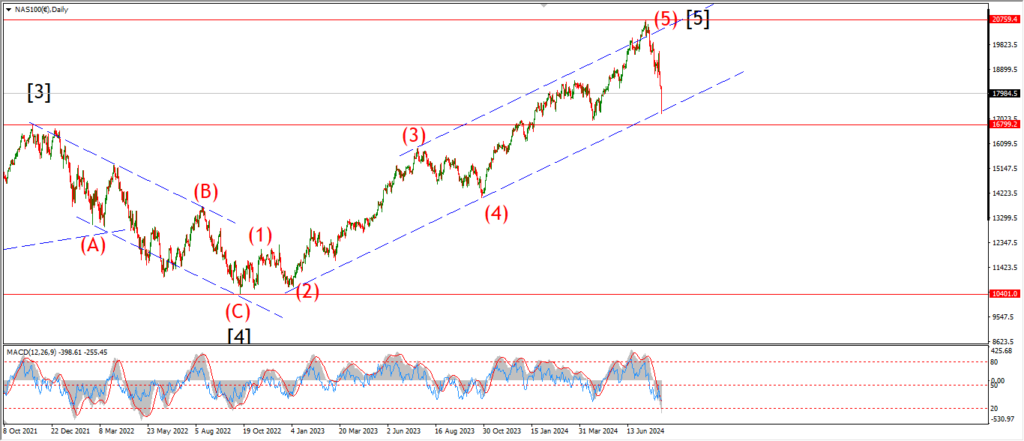
NASDAQ daily.
….