
Good evening folks, the Lord’s Blessings to you all.
https://twitter.com/bullwavesreal
EURUSD.
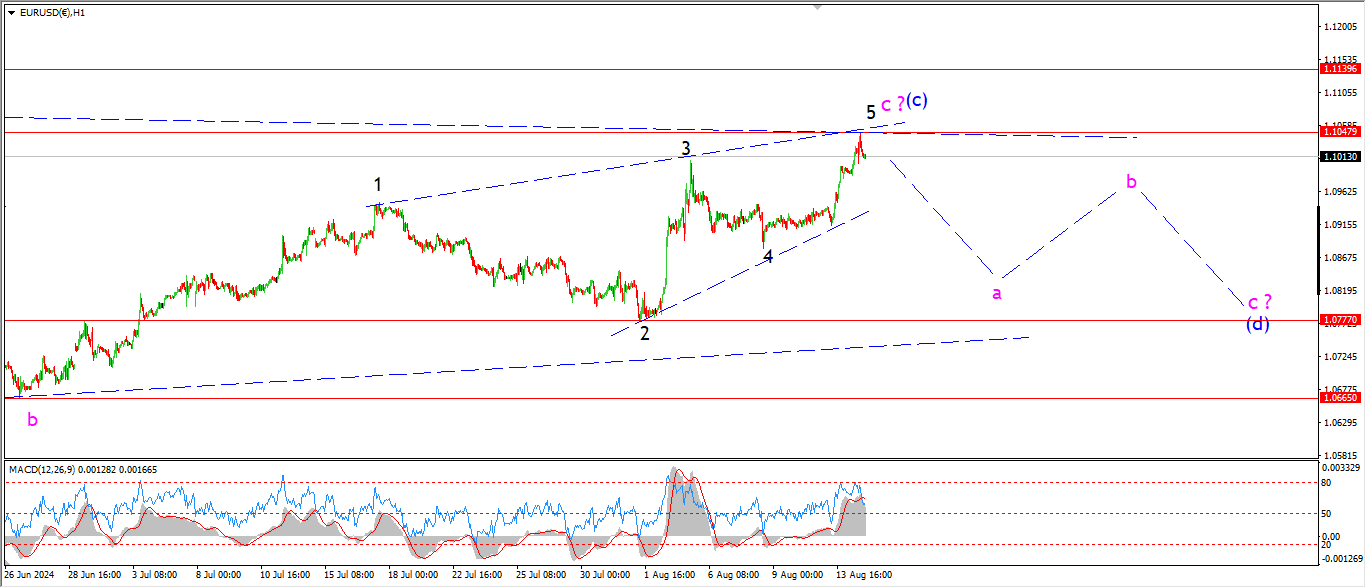
EURUSD 1hr.
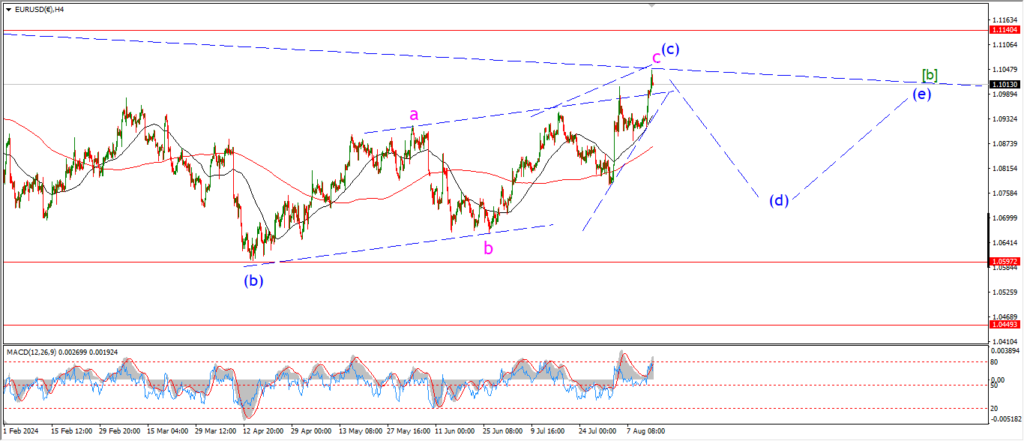
EURUSD 4hr.
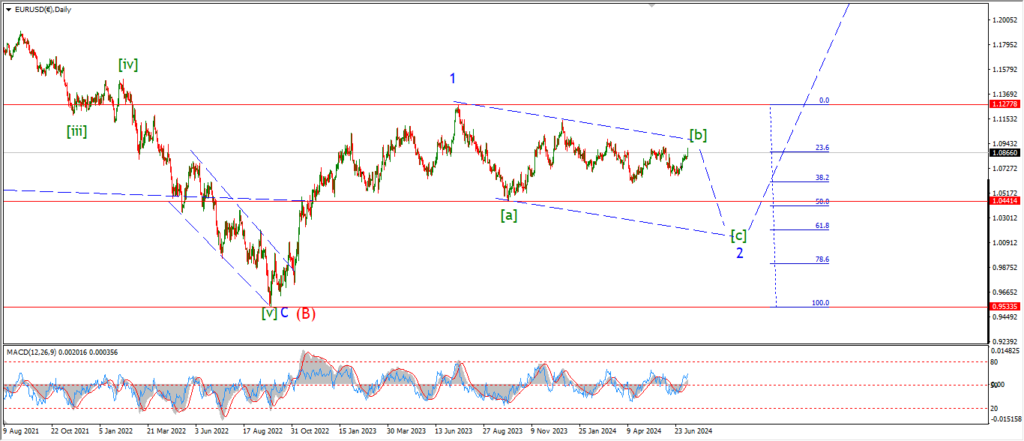
EURUSD daily.
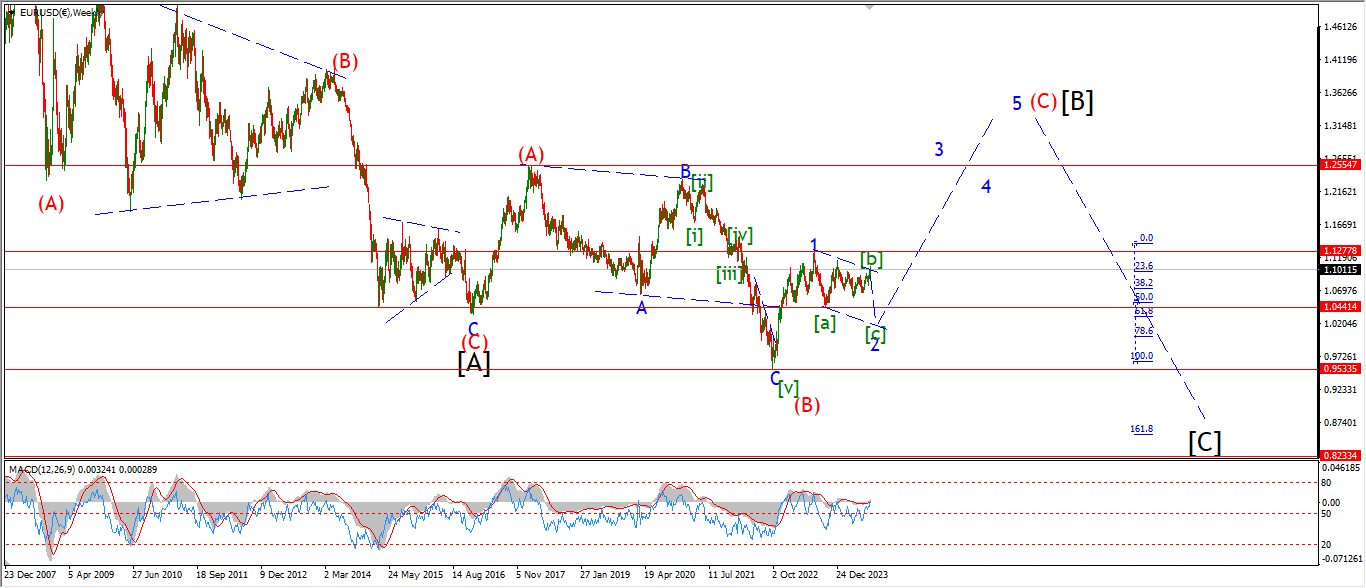
EURUSD has proved to be a very difficult pattern to nail down over the last few weeks.
And today the price broke out of the pattern again which is a little annoying!
I am not going to throw out the baby with the bathwater here though.
The overall ide is solid i think.
If you look at the weekly chart above you can see that a second wave is underway here with wave [b] of ‘2’ tracking sideways for a very long time!
the daily chart shows the triangle in wave [b] quite well with 2 more sub waves left to complete.
And the 4hr chart shows how wave ‘c’ of (c) of [b] is now completing an ending diagonal near the current highs.
On the hourly chart;
Wave ‘c’ has a clear five wave internal pattern and the price is very close to hitting the top end of that wave now.
We can see that the pattern is forming that classic wedge shape to the upside.
And overall we have three waves up in play in wave (c) now.
Wave (d) waits in the wings to turn lower once this top is in.
Tomorrow;
I can’t say that wave (d) will start tomorrow,
but I know that we have pretty much exhausted the upside potential for wave (c).
Watch for a turn lower in wave ‘a’ of (d) by the end of this week.
GBPUSD
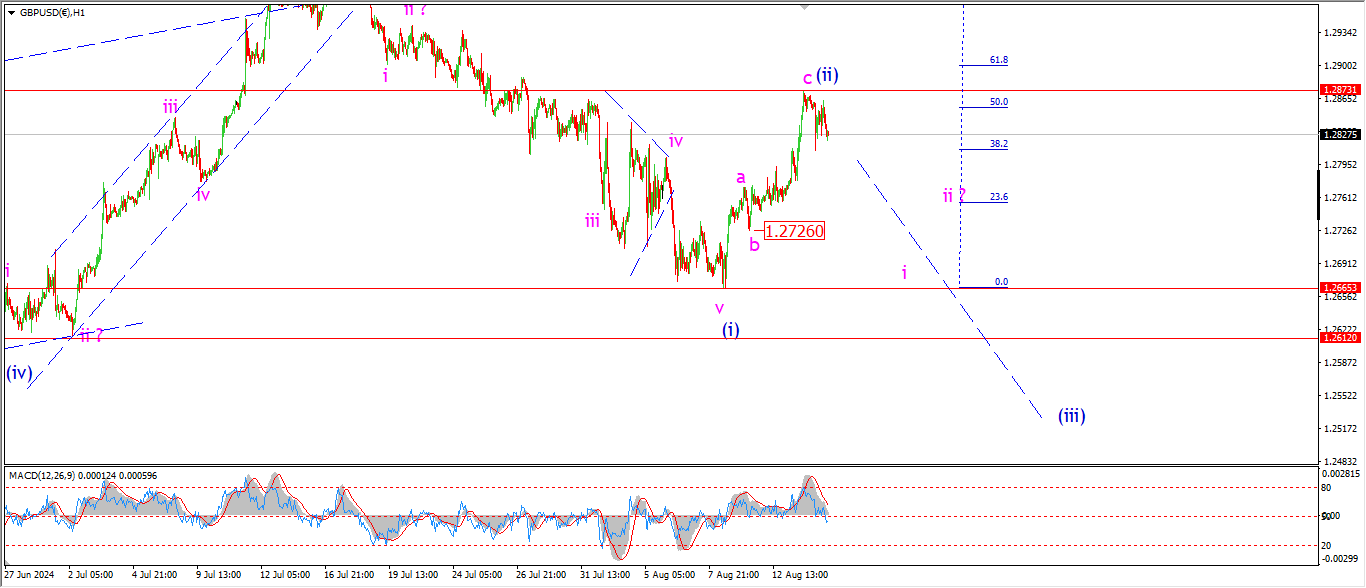
GBPUSD 1hr.
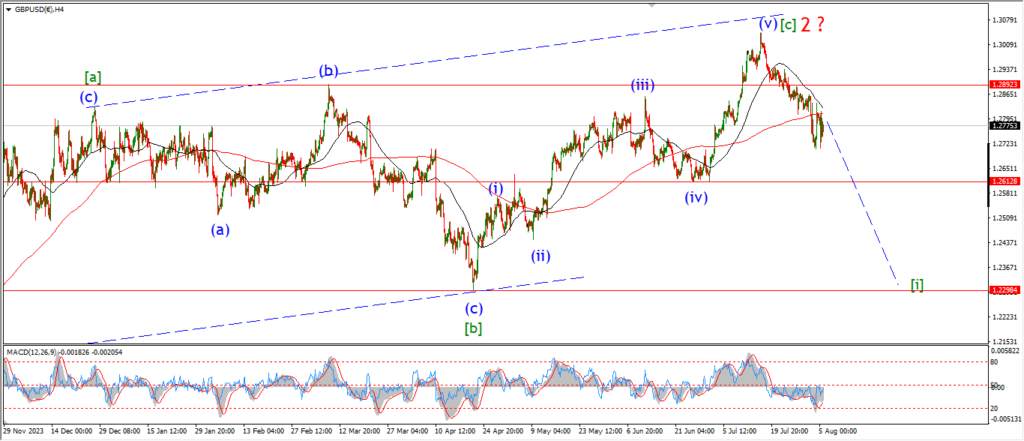
GBPUSD 4hr.
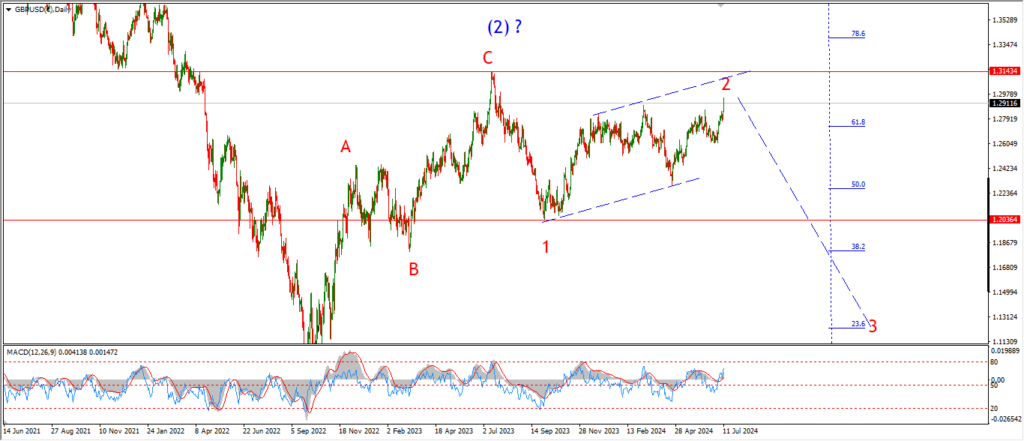
GBPUSD daily.
Cable is showing signs of weakness at the current highs with the price now dropping back off the recent rally again.
There is no confirmation of an impulsive decline in wave ‘i’ yet.
But I am looking for that turn to happen this week.
A break below the wave ‘b’ low at 1.2726 will signal wave ‘i’ is underway.
And if we see a solid break of the wave (i) low at 1.2665 again that will confirm the larger decline has started.
Tomorrow;
Watch for wave (ii) to hold at 1.2873.
wave (iii) down will begin with a break of 1.2726.
USDJPY.
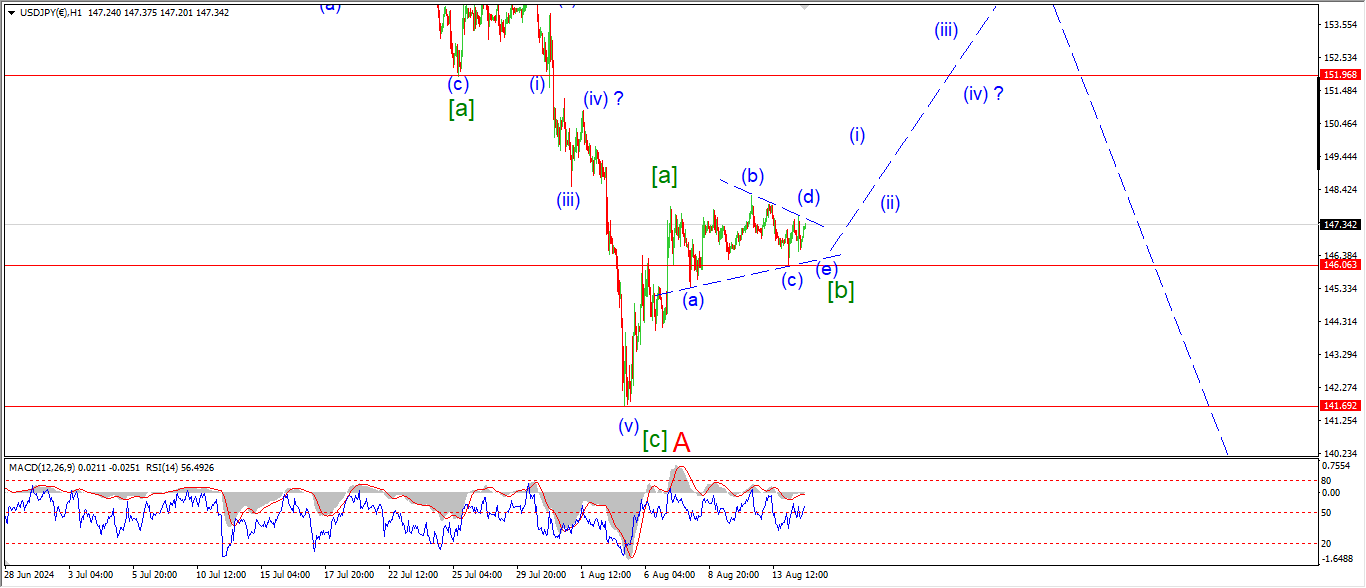
USDJPY 1hr.
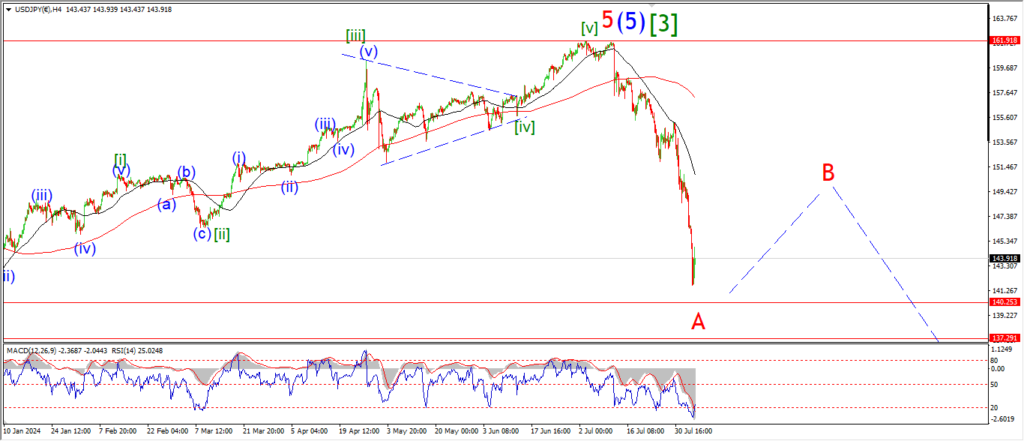
USDJPY 4hr.
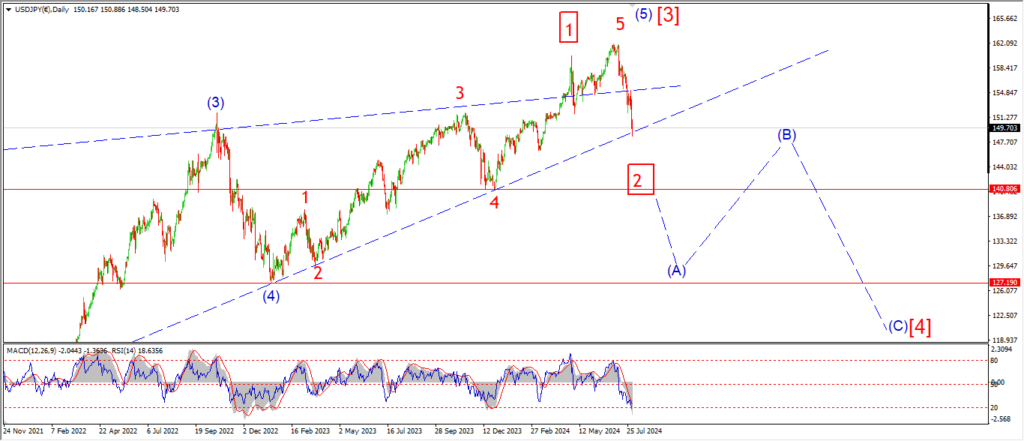
USDJPY daily.
The triangle scenario in wave [b] is working today and possibly even hit closed out at the session low in wave (e) of [b].
If this pattern holds,
then we will have a rally overnight that will push out of the triangle range in wave (i) of [c].
And then the price can continue higher next week in wave [c] of ‘B’.
Tomorrow;
Watch for this triangle to hold above the wave (c) low at 146.06.
WAve (i) of [c] will be confirmed with a break above 149.00.
DOW JONES.
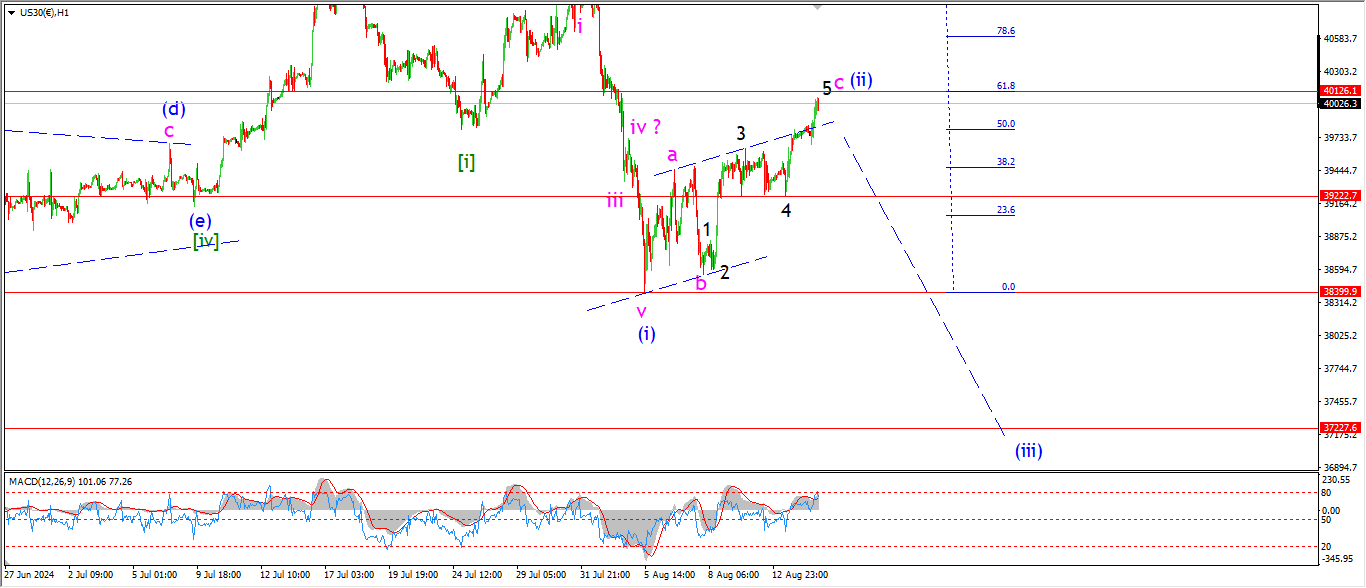
DOW 1hr.
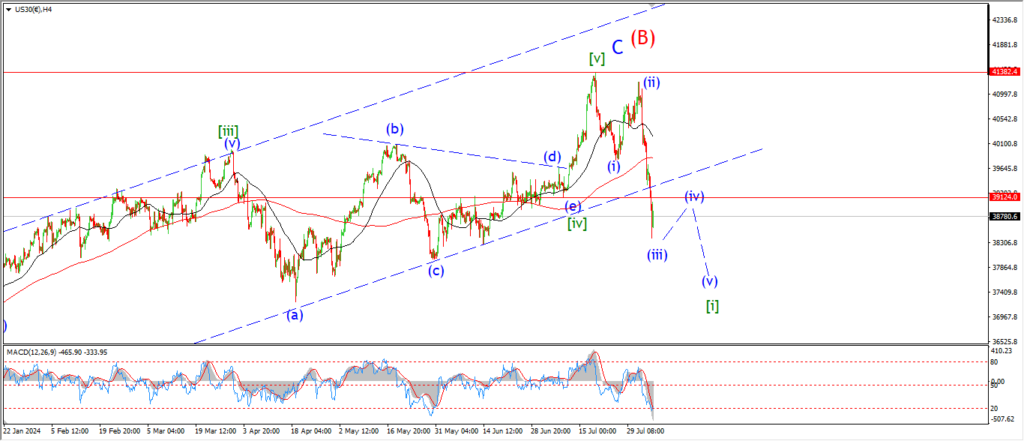
DOW 4hr
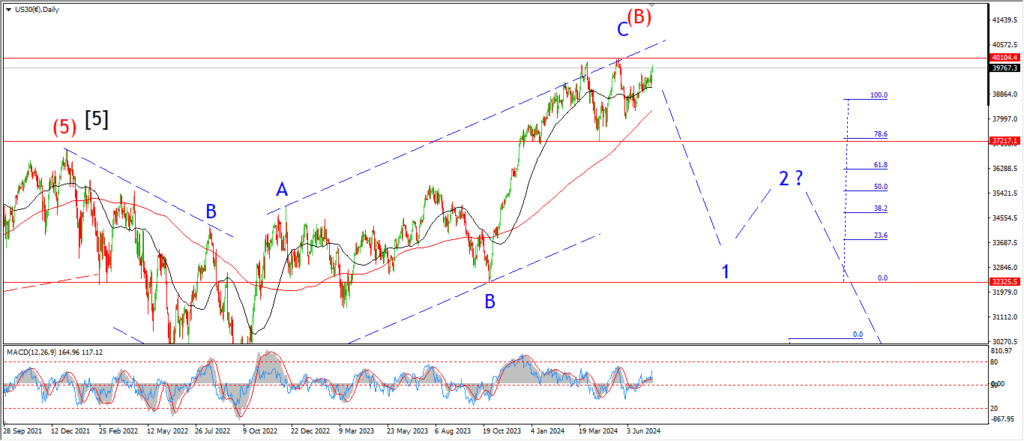
DOW daily.
The Dow is higher today but the momentum is getting weaker as the days go on here.
The price action has traced out a five wave pattern in wave ‘c’ of (ii) now.
and the three wave pattern is holding strong for wave (ii).
The high of todays session is close to hitting that 62% retracement level now.
So the outlook remains the same here,
a reversal into wave (iii) should begin very soon.
Tomorrow;
Watch for wave ‘i’ of (iii) to reverse and fall back into the support level at 38400.
A break of the wave ‘4’ lows at 39220 will the the first hint at the pattern reversing.
GOLD
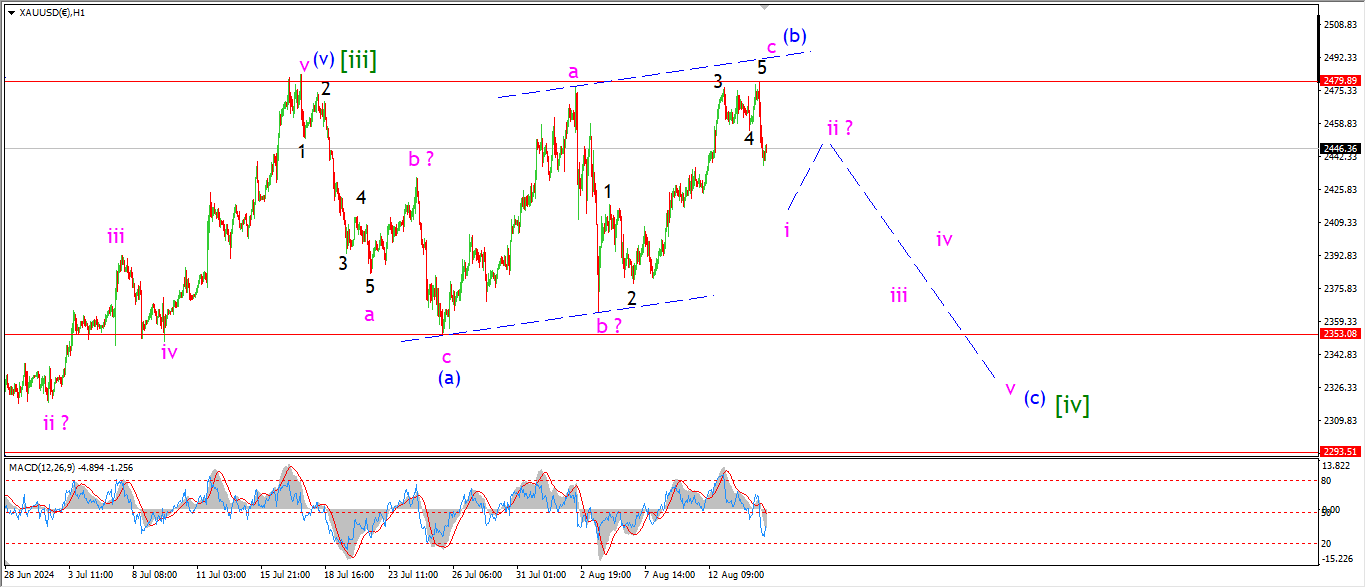
GOLD 1hr.
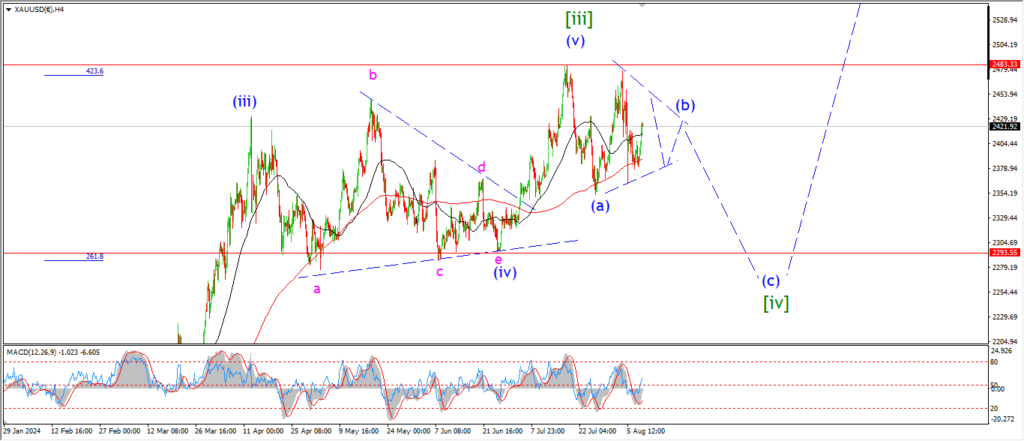
GOLD 4hr.
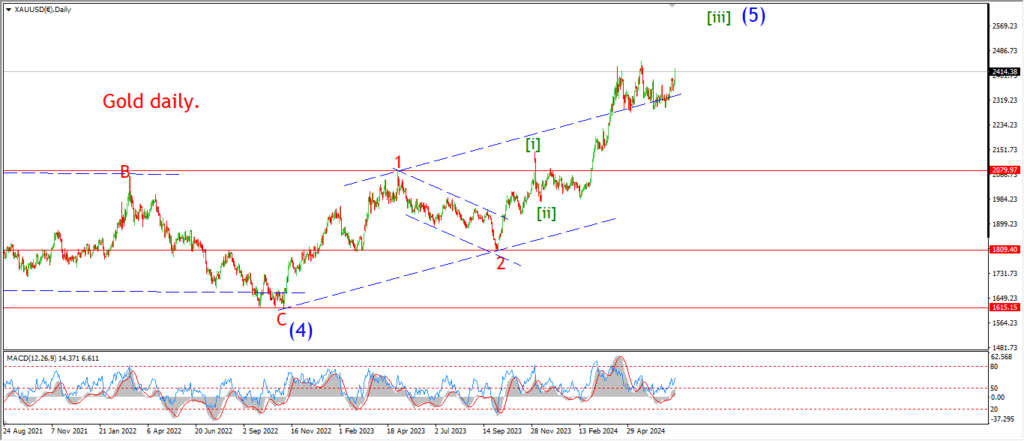
GOLD daily.
Gold did reach a very slight new lower high today to close out wave ‘c’ of (b).
The price then turned lower quite sharply off wave (b).
The price action suggests that wave (b) is now complete and wave (c) is underway.
Wave ‘i’ of (c) should drop a little lower to confirm the reversal
and I would like to see a full retracement of wave (b) over the coming few sessions.
But that is the best case scenario.
We will see how it goes!
Tomorrow;
Watch for wave ‘i’ and ‘ii’ to create a lower high below 2479.
Wave (c) has a minimum target at 2353.
CRUDE OIL.
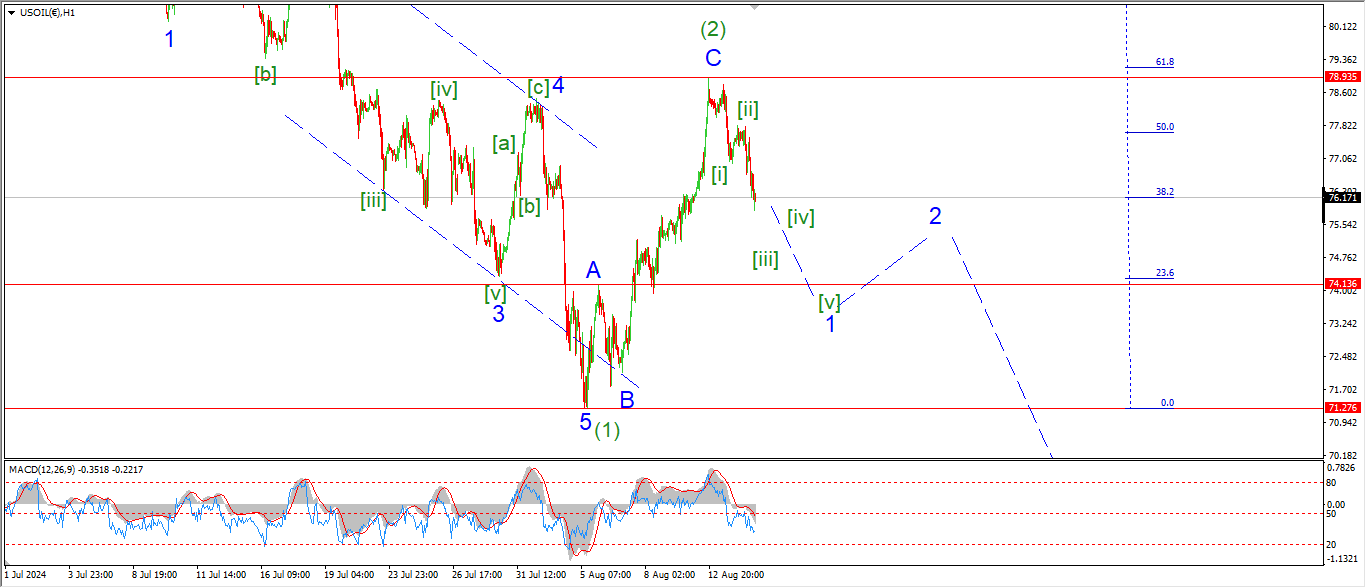
CRUDE OIL 1hr.
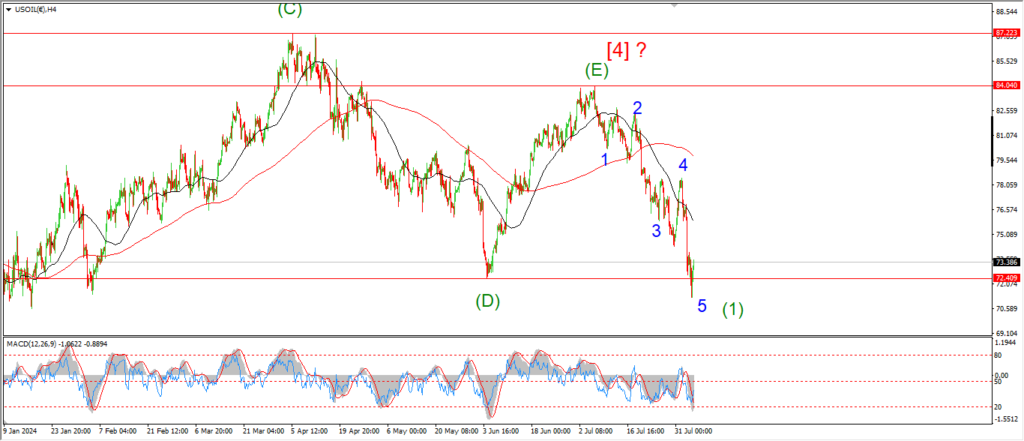
CRUDE OIL 4hr.
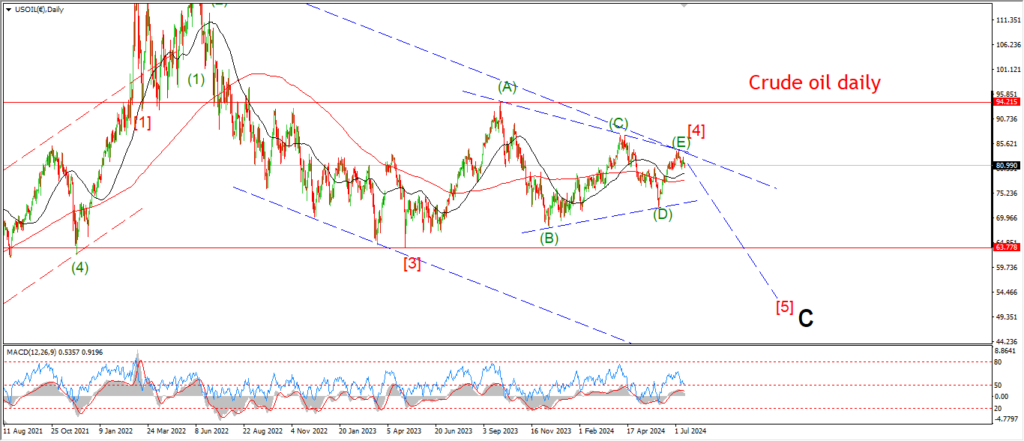
CRUDE OIL daily.
Crude is turning lower today in line with the idea that wave (2) is complete at the recent highs.
The price has not retraced below the wave ‘B’ low at 74.13 yet,
I am suggesting that a break of that level will confirm wave ‘1’.
While wave (3) will not get confirmed until we see a break below 71.26.
Tomorrow;
Watch for wave ‘1’ to continue lower in five waves and break the wave ‘B’ low.
S&P 500.
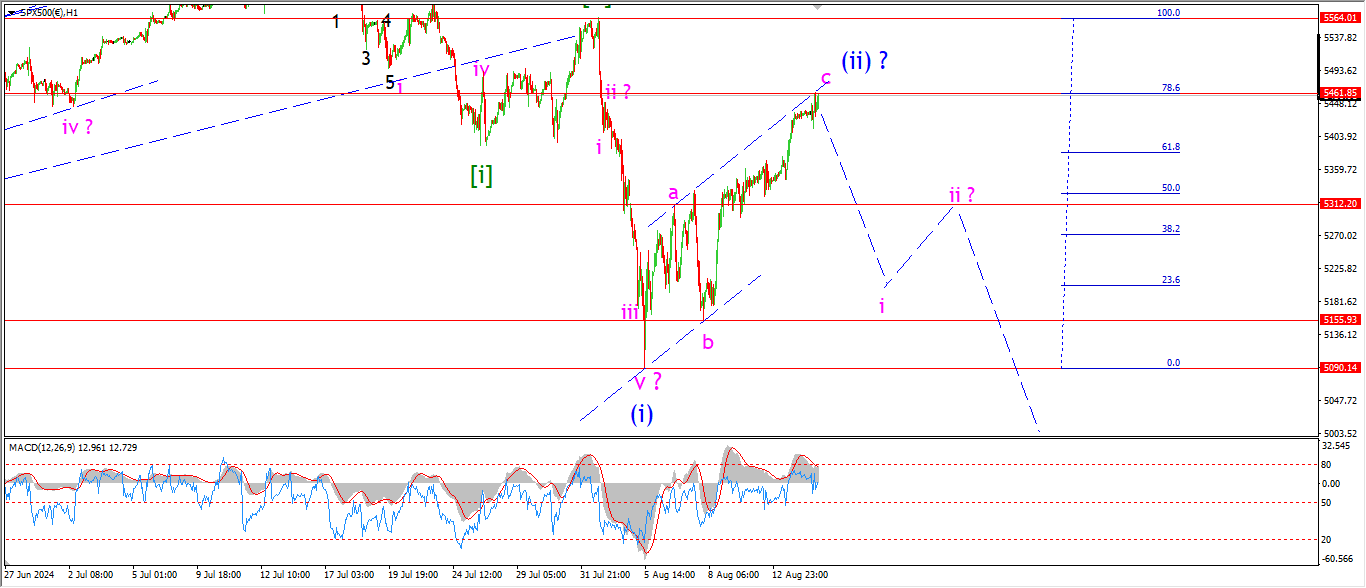
S&P 500 1hr
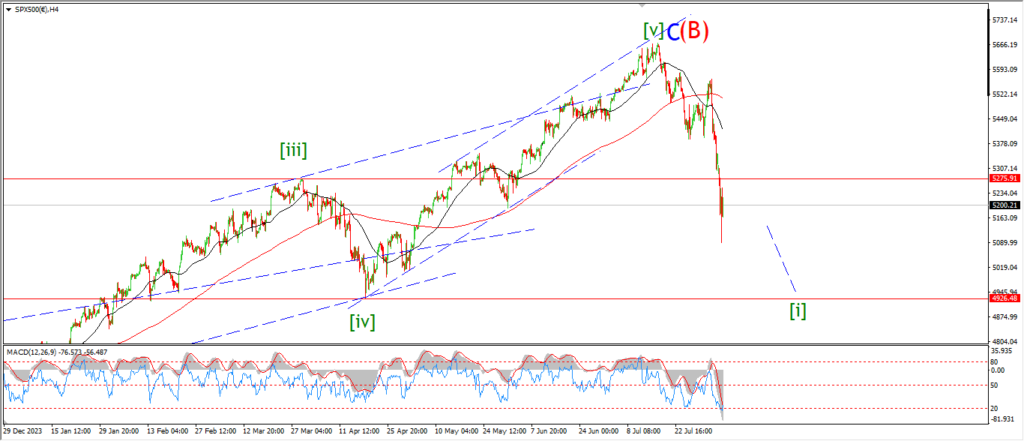
S&P 500 4hr
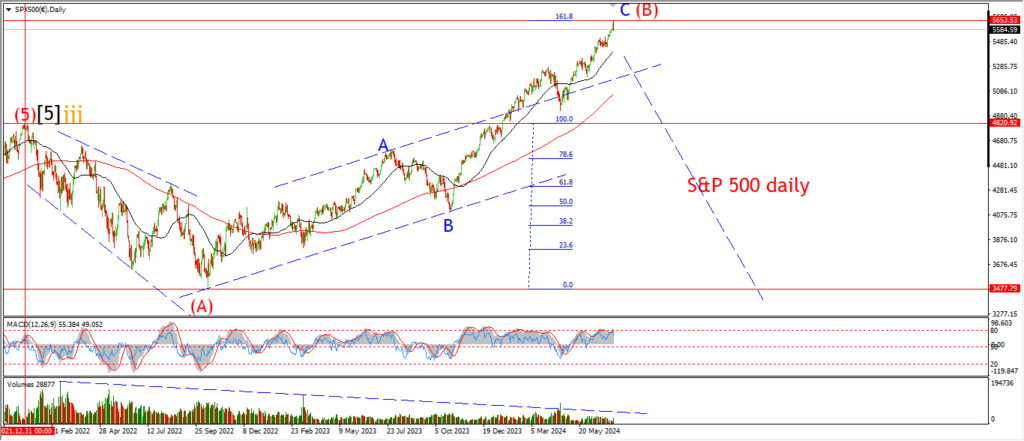
S&P 500 daily.
This has definitely been a hope rebound that only this maniacal hell bent market could pull off.
It does not matter the reality of things.
Always BTD!
The upside has hit a wall today with the rally in wave ‘c’ trapped at the 78.6% retracement level.
Wave ‘c’ has held below the upper trend channel line also,
so as it stands,
we have a corection to the upside here nothing else.
Tomorrow;
This will be an important day given how extended the rally in wave (ii) has been in the last week.
Watch for wave ‘i’ to turn this market lower again.
A break below 5300 again will signal wave ‘i’ of (iii) is underway.
SILVER.
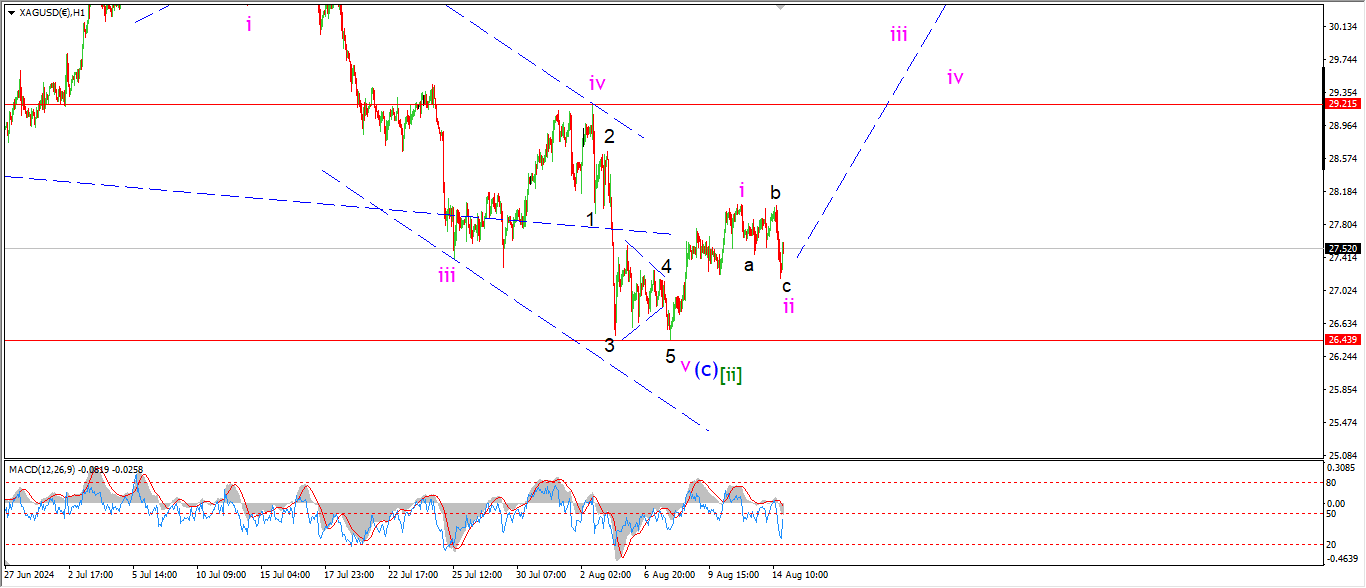
SILVER 1hr
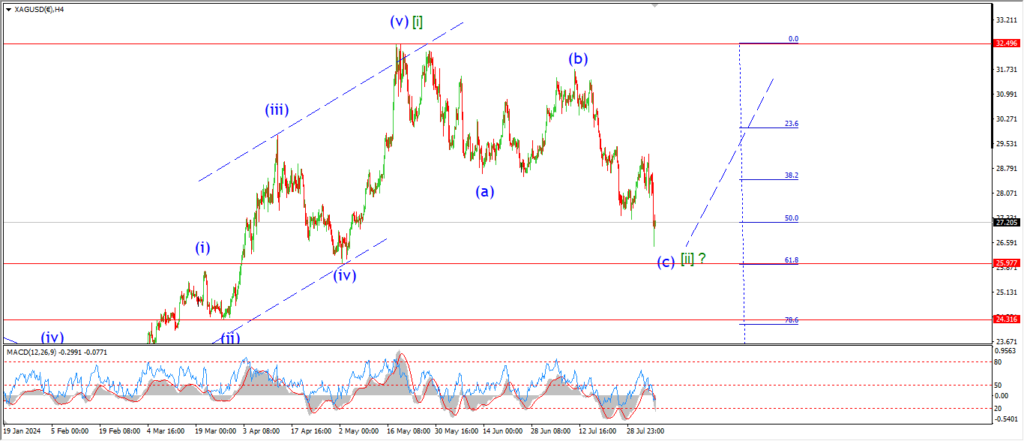
SILVER 4hr.
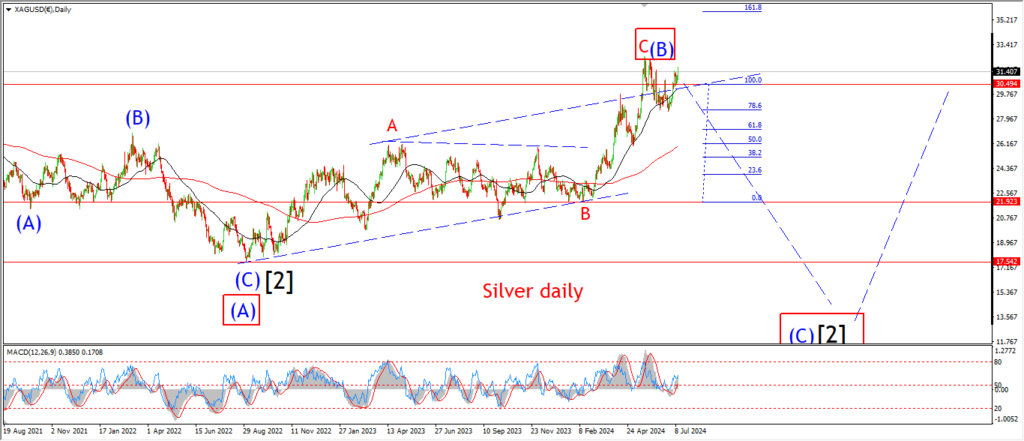
SILVER daily.
Tomorrows trade will being with it a very important test of this bullish pattern.
We have a possible bullish higher low now in place in wave ‘ii’ of (i).
Wave ‘iii’ must turn higher to break 29.00 again over the coming few days to confirm this pattern.
If the price breaks below the wave [ii] low at 26.44 again that will break the bullish setup,
and I will be foreced to rethink the wave [ii] pattern again.
Tomorrow;
WAtch for wave [ii] to hold and wave ‘iii’ of (i) to continue higher as shown.
BITCOIN
BITCOIN 1hr.
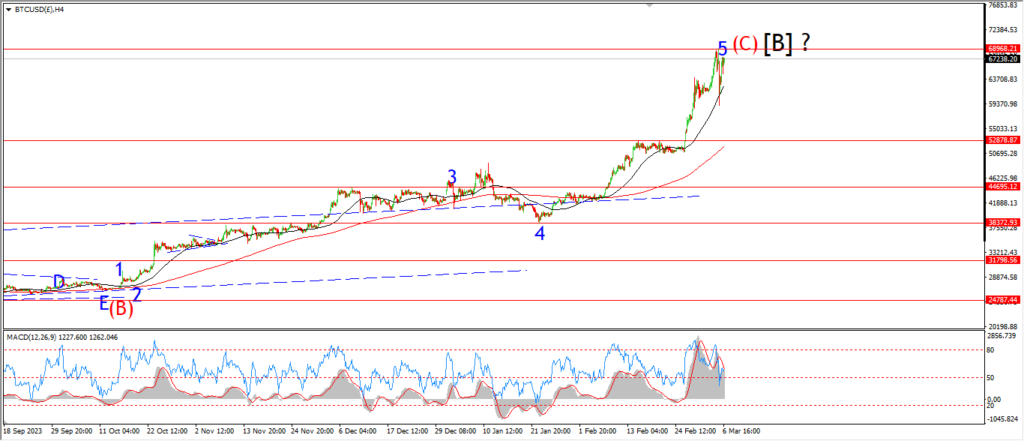
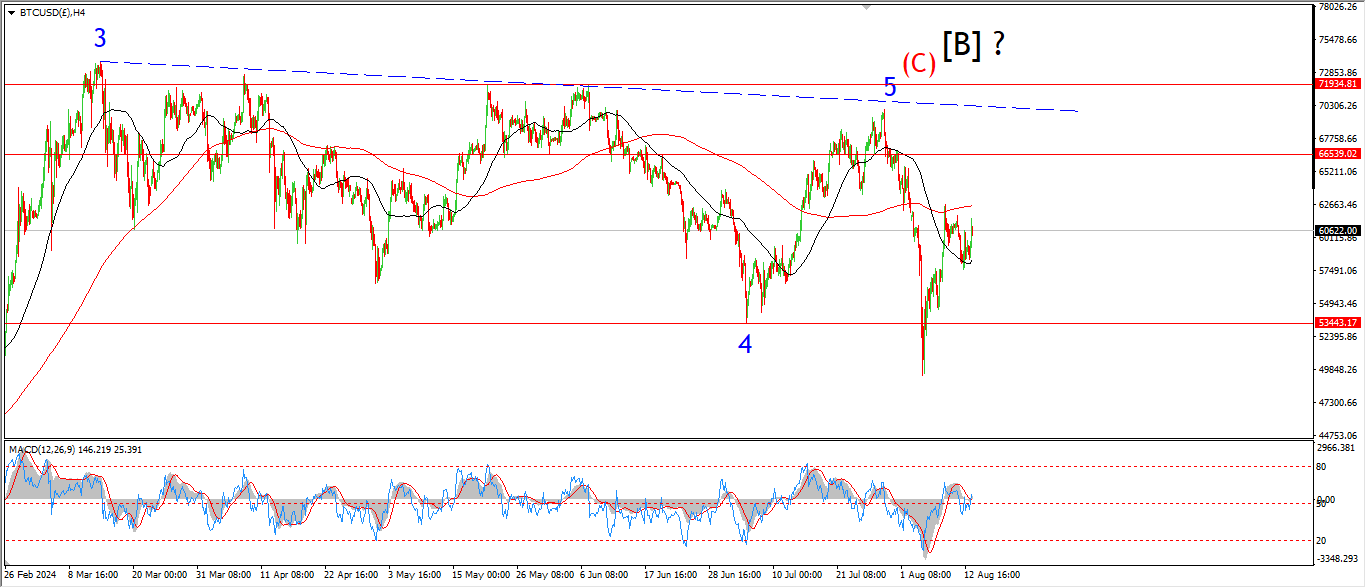
BITCOIN 4hr.
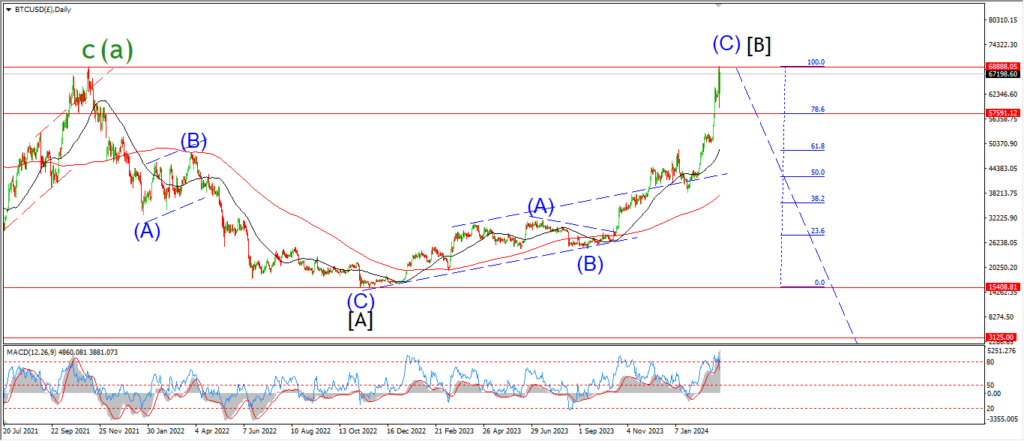
BITCOIN daily.
….
FTSE 100.
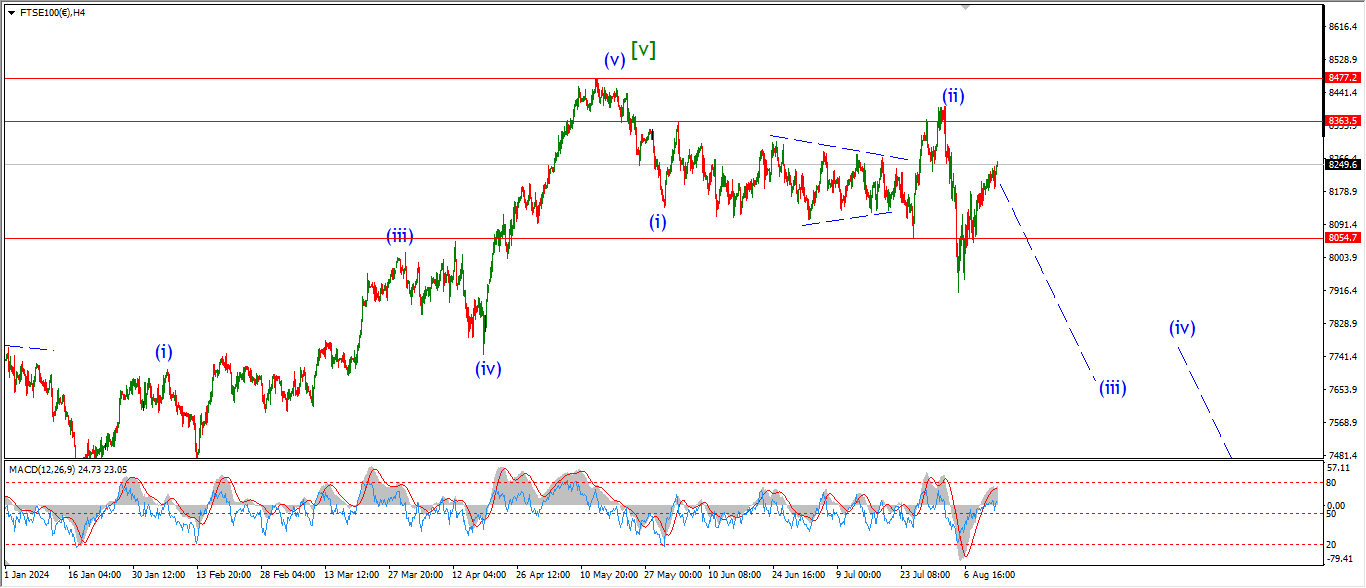
FTSE 100 1hr.

FTSE 100 4hr.

FTSE 100 daily.
….
DAX.
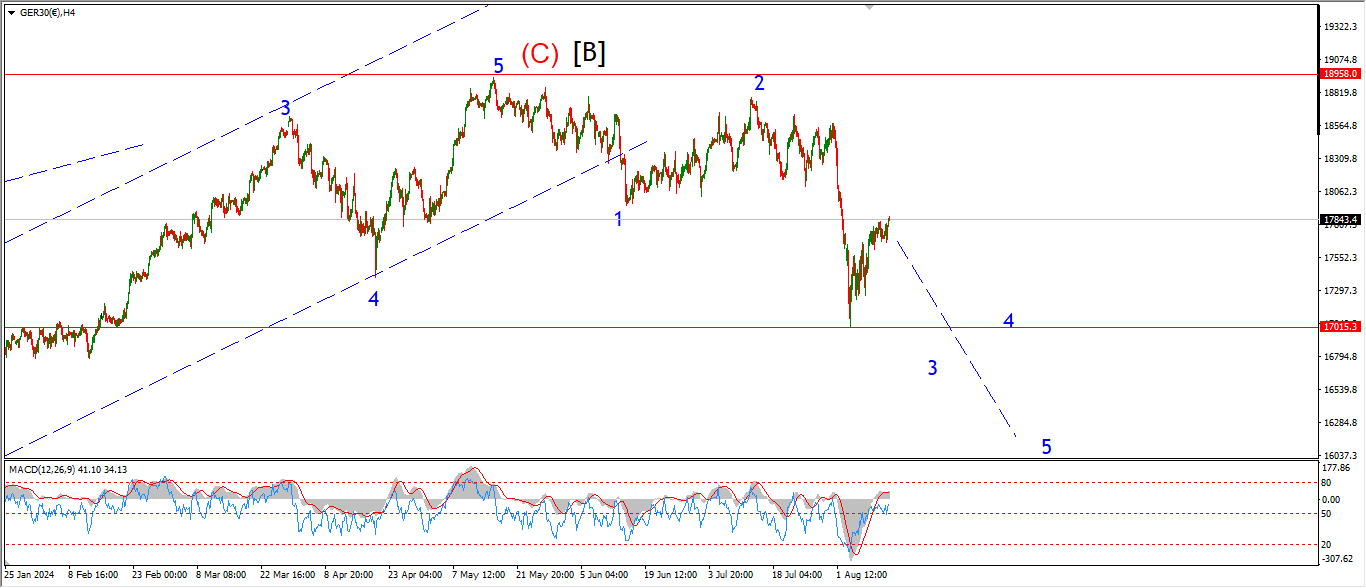
DAX 1hr
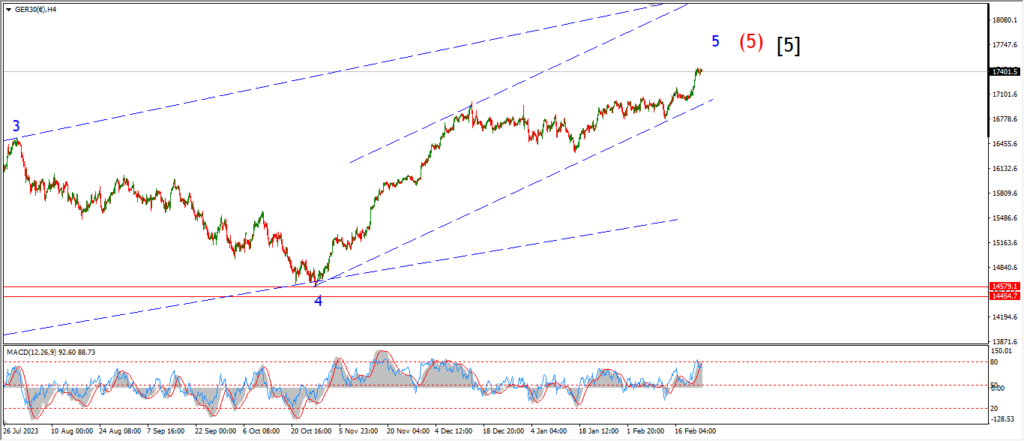
DAX 4hr

DAX daily.
….
NASDAQ 100.
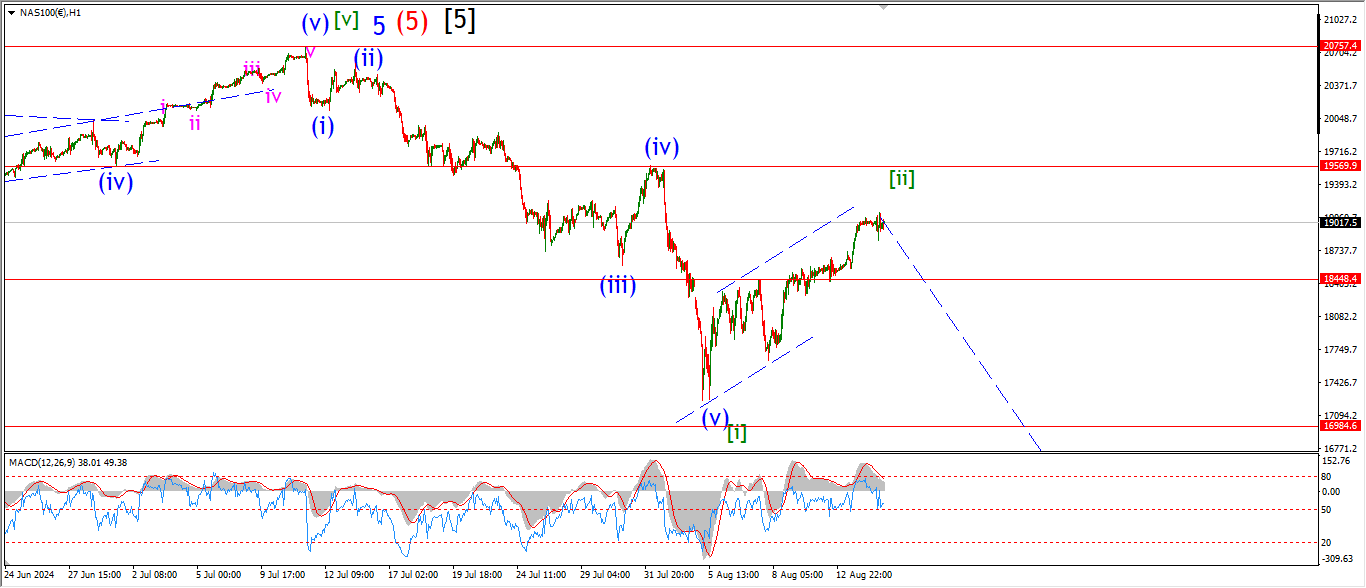
NASDAQ 1hr
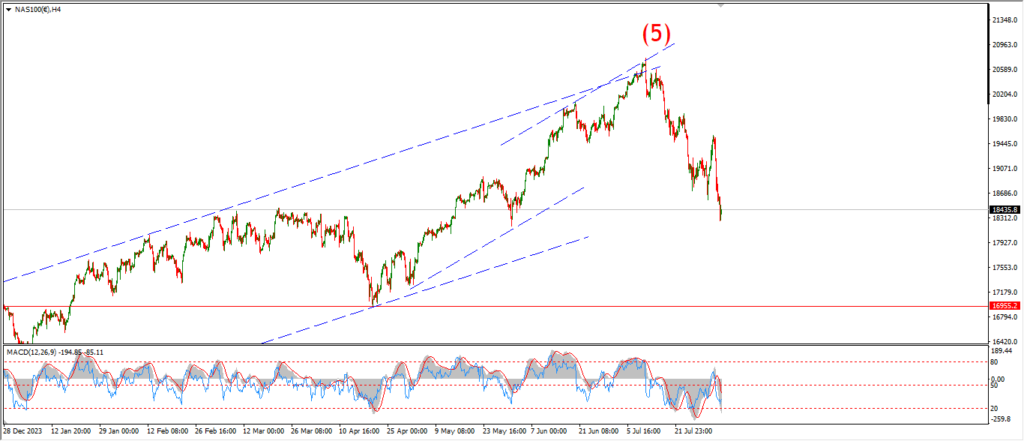
NASDAQ 4hr.
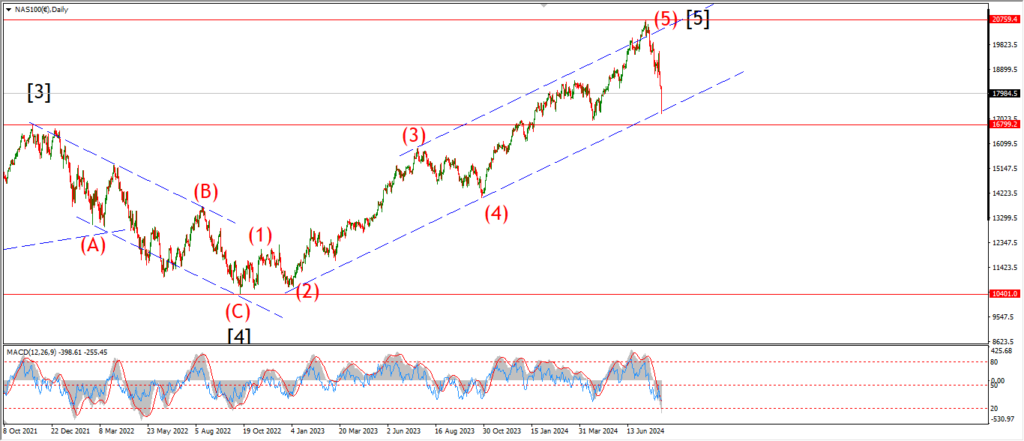
NASDAQ daily.
….