
[vc_row][vc_column][vc_separator border_width=”5″][/vc_column][/vc_row]
[vc_row][vc_column][vc_column_text]
Good evening everyone.
[/vc_column_text][/vc_column][/vc_row]
[vc_row][vc_column][vc_separator border_width=”5″][/vc_column][/vc_row]
[vc_row][vc_column][vc_column_text]
EURUSD
[/vc_column_text][/vc_column][/vc_row]
[vc_row][vc_column][vc_separator border_width=”5″][/vc_column][/vc_row][vc_row][vc_column width=”2/3″][vc_custom_heading text=”1 hr” use_theme_fonts=”yes”][vc_column_text]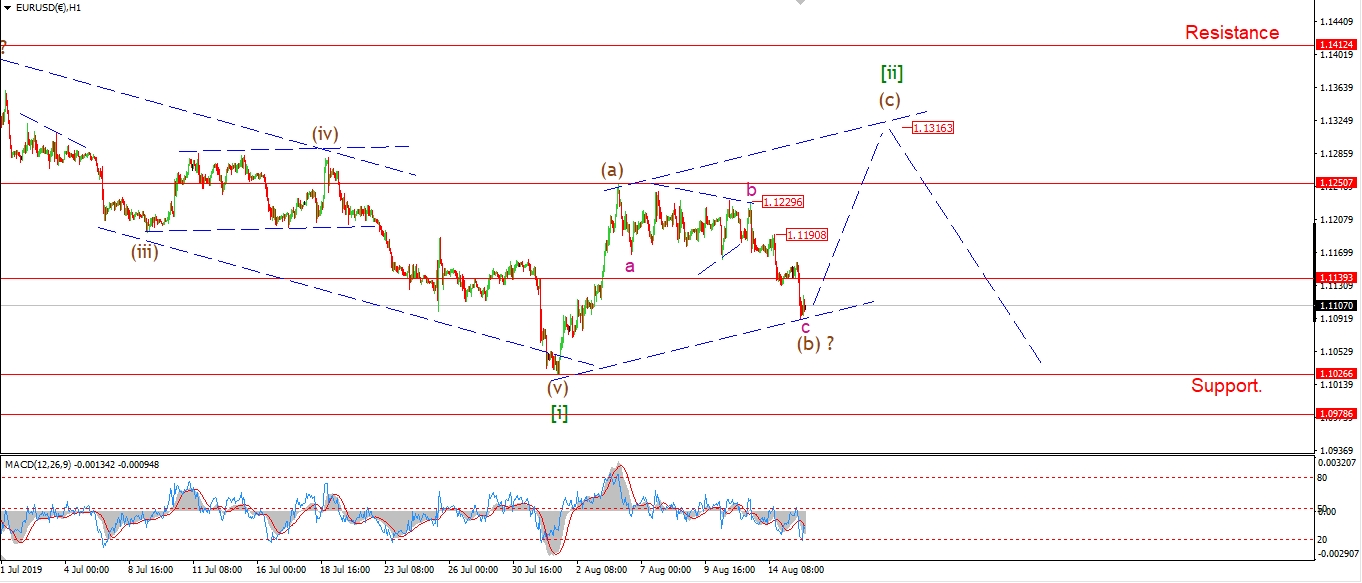 [/vc_column_text][/vc_column][vc_column width=”1/3″][vc_custom_heading text=”4 Hours” use_theme_fonts=”yes”][vc_column_text]
 [/vc_column_text][vc_custom_heading text=”Daily” use_theme_fonts=”yes”][vc_column_text]
 [/vc_column_text][/vc_column][/vc_row]
[vc_row][vc_column][vc_column_text]
Wave ‘c’ of (b) has now traced out a five wave decline into this evenings lows.
This should be enough to complete wave ‘c’ and the larger wave (b).
The bearish sentiment is proving very hard to counteract these days.
So the overall size of wave [ii] may end up smaller than usual.
Tomorrow;
I still expect a rally in wave (c) to begin soon.
Lets see if we can push higher tomorrow to end the week with a higher low.
If tomorrows trade breaks above 1.1190 that should be enough to signal wave (c) has begun.
[/vc_column_text][/vc_column][/vc_row]
[vc_row][vc_column][vc_separator border_width=”5″][/vc_column][/vc_row][vc_row][vc_column][vc_column_text]
GBPUSD
[/vc_column_text][/vc_column][/vc_row][vc_row][vc_column][vc_separator border_width=”5″][/vc_column][/vc_row][vc_row][vc_column width=”2/3″][vc_custom_heading text=”1 hr” use_theme_fonts=”yes”][vc_column_text]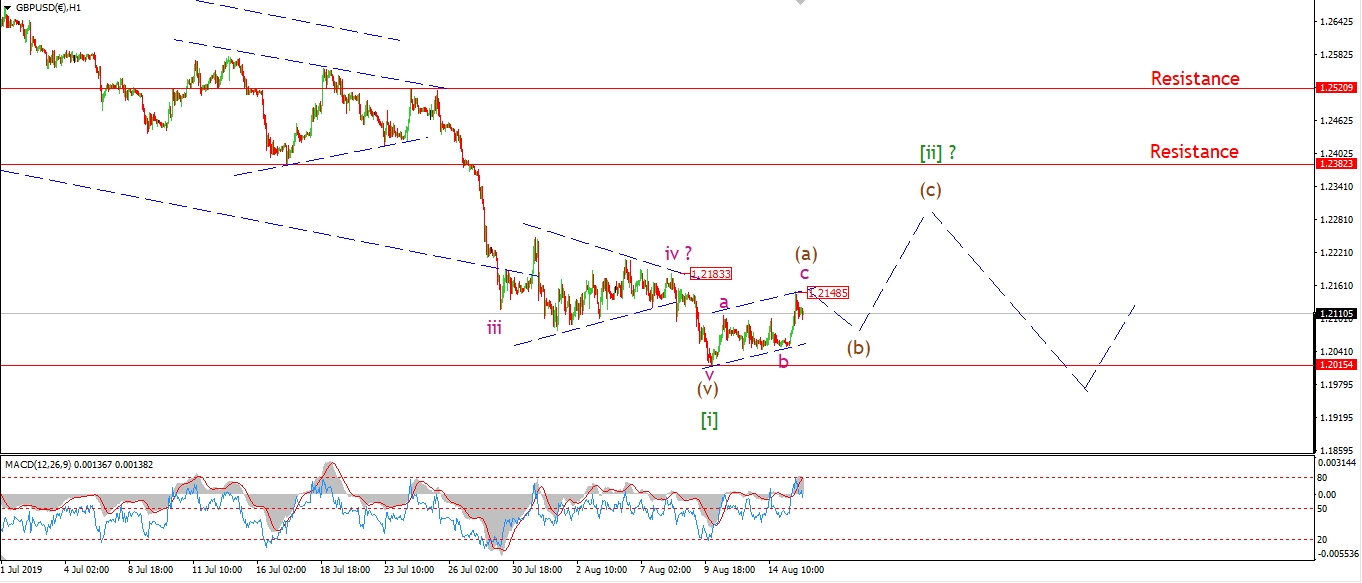 [/vc_column_text][/vc_column][vc_column width=”1/3″][vc_custom_heading text=”4 Hours” use_theme_fonts=”yes”][vc_column_text]
 [/vc_column_text][vc_custom_heading text=”Daily” use_theme_fonts=”yes”][vc_column_text]
 [/vc_column_text][/vc_column][/vc_row]
[vc_row][vc_column][vc_column_text]
Cable has now risen in a small three wave pattern into todays highs at 1.2148.
This rise is labelled as a complete wave (a).
musch like EURUSD,
the rise in wave (a) so far has been far smaller than previously expected.
So the larger wave [ii] might not even reach above initial resistance at 1.2383.
At this point we have a three wave rise complete in wave (a).
so we should now see wave (b) fall in three waves and complete above 1.2015.
Tomorrow;
Watch for 1.2015 to hold and wave (b) to continue lower.
[/vc_column_text][/vc_column][/vc_row]
[vc_row][vc_column][vc_separator border_width=”5″][/vc_column][/vc_row][vc_row][vc_column][vc_column_text]
USDJPY
[/vc_column_text][/vc_column][/vc_row][vc_row][vc_column][vc_separator border_width=”5″][/vc_column][/vc_row][vc_row][vc_column width=”2/3″][vc_custom_heading text=”1 hr” use_theme_fonts=”yes”][vc_column_text]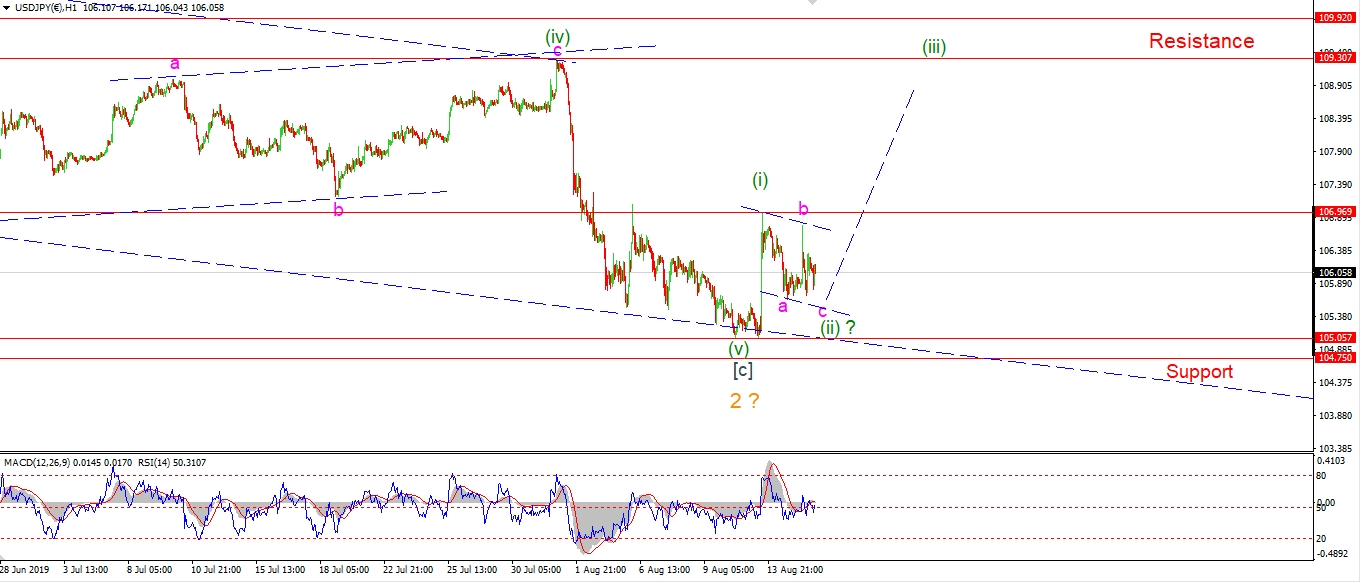 [/vc_column_text][/vc_column][vc_column width=”1/3″][vc_custom_heading text=”4 Hours” use_theme_fonts=”yes”][vc_column_text]
 [/vc_column_text][vc_custom_heading text=”Daily” use_theme_fonts=”yes”][vc_column_text]
 [/vc_column_text][/vc_column][/vc_row]
[vc_row][vc_column][vc_column_text]
USDJPY is tracing out a three wave correction off the spike high at wave (i).
Wave (ii) is drawing to a close now.
Wave ‘c’ of (ii) should touch the trend channel line again.
But the price must hold above 105.05 overnight
and then rally immediately tomorrow in order to continue with the bullish pattern.
A break above 107.00 tomorrow will help the bullish pattern.
Tomorrow;
Watch for wave (ii) to complete and wave (iii) up to take hold with a break of 107.00.
[/vc_column_text][/vc_column][/vc_row]
[vc_row][vc_column][vc_separator border_width=”5″][/vc_column][/vc_row][vc_row][vc_column][vc_column_text]
DOW JONES INDUSTRIALS
[/vc_column_text][/vc_column][/vc_row][vc_row][vc_column][vc_separator border_width=”5″][/vc_column][/vc_row][vc_row][vc_column width=”2/3″][vc_custom_heading text=”1 hr” use_theme_fonts=”yes”][vc_column_text]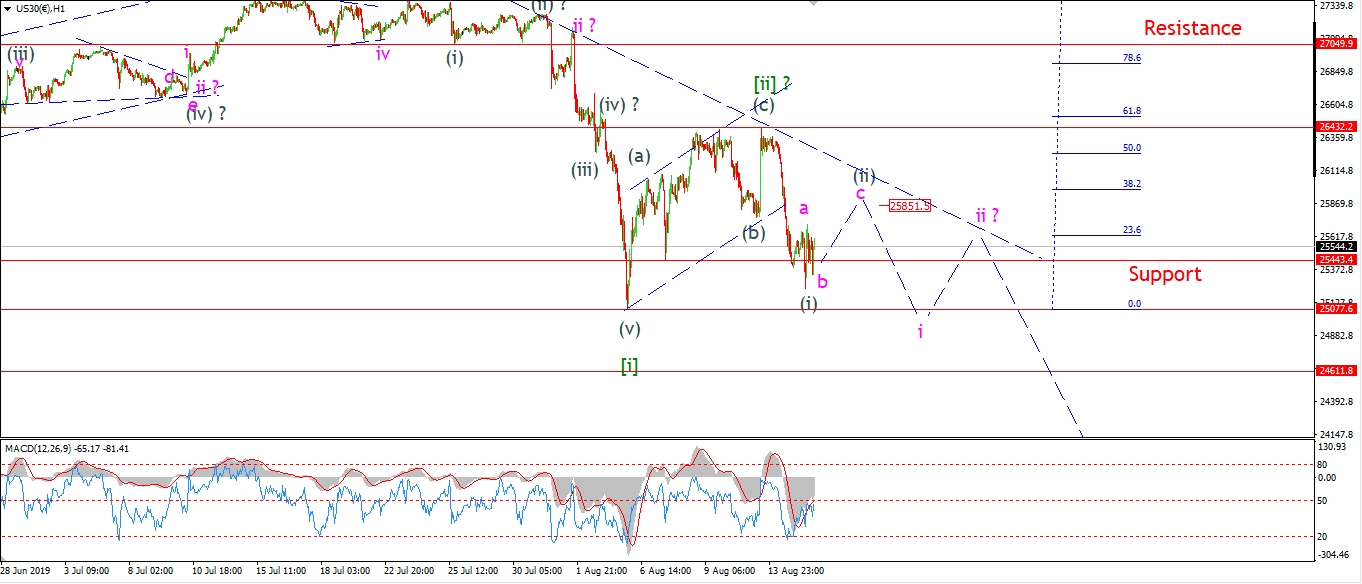 [/vc_column_text][/vc_column][vc_column width=”1/3″][vc_custom_heading text=”4 Hours” use_theme_fonts=”yes”][vc_column_text]
 [/vc_column_text][vc_custom_heading text=”Daily” use_theme_fonts=”yes”][vc_column_text]
 [/vc_column_text][/vc_column][/vc_row]
[vc_row][vc_column][vc_column_text]
The DOW broke that interim low at 25443 today,
adding weight to the idea that wave [iii] down is now in its opening phase.
The price is again closing near the lows of the session,
but I have labelled the decline this evening as wave ‘b’ of (ii),
with wave ‘c’ left to rally back towards 25800 again and complete the larger wave (ii).
If this pattern comes to pass,
we will be completing the week on a further lower high second wave.
With the expectation being,
that next week will bring in a renewed selling frenzy in wave (iii) of [iii].
Wave [iii] itself should knock the bulls off their high horse in the short term anyway!
Tomorrow;
Watch for wave ‘c’ of (ii) to return higher tomorrow.
Wave (ii) itself should complete below the declining trend channel line at about 25800.
[/vc_column_text][/vc_column][/vc_row]
[vc_row][vc_column][vc_separator border_width=”5″][/vc_column][/vc_row][vc_row][vc_column][vc_column_text]
GOLD
[/vc_column_text][/vc_column][/vc_row][vc_row][vc_column][vc_separator border_width=”5″][/vc_column][/vc_row][vc_row][vc_column width=”2/3″][vc_custom_heading text=”1 hr” use_theme_fonts=”yes”][vc_column_text]
 [/vc_column_text][/vc_column][vc_column width=”1/3″][vc_custom_heading text=”4 Hours” use_theme_fonts=”yes”][vc_column_text]
 [/vc_column_text][vc_custom_heading text=”Daily” use_theme_fonts=”yes”][vc_column_text]
 [/vc_column_text][/vc_column][/vc_row]
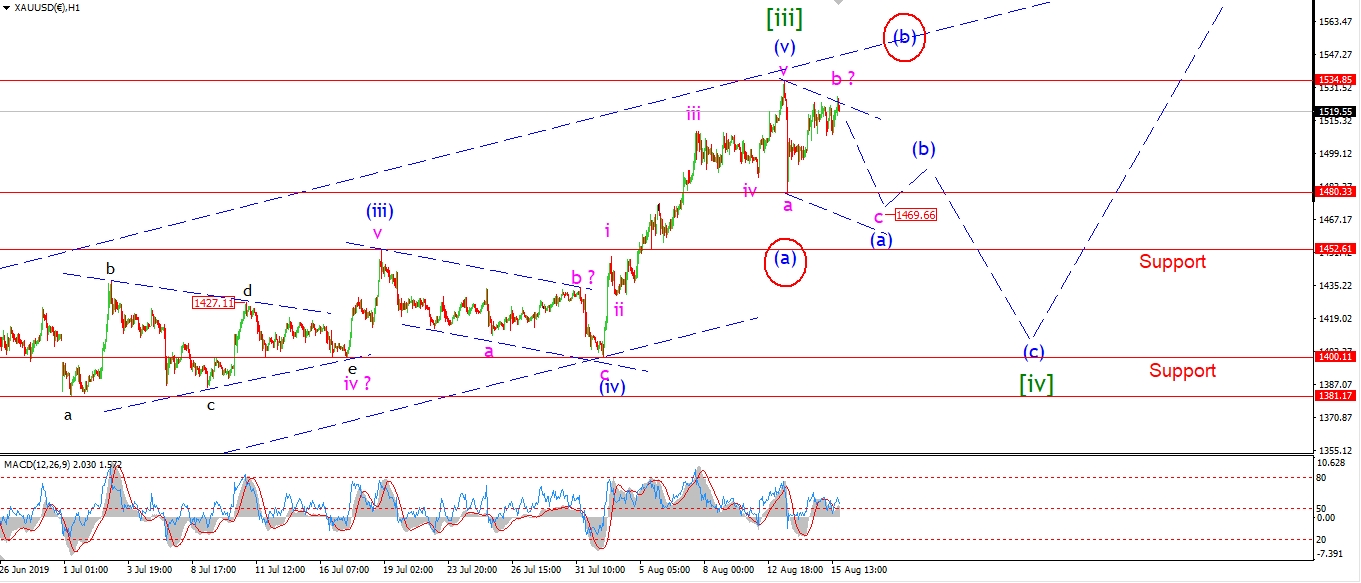
[vc_row][vc_column][vc_column_text]
The rise off wave ‘a’ at 1480 looks very like a five wave structure this evening.
I am sticking with the current wave count for the moment.
But if we don’t see a decline towards 1480 tomorrow,
then I will have to rethink the short term count.
There is a chance that a larger three wave rally in wave (b) is now underway.
This is shown as the alternate count at the moment.
Tomorrow;
Watch for a drop to occur off the current levels in wave ‘c’ of (a).
If this decline creates a higher low above 1480,
that will favor the alternate count.
[/vc_column_text][/vc_column][/vc_row]
[vc_row][vc_column][vc_separator border_width=”5″][/vc_column][/vc_row][vc_row][vc_column][vc_column_text]
U.S CRUDE OIL
[/vc_column_text][/vc_column][/vc_row][vc_row][vc_column][vc_separator border_width=”5″][/vc_column][/vc_row][vc_row][vc_column width=”2/3″][vc_custom_heading text=”1 hr” use_theme_fonts=”yes”][vc_column_text]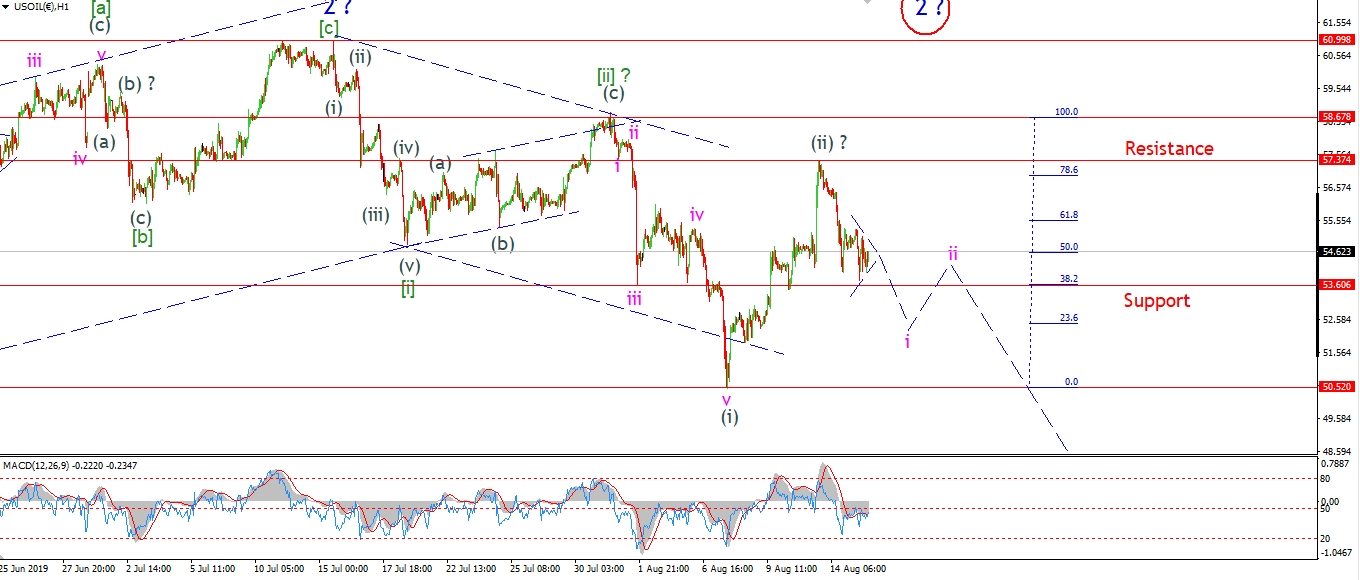 [/vc_column_text][/vc_column][vc_column width=”1/3″][vc_custom_heading text=”4 Hours” use_theme_fonts=”yes”][vc_column_text]
 [/vc_column_text][vc_custom_heading text=”Daily” use_theme_fonts=”yes”][vc_column_text]
 [/vc_column_text][/vc_column][/vc_row]
[vc_row][vc_column][vc_column_text]
Crude is again nearing another five wave decline in wave ‘i’ of (iii).
The tight ranging action today
could be a small triangle fourth wave within wave ‘i’ down.
If this is the case,
then wave ‘i’ will complete early tomorrow,
with a further drop below 53.60 to complete five waves down.
We can then expect a three wave recovery in wave ‘ii’ to begin off that low
and that correction should complete below 57.37.
Tomorrow;
Watch for wave ‘i’ down to close out with a short break of 53.60.
Wave ‘ii’ should begin tomorrow also.
[/vc_column_text][/vc_column][/vc_row]
[vc_row][vc_column][vc_separator border_width=”5″][/vc_column][/vc_row][vc_row][vc_column][vc_column_text]
US 10 yr Treasuries.
[/vc_column_text][/vc_column][/vc_row][vc_row][vc_column][vc_separator border_width=”5″][/vc_column][/vc_row][vc_row][vc_column width=”2/3″][vc_custom_heading text=”1 hr” use_theme_fonts=”yes”][vc_column_text]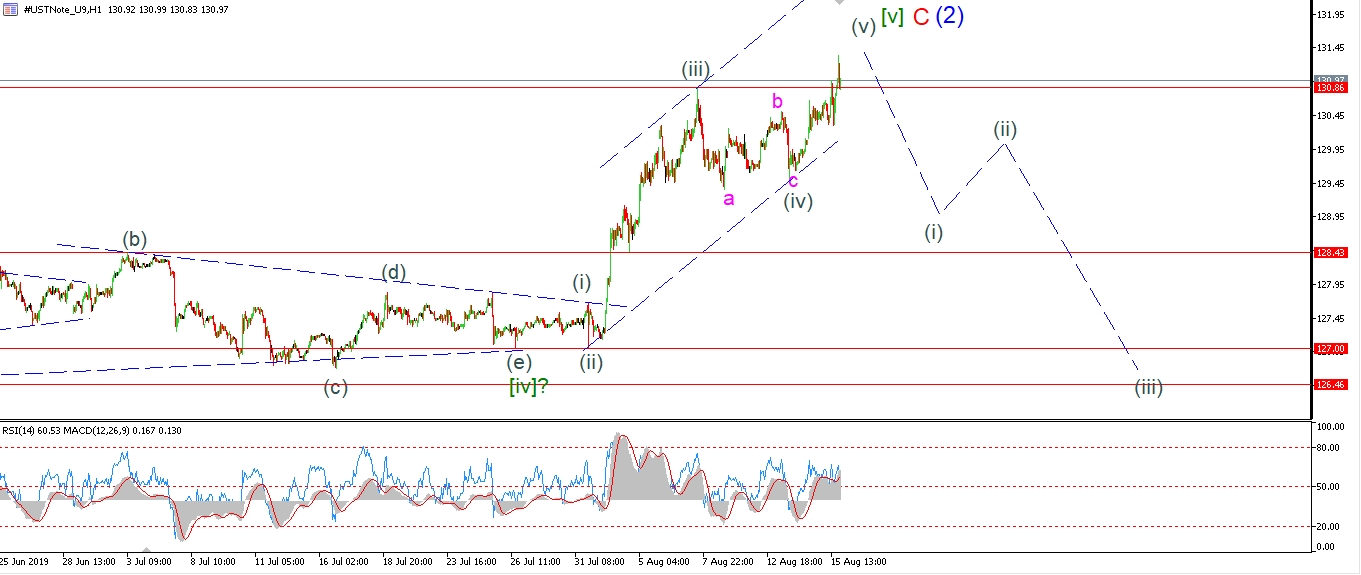 [/vc_column_text][/vc_column][vc_column width=”1/3″][vc_custom_heading text=”4 Hours” use_theme_fonts=”yes”][vc_column_text]
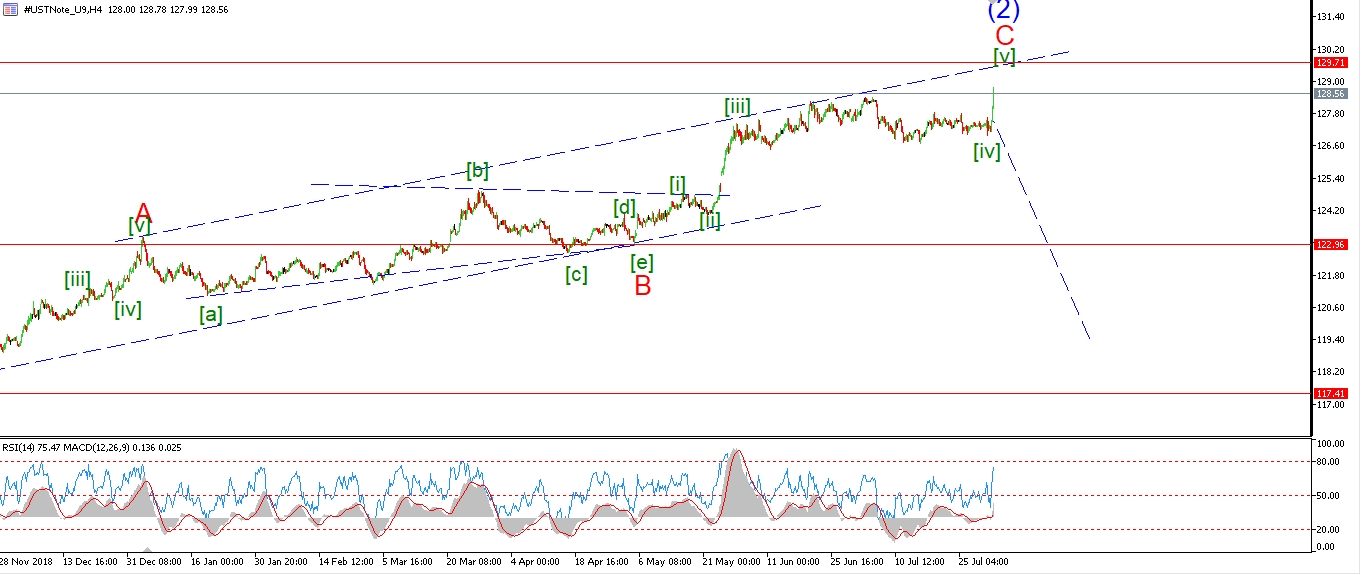 [/vc_column_text][vc_custom_heading text=”Daily” use_theme_fonts=”yes”][vc_column_text]
 [/vc_column_text][/vc_column][/vc_row]
[vc_row][vc_column][vc_column_text]
The price broke above 130.86 early today to invalidate the short term pattern.
As I mentioned last night,
I think this break wont last long as wave [v] green is simply tracing out its final moves now.
The price is again falling tonight.
I will have to wait and see if this fresh decline develops into something larger that we can work with.
Tomorrow;
Watch for wave (v) to again put in a final top over the coming days.
[/vc_column_text][/vc_column][/vc_row]
[vc_row][vc_column][vc_separator border_width=”5″][/vc_column][/vc_row][vc_row][vc_column][vc_column_text]
SILVER
[/vc_column_text][/vc_column][/vc_row][vc_row][vc_column][vc_separator border_width=”5″][/vc_column][/vc_row][vc_row][vc_column width=”2/3″][vc_custom_heading text=”1 hr” use_theme_fonts=”yes”][vc_column_text]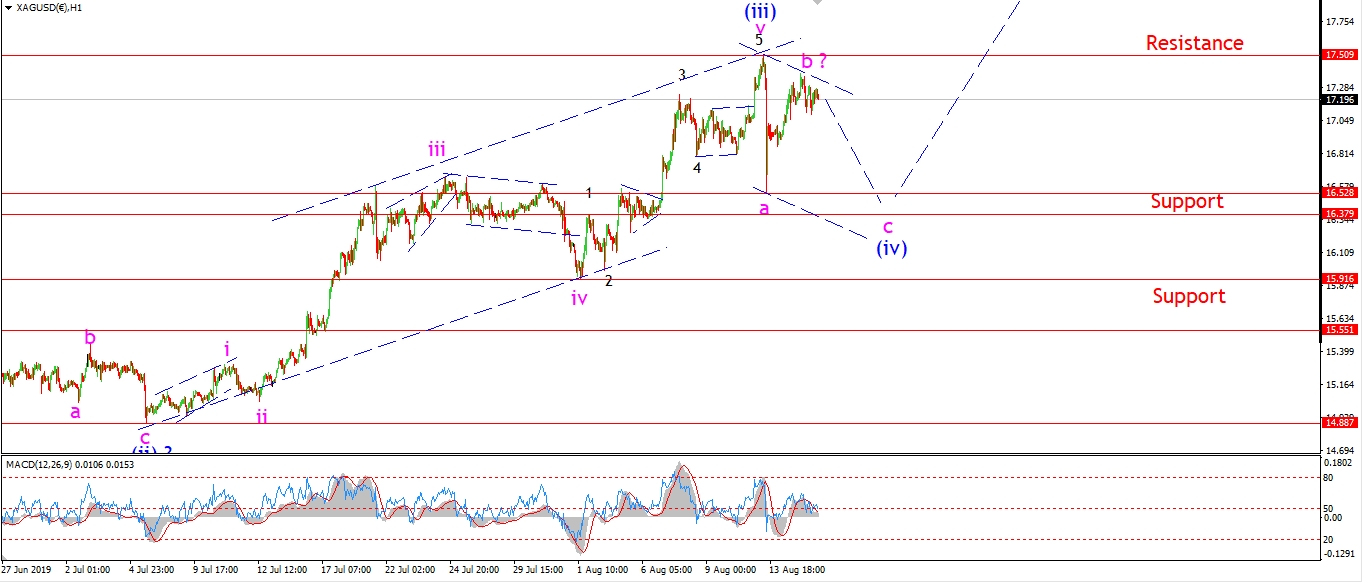 [/vc_column_text][/vc_column][vc_column width=”1/3″][vc_custom_heading text=”4 Hours” use_theme_fonts=”yes”][vc_column_text]
 [/vc_column_text][vc_custom_heading text=”Daily” use_theme_fonts=”yes”][vc_column_text]
 [/vc_column_text][/vc_column][/vc_row]
[vc_row][vc_column][vc_column_text]
It seems that Silver has now topped out in a lower high after a three wave rally.
This fits the action expected in wave ‘b’ of (iv),
and now we should see a further decline in wave ‘c’ of (ii) begin tomorrow.
If we see a break above 17.50 again,
that will invalidate the current short term pattern
and suggest that wave (iv) is creating a larger structure.
We will cross that bridge if we come to it!
Tomorrow;
Watch for Wave ‘c’ of (iv) to get going and fall back below 16.52 to complete.
[/vc_column_text][/vc_column][/vc_row]
[vc_row][vc_column][vc_separator border_width=”5″][/vc_column][/vc_row][vc_row][vc_column][vc_column_text]
S&P 500.
[/vc_column_text][/vc_column][/vc_row][vc_row][vc_column][vc_separator border_width=”5″][/vc_column][/vc_row][vc_row][vc_column width=”2/3″][vc_custom_heading text=”1 hr” use_theme_fonts=”yes”][vc_column_text]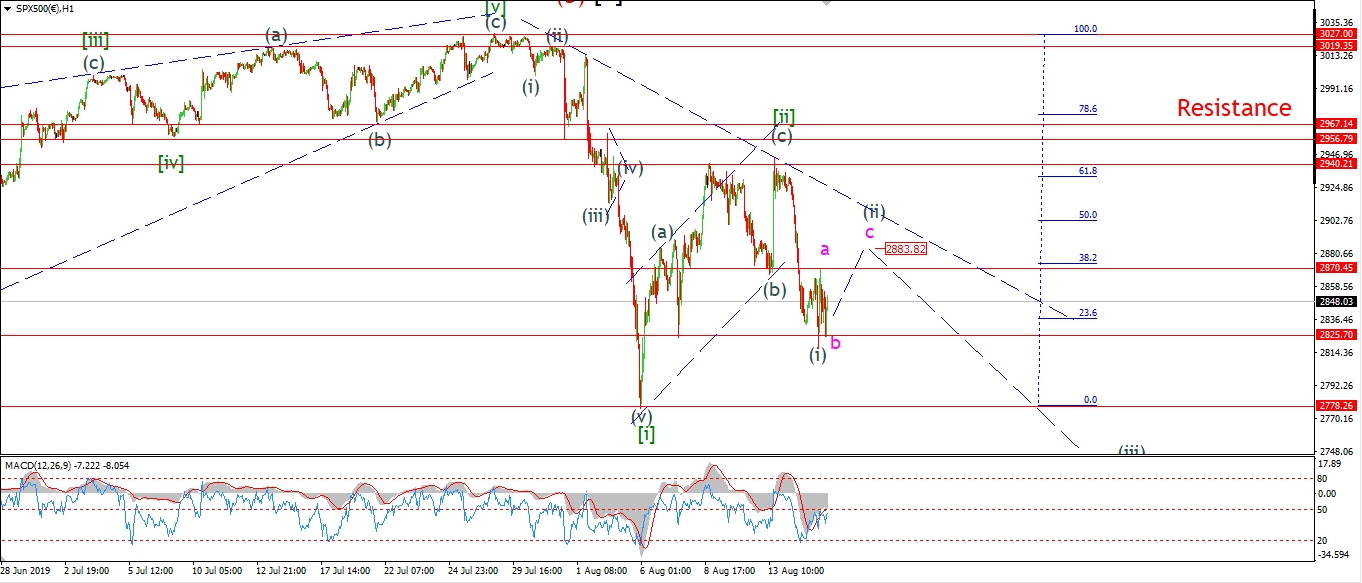 [/vc_column_text][/vc_column][vc_column width=”1/3″][vc_custom_heading text=”4 Hours” use_theme_fonts=”yes”][vc_column_text]
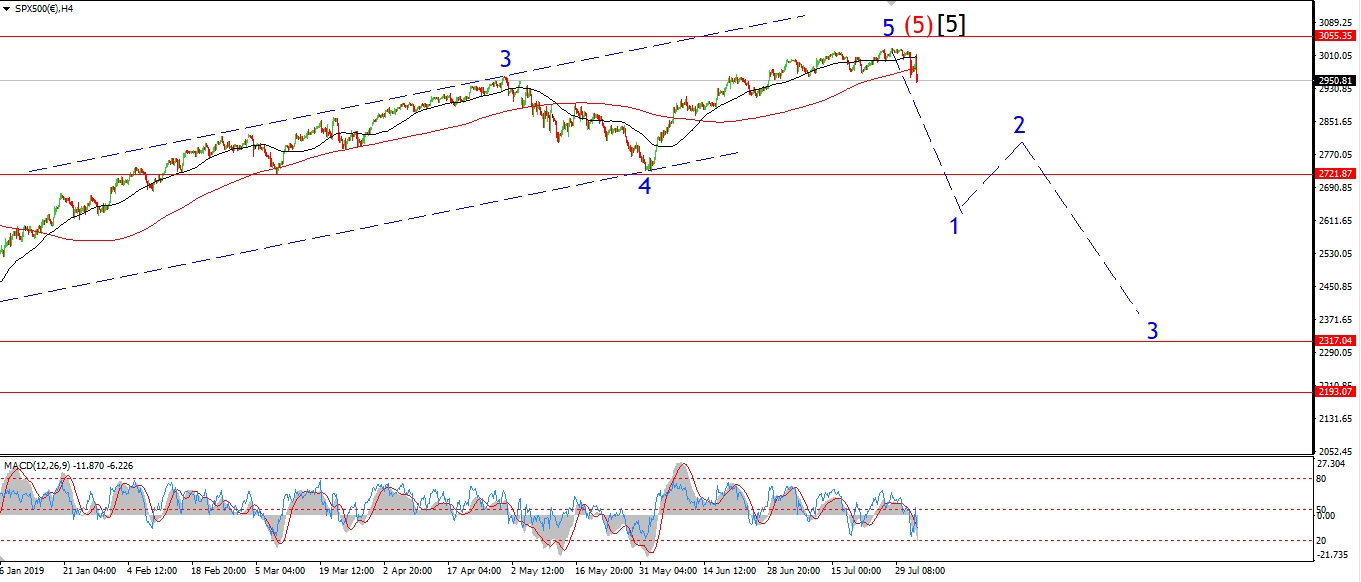 [/vc_column_text][vc_custom_heading text=”Daily” use_theme_fonts=”yes”][vc_column_text]
 [/vc_column_text][/vc_column][/vc_row]
[vc_row][vc_column][vc_column_text]
The S&P broke the interim low at 2825.70 by a hair today.
This fact does not confirm wave [iii] just yet.
But;
This action does lean heavily in favor of the very bearish outlook now.
We have a break of support after a five wave decline.
And the price seems to be correcting higher in five waves again.
I am viewing this rally as a three wave correction in wave (ii) of [iii].
The price should now rise in wave ‘c’ of (ii)
and break above the wave ‘a’ high at 2870 to complete the correction.
Tomorrow.
Watch for wave ‘c’ of (ii) to complete with a break of 2870.
Wave (ii) should hold below the declining trend line.
and then wave (iii) of [iii] will be ready to go.
[/vc_column_text][/vc_column][/vc_row]
[vc_row][vc_column][vc_separator border_width=”5″][/vc_column][/vc_row]