
[vc_row][vc_column][vc_separator border_width=”5″][/vc_column][/vc_row]
[vc_row][vc_column][vc_column_text]
Hello everyone,
I do hope you are well.
[/vc_column_text][/vc_column][/vc_row]
[vc_row][vc_column][vc_separator border_width=”5″][/vc_column][/vc_row]
[vc_row][vc_column][vc_column_text]
EURUSD
[/vc_column_text][/vc_column][/vc_row]
[vc_row][vc_column][vc_separator border_width=”5″][/vc_column][/vc_row][vc_row][vc_column width=”2/3″][vc_custom_heading text=”1 hr” use_theme_fonts=”yes”][vc_column_text]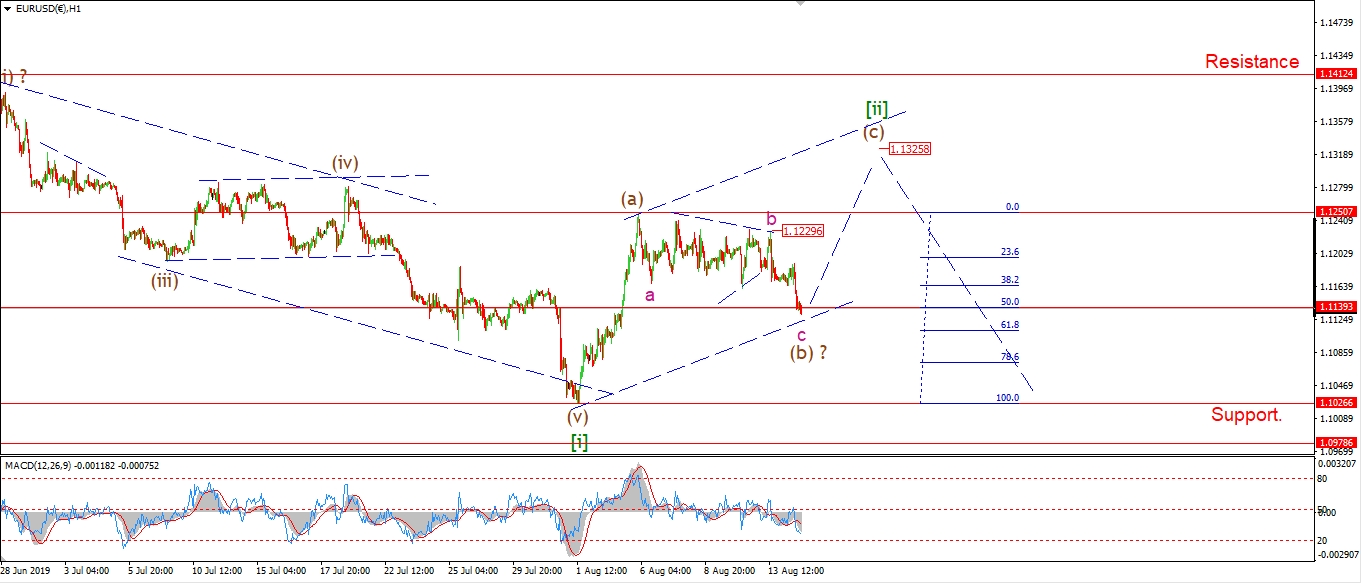 [/vc_column_text][/vc_column][vc_column width=”1/3″][vc_custom_heading text=”4 Hours” use_theme_fonts=”yes”][vc_column_text]
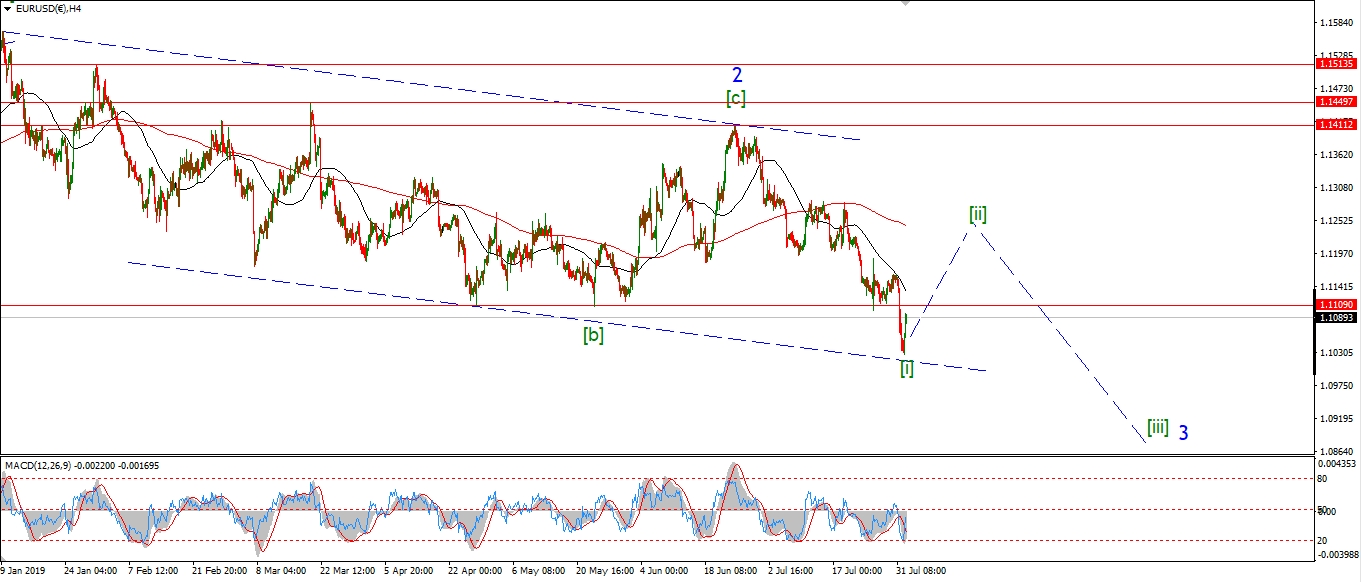 [/vc_column_text][vc_custom_heading text=”Daily” use_theme_fonts=”yes”][vc_column_text]
 [/vc_column_text][/vc_column][/vc_row]
[vc_row][vc_column][vc_column_text]
The triangle within wave (b) has created a larger structure than previously thought.
The price range continued to contract into Tuesdays high.
and that completed wave ‘b’ as shown.
The decline today is labelled as wave ‘c’ of (b),
And if wave ‘c’ traces out a five wave decline,
that will probably push the final low for wave (b) below 1.1100.
Then wave (c) should be ready to go and rally for the remainder of the week.
Tomorrow;
watch for wave (b) to complete and turn higher again into wave (c).
[/vc_column_text][/vc_column][/vc_row]
[vc_row][vc_column][vc_separator border_width=”5″][/vc_column][/vc_row][vc_row][vc_column][vc_column_text]
GBPUSD
[/vc_column_text][/vc_column][/vc_row][vc_row][vc_column][vc_separator border_width=”5″][/vc_column][/vc_row][vc_row][vc_column width=”2/3″][vc_custom_heading text=”1 hr” use_theme_fonts=”yes”][vc_column_text]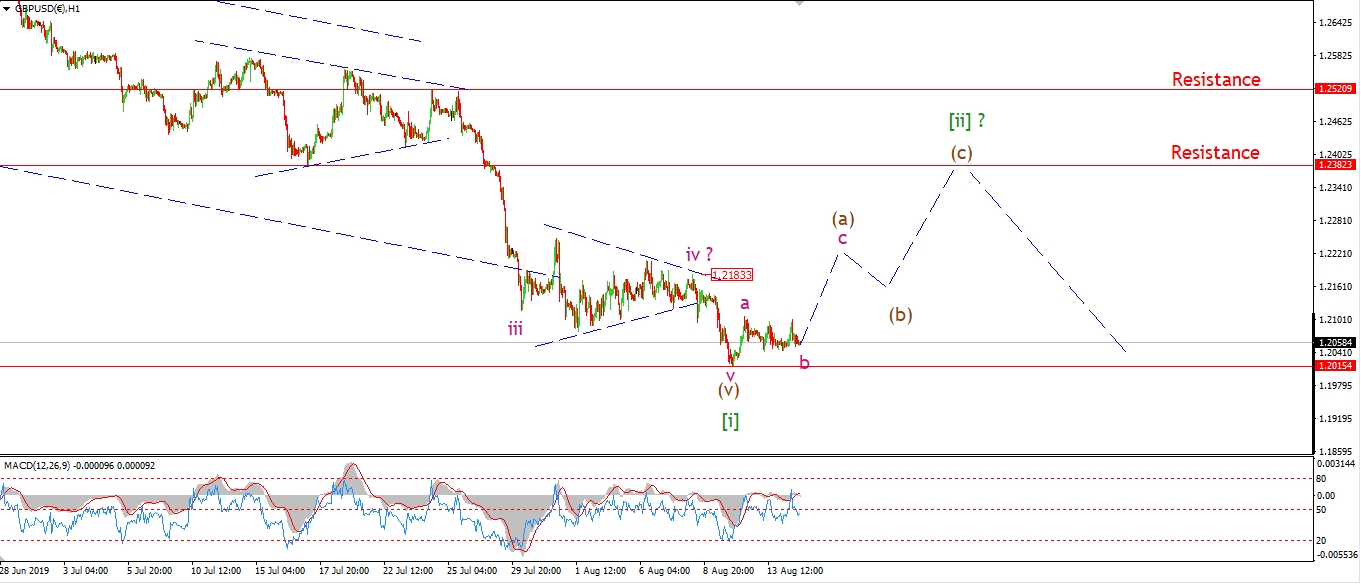 [/vc_column_text][/vc_column][vc_column width=”1/3″][vc_custom_heading text=”4 Hours” use_theme_fonts=”yes”][vc_column_text]
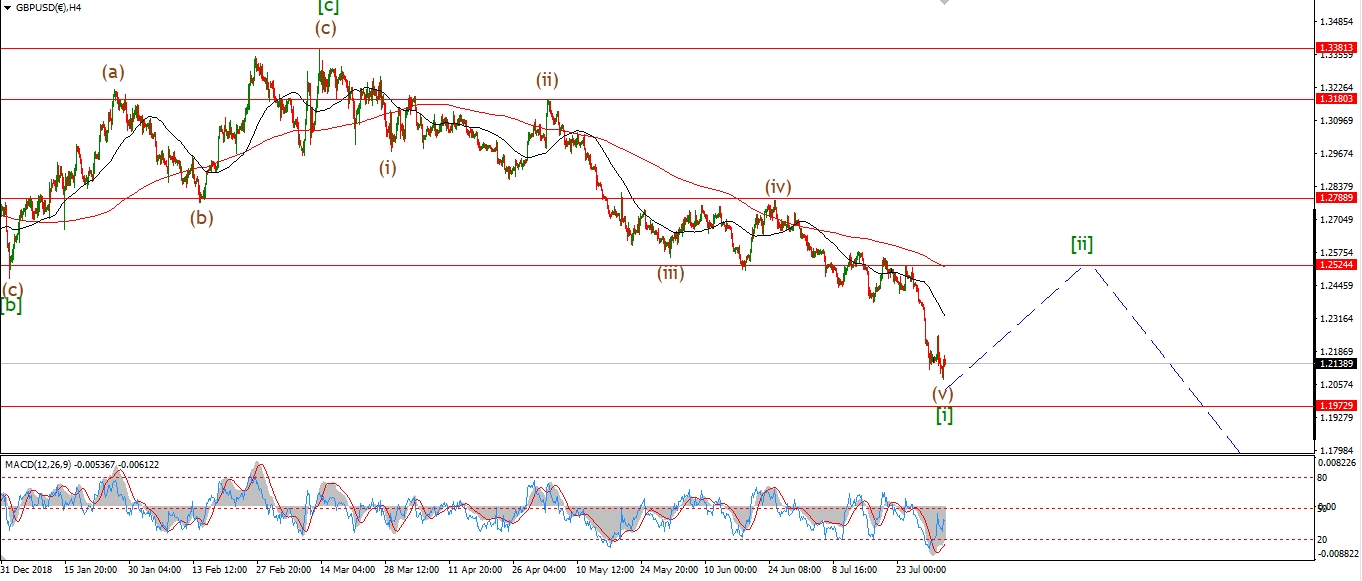 [/vc_column_text][vc_custom_heading text=”Daily” use_theme_fonts=”yes”][vc_column_text]
 [/vc_column_text][/vc_column][/vc_row]
[vc_row][vc_column][vc_column_text]
It is touch and go for cable right now!
The price continues to hold above 1.2015,
Although it is very close to call.
The price must rally now and break 1.2183 to confirm that wave [ii] has begun.
So I will take a step back for now and see what the action brings tomorrow.
Tomorrow;
watch for wave (a) to continue higher and 1.2183.
1.2015 must hold from here.
[/vc_column_text][/vc_column][/vc_row]
[vc_row][vc_column][vc_separator border_width=”5″][/vc_column][/vc_row][vc_row][vc_column][vc_column_text]
USDJPY
[/vc_column_text][/vc_column][/vc_row][vc_row][vc_column][vc_separator border_width=”5″][/vc_column][/vc_row][vc_row][vc_column width=”2/3″][vc_custom_heading text=”1 hr” use_theme_fonts=”yes”][vc_column_text]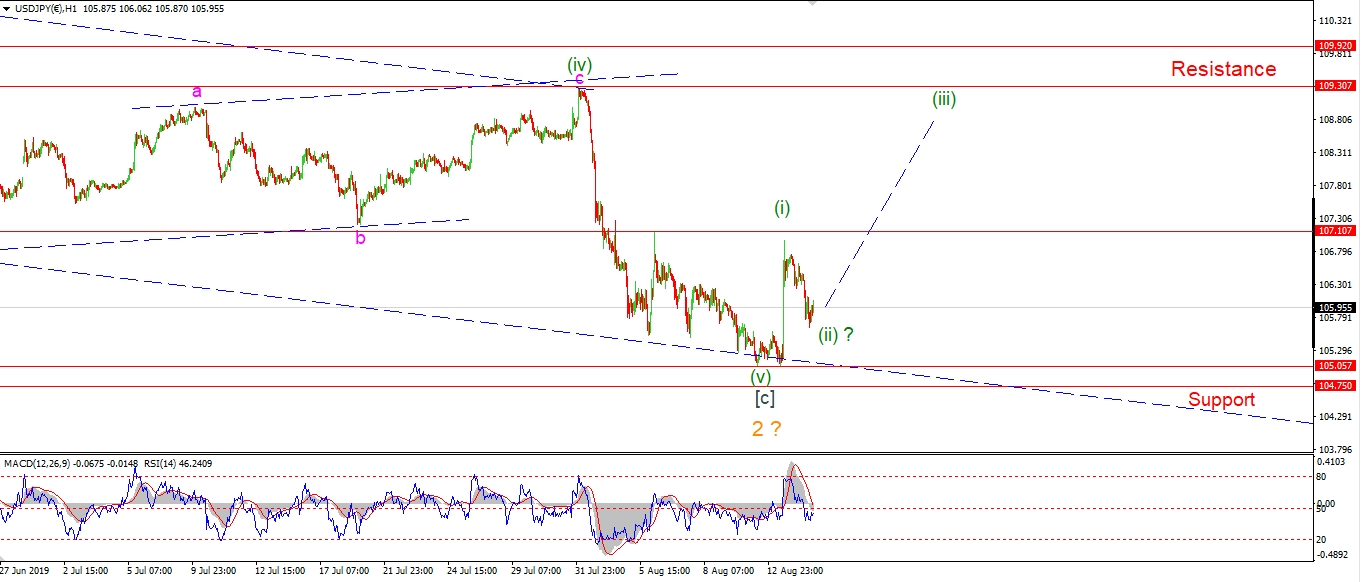 [/vc_column_text][/vc_column][vc_column width=”1/3″][vc_custom_heading text=”4 Hours” use_theme_fonts=”yes”][vc_column_text]
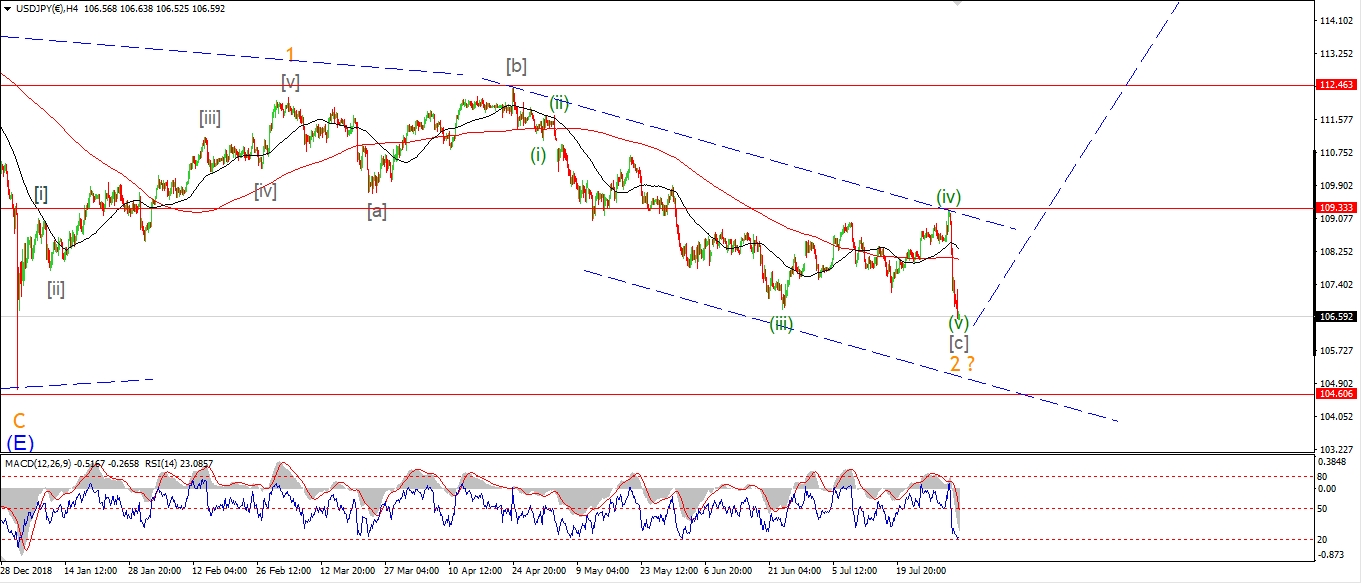 [/vc_column_text][vc_custom_heading text=”Daily” use_theme_fonts=”yes”][vc_column_text]
 [/vc_column_text][/vc_column][/vc_row]
[vc_row][vc_column][vc_column_text]
USDJPY has not broken the initial resistance yet.
Wave (i) came close yesterday,
but todays trade was all to the downside.
This could be wave (ii) as shown,
but we will need to see a rally above 107.10 tomorrow to signal that a significant low is in.
We are still in dangerous waters in USDJPY at the moment.
So I will wait for some confirming price action now to signal a turn is in.
Tomorrow;
105.05 must hold and wave (iii) must rally above 107.10 in order to save this bullish count.
[/vc_column_text][/vc_column][/vc_row]
[vc_row][vc_column][vc_separator border_width=”5″][/vc_column][/vc_row][vc_row][vc_column][vc_column_text]
DOW JONES INDUSTRIALS
[/vc_column_text][/vc_column][/vc_row][vc_row][vc_column][vc_separator border_width=”5″][/vc_column][/vc_row][vc_row][vc_column width=”2/3″][vc_custom_heading text=”1 hr” use_theme_fonts=”yes”][vc_column_text]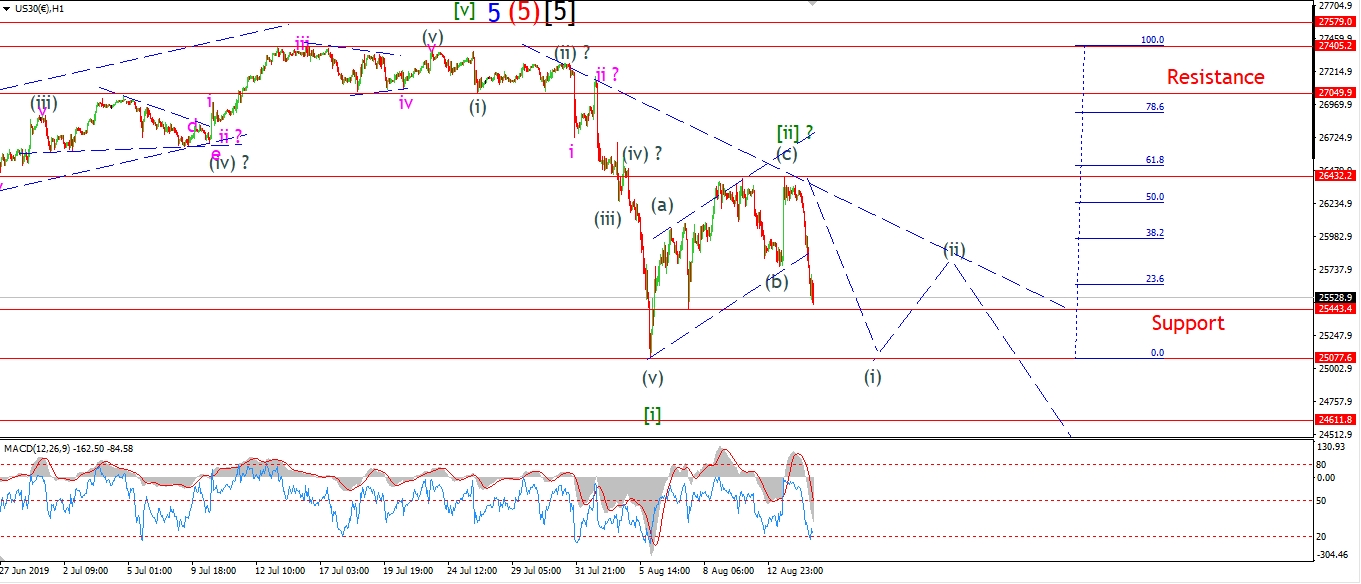 [/vc_column_text][/vc_column][vc_column width=”1/3″][vc_custom_heading text=”4 Hours” use_theme_fonts=”yes”][vc_column_text]
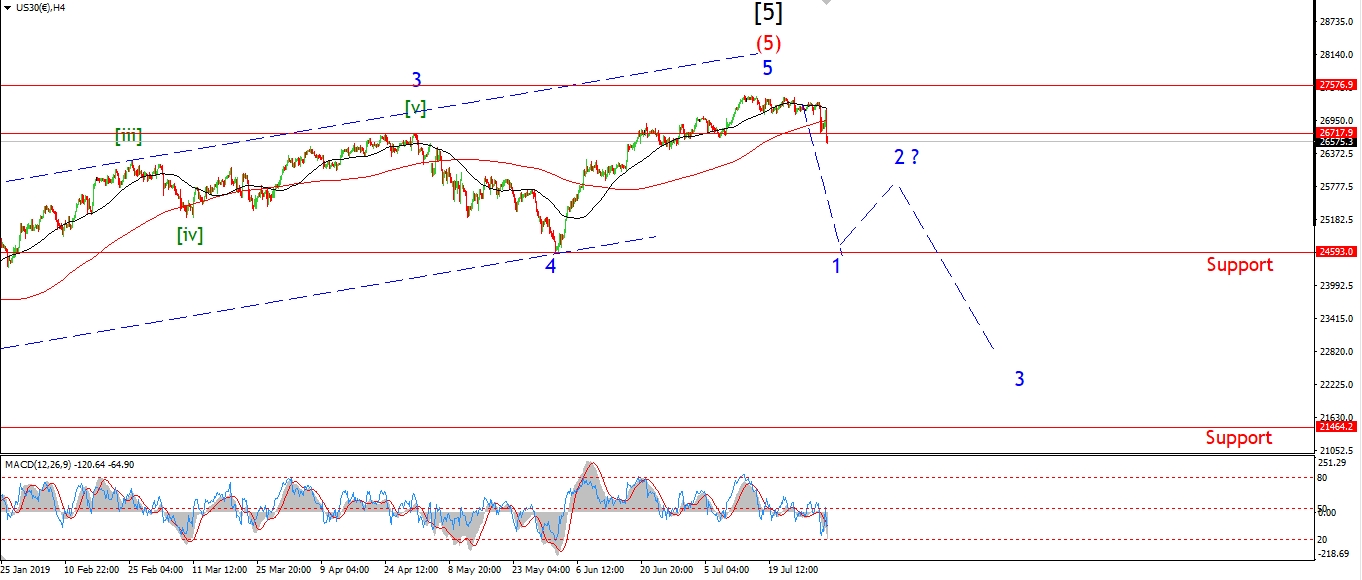 [/vc_column_text][vc_custom_heading text=”Daily” use_theme_fonts=”yes”][vc_column_text]
 [/vc_column_text][/vc_column][/vc_row]
[vc_row][vc_column][vc_column_text]
Today was an 800 point down day!
When I see a trade like that,
I always remember back about 15 years ago when a 100 point down day meant something!
Oh how inflation plays its little games.
The largest single day point drop in 2008 came in at 773!
That was the day of the Lehman collapse.
But of course there is nothing of the sort brewing now…………..
Todays decline is right in line with the beginning of a third wave down.
I have labelled this decline as wave (i) of [iii].
A break of 25443 would be a good sign that the turn is in.
And we may get that before wave (ii) begins.
The market should create another lower high in wave (ii) before turning down into wave (iii) of [iii].
So lets see if a correction begins in wave (ii) tomorrow.
Tomorrow;
Watch for a possible break of 25443 to complete wave (i) of [iii].
Any move off the low should be corrective and complete below 26400.
[/vc_column_text][/vc_column][/vc_row]
[vc_row][vc_column][vc_separator border_width=”5″][/vc_column][/vc_row][vc_row][vc_column][vc_column_text]
GOLD
[/vc_column_text][/vc_column][/vc_row][vc_row][vc_column][vc_separator border_width=”5″][/vc_column][/vc_row][vc_row][vc_column width=”2/3″][vc_custom_heading text=”1 hr” use_theme_fonts=”yes”][vc_column_text]
 [/vc_column_text][/vc_column][vc_column width=”1/3″][vc_custom_heading text=”4 Hours” use_theme_fonts=”yes”][vc_column_text]
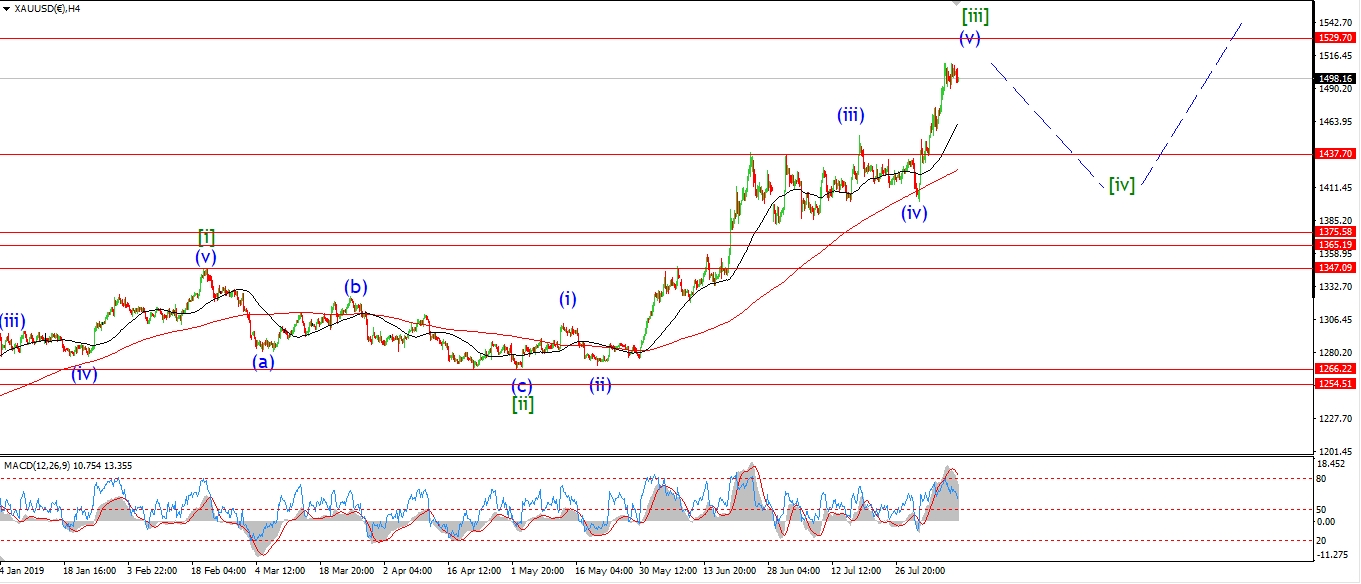 [/vc_column_text][vc_custom_heading text=”Daily” use_theme_fonts=”yes”][vc_column_text]
 [/vc_column_text][/vc_column][/vc_row]
[vc_row][vc_column][vc_column_text]
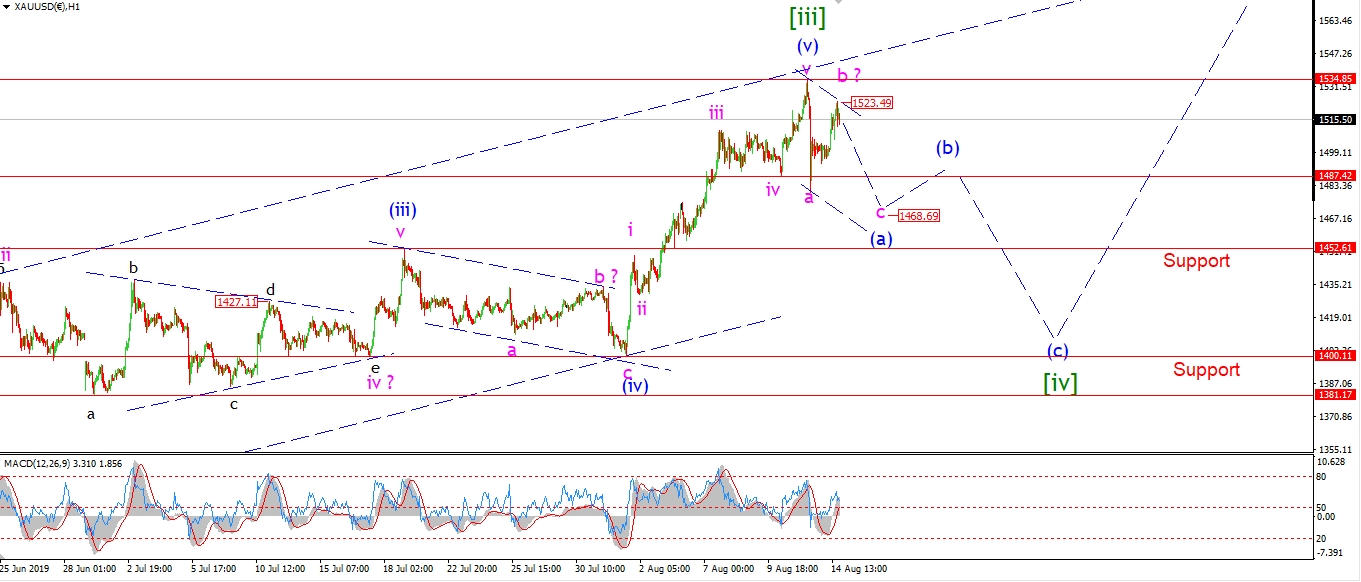
Gold has risen in three waves into todays high at 1523.
This action suggests a correction higher in wave ‘b’ as shown.
The price is declining again this evening,
so this may be the beginning of wave ‘c’ of (a).
If wave ‘c’ reaches equality with wave ‘a’,
that suggests decline to about 1470 in wave ‘c’,
to complete a three wave pattern in wave (a) blue.
Tomorrow;
Watch for 1523 to hold and wave (a) to complete a three wave decline with another decline towards the trend channel line again.
[/vc_column_text][/vc_column][/vc_row]
[vc_row][vc_column][vc_separator border_width=”5″][/vc_column][/vc_row][vc_row][vc_column][vc_column_text]
U.S CRUDE OIL
[/vc_column_text][/vc_column][/vc_row][vc_row][vc_column][vc_separator border_width=”5″][/vc_column][/vc_row][vc_row][vc_column width=”2/3″][vc_custom_heading text=”1 hr” use_theme_fonts=”yes”][vc_column_text]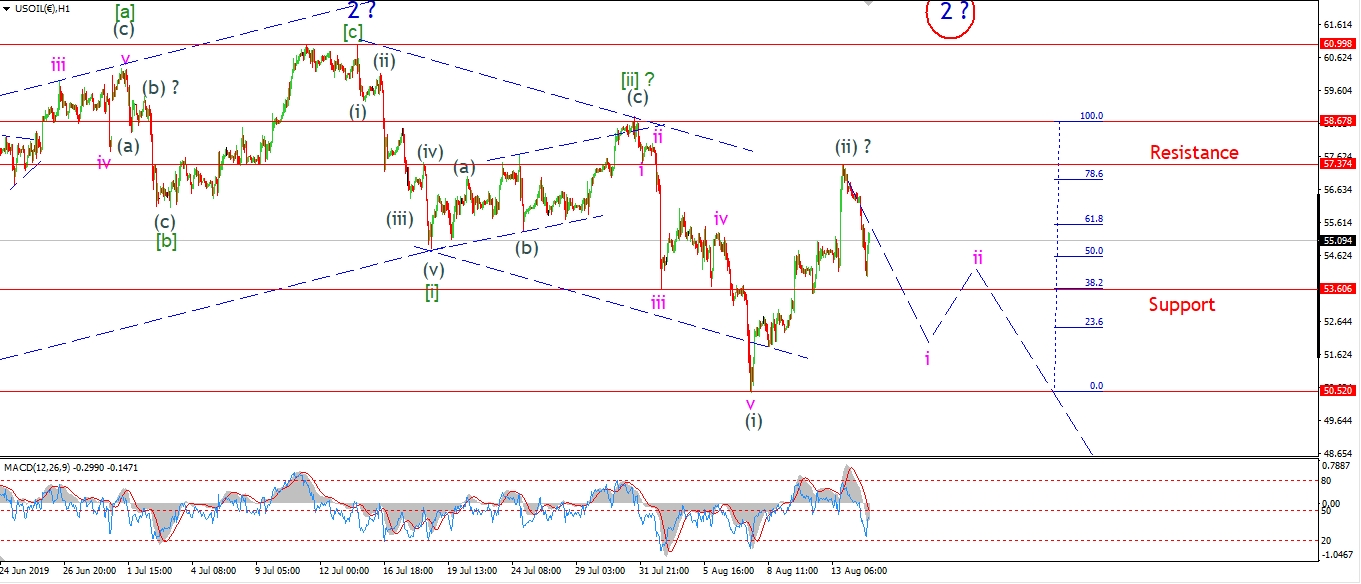 [/vc_column_text][/vc_column][vc_column width=”1/3″][vc_custom_heading text=”4 Hours” use_theme_fonts=”yes”][vc_column_text]
 [/vc_column_text][vc_custom_heading text=”Daily” use_theme_fonts=”yes”][vc_column_text]
 [/vc_column_text][/vc_column][/vc_row]
[vc_row][vc_column][vc_column_text]
Crude fell along with stocks today in a nice sharp impulsive move.
This action is in line with the current wave count,
and we are now looking at a possible move into a larger degree wave (iii) of [iii] scenario.
If this is correct,
then any corrections to the upside should be minimal from here,
and the price may well accelerate lower over the coming week in wave [iii].
If the price falls below 50.50 over the coming few sessions,
that should be enough to rule out the alternate count I spoke about last night.
Tomorrow;
57.37 should hold from here.
Watch for wave ‘i’ of (iii) to push below 53.00 again before correcting in wave ‘ii’.
[/vc_column_text][/vc_column][/vc_row]
[vc_row][vc_column][vc_separator border_width=”5″][/vc_column][/vc_row][vc_row][vc_column][vc_column_text]
US 10 yr Treasuries.
[/vc_column_text][/vc_column][/vc_row][vc_row][vc_column][vc_separator border_width=”5″][/vc_column][/vc_row][vc_row][vc_column width=”2/3″][vc_custom_heading text=”1 hr” use_theme_fonts=”yes”][vc_column_text]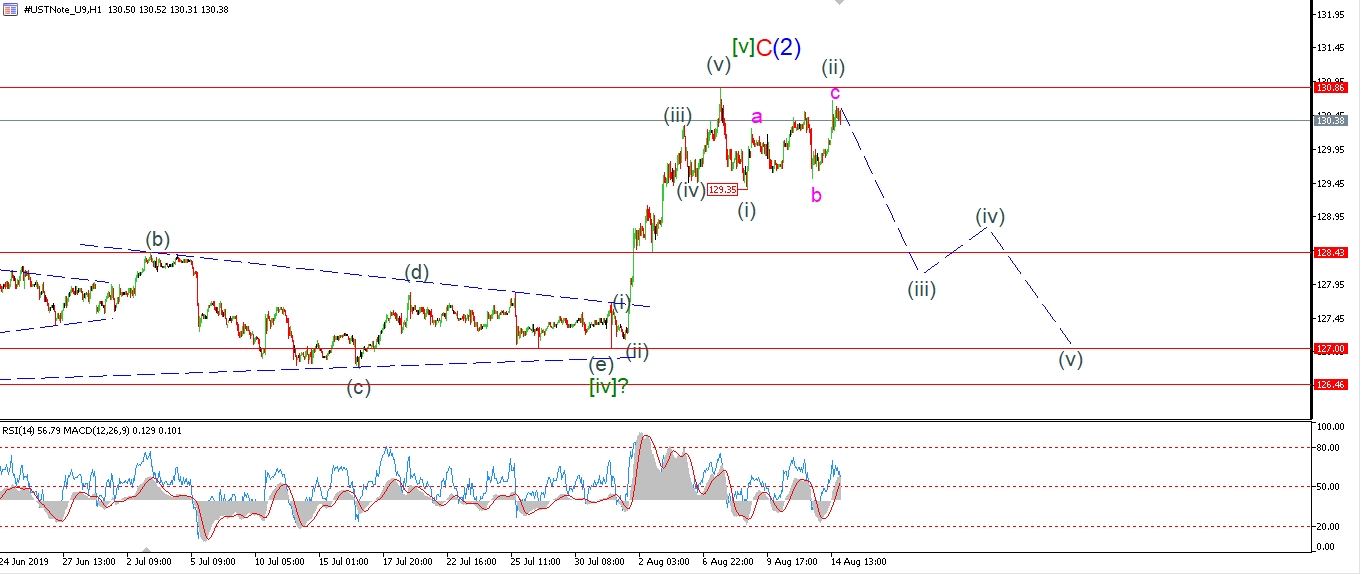 [/vc_column_text][/vc_column][vc_column width=”1/3″][vc_custom_heading text=”4 Hours” use_theme_fonts=”yes”][vc_column_text]
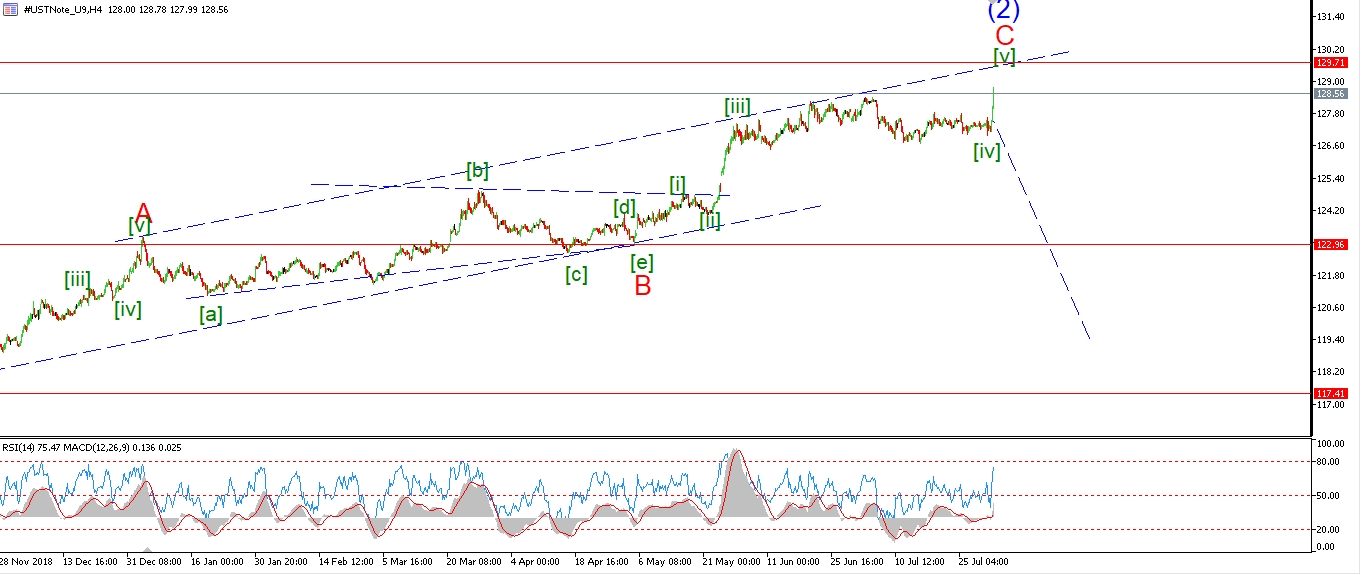 [/vc_column_text][vc_custom_heading text=”Daily” use_theme_fonts=”yes”][vc_column_text]
 [/vc_column_text][/vc_column][/vc_row]
[vc_row][vc_column][vc_column_text]
Traders rushed from the frying pan into the fire today when stocks sold off!
The bond market caught its usual bid off the back of that weakness,
but we have not broken out of the current bearish setup just yet.
Only a break of 130.86 will rule out the current wave count
but even that will only postpone the decline temporarily.
Wave (3) down will come in eventually and it should prove devastating.
Tomorrow;
Watch for wave (ii) to hold below 130.86,
Price should return lower into wave (iii) tomorrow.
[/vc_column_text][/vc_column][/vc_row]
[vc_row][vc_column][vc_separator border_width=”5″][/vc_column][/vc_row][vc_row][vc_column][vc_column_text]
SILVER
[/vc_column_text][/vc_column][/vc_row][vc_row][vc_column][vc_separator border_width=”5″][/vc_column][/vc_row][vc_row][vc_column width=”2/3″][vc_custom_heading text=”1 hr” use_theme_fonts=”yes”][vc_column_text]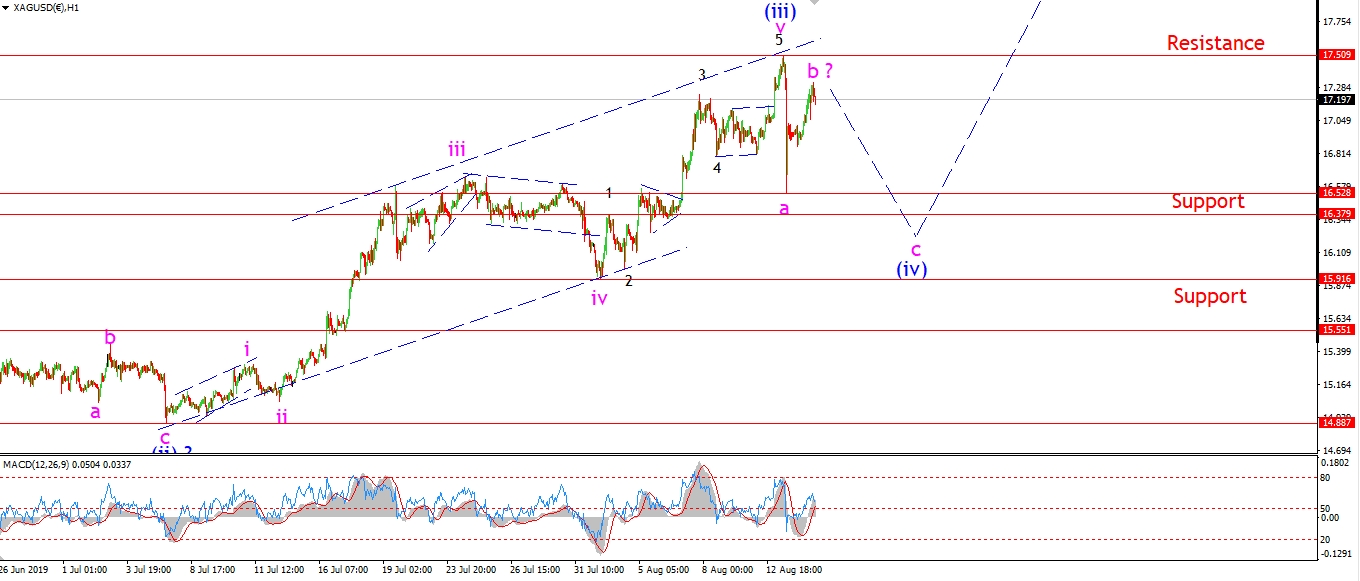 [/vc_column_text][/vc_column][vc_column width=”1/3″][vc_custom_heading text=”4 Hours” use_theme_fonts=”yes”][vc_column_text]
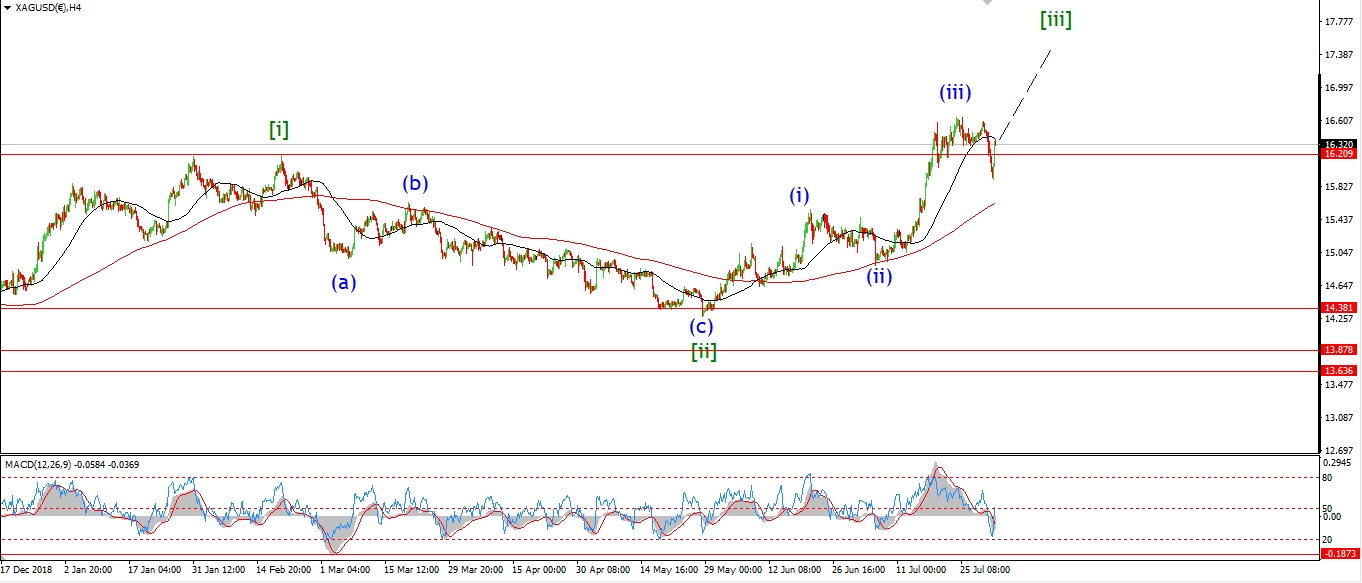 [/vc_column_text][vc_custom_heading text=”Daily” use_theme_fonts=”yes”][vc_column_text]
 [/vc_column_text][/vc_column][/vc_row]
[vc_row][vc_column][vc_column_text]
Silver has created the same three wave retracement today as in gold.
This is labelled as wave ‘b’ of (iv) in silver.
This wave count is one degree lower in silver,
so I do expect a little move upside to close out wave (v) of [iii] next week.
for the moment,
I expect wave ‘c’ of (iv) to create a new low below 16.52 to complete a three wave decline.
tomorrow;
Watch for wave ‘c’ to return lower and break 16.52 at a minimum.
[/vc_column_text][/vc_column][/vc_row]
[vc_row][vc_column][vc_separator border_width=”5″][/vc_column][/vc_row][vc_row][vc_column][vc_column_text]
S&P 500.
[/vc_column_text][/vc_column][/vc_row][vc_row][vc_column][vc_separator border_width=”5″][/vc_column][/vc_row][vc_row][vc_column width=”2/3″][vc_custom_heading text=”1 hr” use_theme_fonts=”yes”][vc_column_text]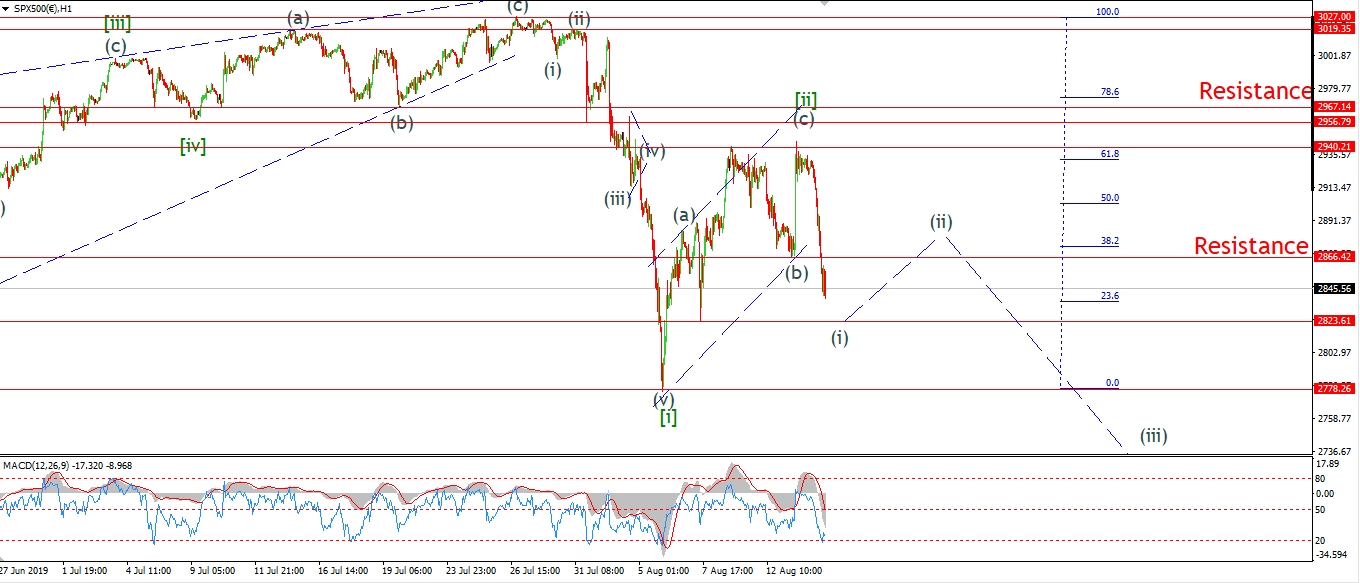 [/vc_column_text][/vc_column][vc_column width=”1/3″][vc_custom_heading text=”4 Hours” use_theme_fonts=”yes”][vc_column_text]
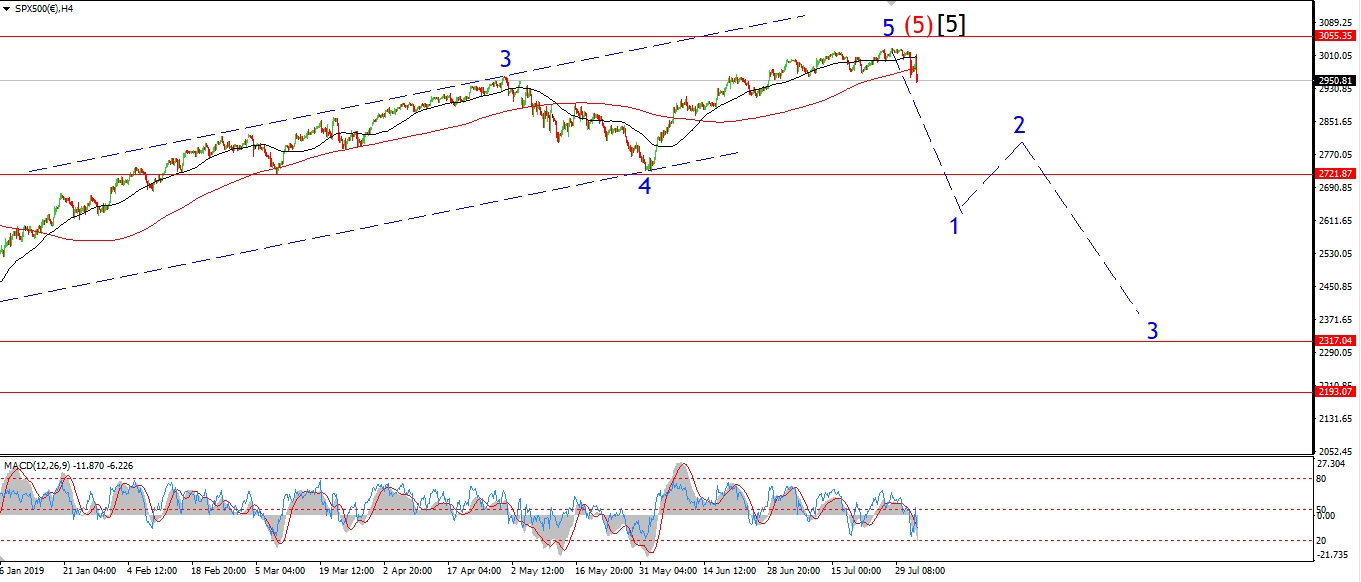 [/vc_column_text][vc_custom_heading text=”Daily” use_theme_fonts=”yes”][vc_column_text]
 [/vc_column_text][/vc_column][/vc_row]
[vc_row][vc_column][vc_column_text]
The S&P sold off heavily today also to begin the slide into wave [iii] down.
The market broke through the previous wave (b) low at 2866 this afternoon,
and now we are hovering near the lows of the session at the close.
I am looking at that 2823 level for a low to form in wave (i) of [iii].
A break of that level will seriously favor the bearish setup in this wave count.
And a lower high after a break will signal that wave (iii) of [iii] will be ready to go.
Tomorrow;
Watch for wave (i) down to complete,
preferably with a break of the next minor support at 2823.
A lower high in wave (ii) will probably begin tomorrow.
[/vc_column_text][/vc_column][/vc_row]
[vc_row][vc_column][vc_separator border_width=”5″][/vc_column][/vc_row]