
[vc_row][vc_column][vc_separator border_width=”5″][/vc_column][/vc_row]
[vc_row][vc_column][vc_column_text]
Good evening to one and all.
[/vc_column_text][/vc_column][/vc_row]
[vc_row][vc_column][vc_separator border_width=”5″][/vc_column][/vc_row]
[vc_row][vc_column][vc_column_text]
EURUSD
[/vc_column_text][/vc_column][/vc_row]
[vc_row][vc_column][vc_separator border_width=”5″][/vc_column][/vc_row][vc_row][vc_column width=”2/3″][vc_custom_heading text=”1 hr” use_theme_fonts=”yes”][vc_column_text]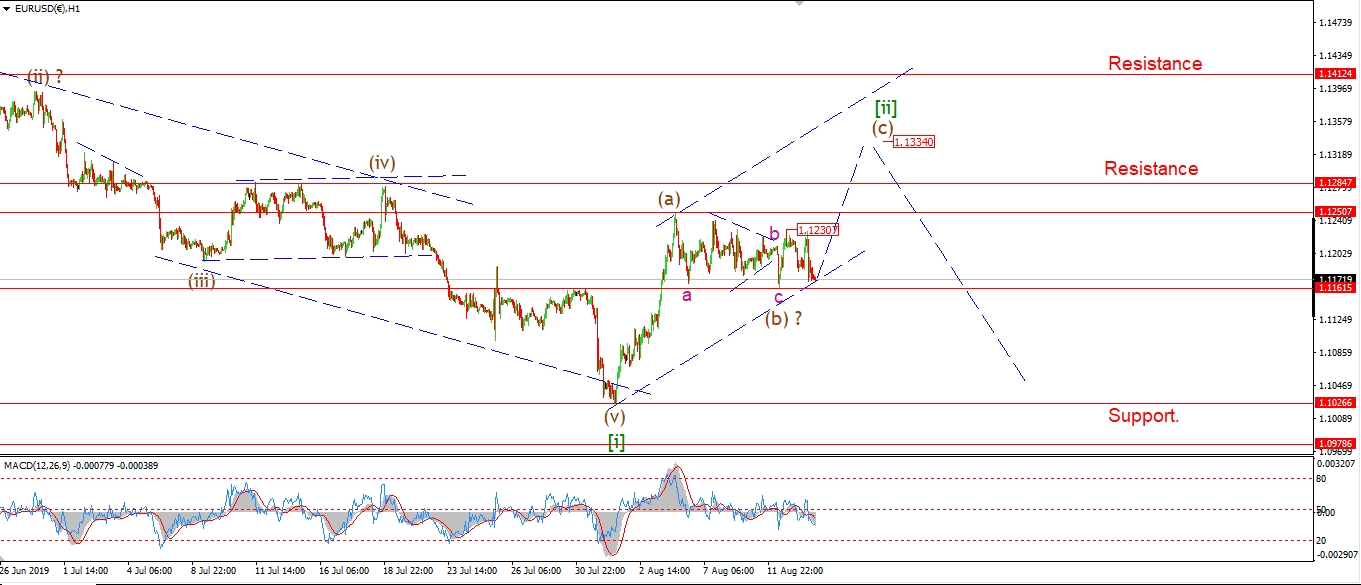 [/vc_column_text][/vc_column][vc_column width=”1/3″][vc_custom_heading text=”4 Hours” use_theme_fonts=”yes”][vc_column_text]
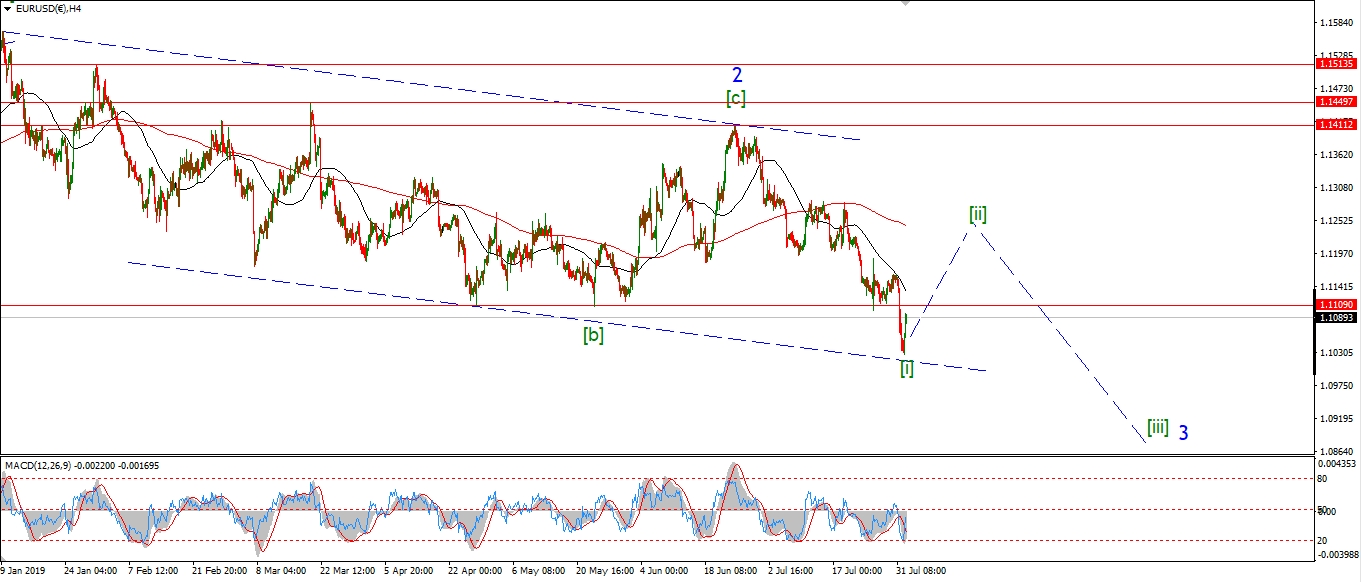 [/vc_column_text][vc_custom_heading text=”Daily” use_theme_fonts=”yes”][vc_column_text]
 [/vc_column_text][/vc_column][/vc_row]
[vc_row][vc_column][vc_column_text]
So far we have a three wave decline off Mondays high at 1.1230.
This can be counted as a small correction within wave (c) for now.
But the price must hold above 1.1161.
If 1.1173 breaks,
that will signal that wave (b) is extending to larger structure.
Possibly a complex correction such as a triple combination wave,
This will drag the correction on for another few days in wave (b).
Tomorrow;
Watch for 1.1161 to hold and wave (c) to push higher.
A break of 1.1230 will signal wave (c) has begun.
[/vc_column_text][/vc_column][/vc_row]
[vc_row][vc_column][vc_separator border_width=”5″][/vc_column][/vc_row][vc_row][vc_column][vc_column_text]
GBPUSD
[/vc_column_text][/vc_column][/vc_row][vc_row][vc_column][vc_separator border_width=”5″][/vc_column][/vc_row][vc_row][vc_column width=”2/3″][vc_custom_heading text=”1 hr” use_theme_fonts=”yes”][vc_column_text] [/vc_column_text][/vc_column][vc_column width=”1/3″][vc_custom_heading text=”4 Hours” use_theme_fonts=”yes”][vc_column_text]
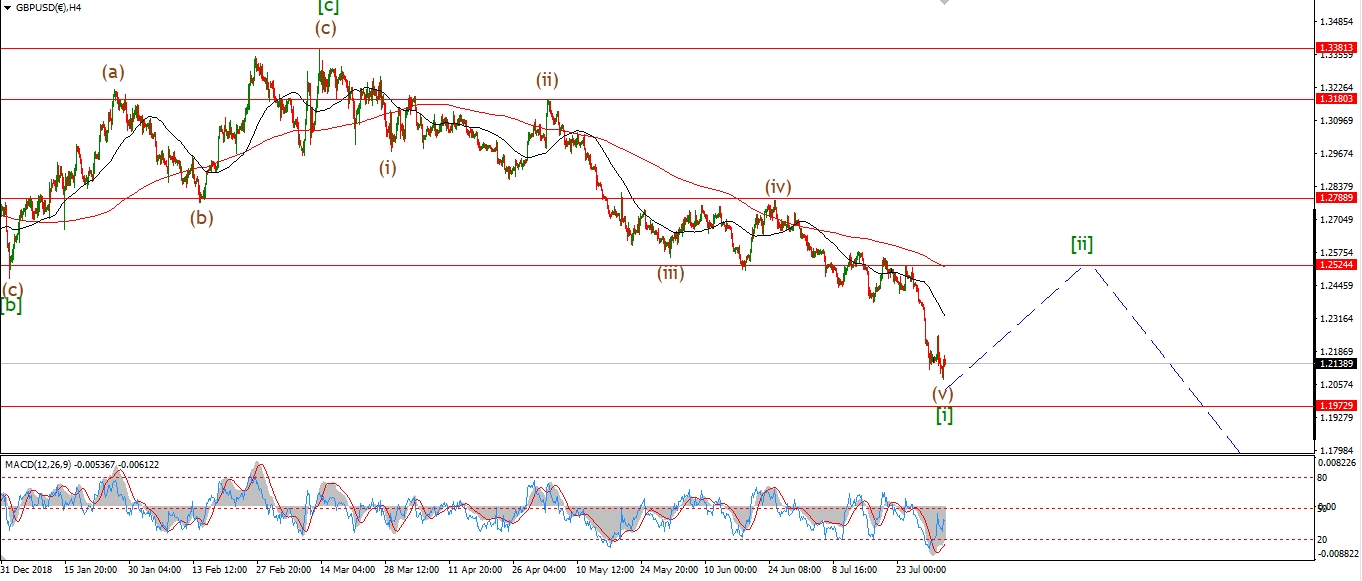 [/vc_column_text][vc_custom_heading text=”Daily” use_theme_fonts=”yes”][vc_column_text]
 [/vc_column_text][/vc_column][/vc_row]
[vc_row][vc_column][vc_column_text]
Cable is holding above the low of wave [i] at 1.2015 for the moment.
The action today does look corrective in a possible wave ‘ii’ pink.
Only a push above 1.2183 will confirm wave (a) is underway,
so we are again stuck in limbo for the moment.
I have shown a five wave rally expected in wave (a),
but a three wave rally is just as likely,
in which case wave [ii] will be a flat correction.
Tomorrow;
Watch for wave (a) to continue higher and break 1.2183 to confirm wave [ii] has begun.
[/vc_column_text][/vc_column][/vc_row]
[vc_row][vc_column][vc_separator border_width=”5″][/vc_column][/vc_row][vc_row][vc_column][vc_column_text]
USDJPY
[/vc_column_text][/vc_column][/vc_row][vc_row][vc_column][vc_separator border_width=”5″][/vc_column][/vc_row][vc_row][vc_column width=”2/3″][vc_custom_heading text=”1 hr” use_theme_fonts=”yes”][vc_column_text]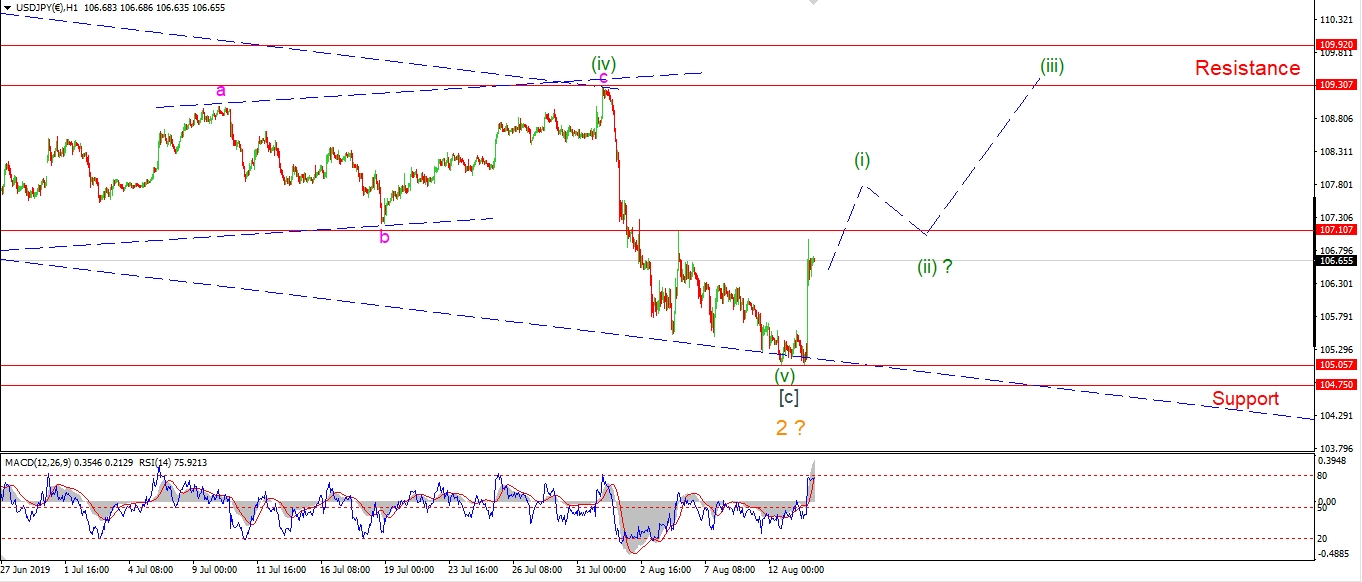 [/vc_column_text][/vc_column][vc_column width=”1/3″][vc_custom_heading text=”4 Hours” use_theme_fonts=”yes”][vc_column_text]
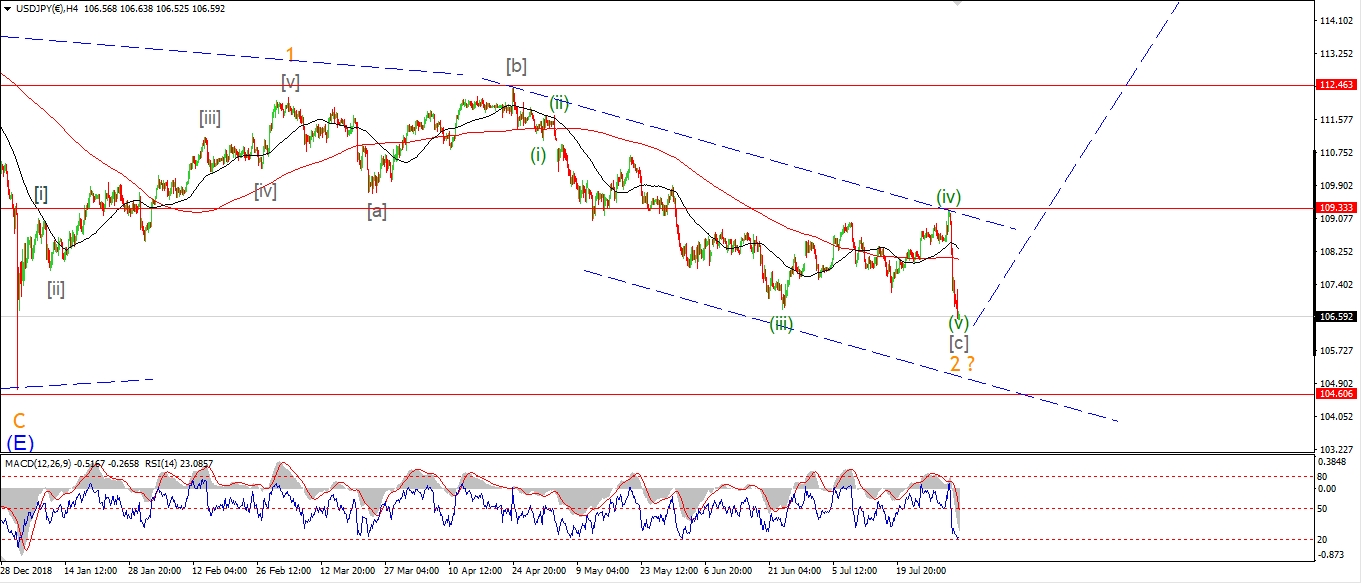 [/vc_column_text][vc_custom_heading text=”Daily” use_theme_fonts=”yes”][vc_column_text]
 [/vc_column_text][/vc_column][/vc_row]
[vc_row][vc_column][vc_column_text]
I think that rally was reasonably convincing don’t you!
We are now out of the woods at all yet,
but the price has held above that critical support at 104.75
and spiked higher impulsively.
This action is enough to put a stay of execution on the bullish count for now.
Tomorrow;
What we need from this point is straight forward.
A five wave rally higher and a break of 109.30 to signal the larger turn is in play.
Lets see if we get a push above 107.10 first,
and then a correction in wave (ii).
104.75 must hold.
[/vc_column_text][/vc_column][/vc_row]
[vc_row][vc_column][vc_separator border_width=”5″][/vc_column][/vc_row][vc_row][vc_column][vc_column_text]
DOW JONES INDUSTRIALS
[/vc_column_text][/vc_column][/vc_row][vc_row][vc_column][vc_separator border_width=”5″][/vc_column][/vc_row][vc_row][vc_column width=”2/3″][vc_custom_heading text=”1 hr” use_theme_fonts=”yes”][vc_column_text]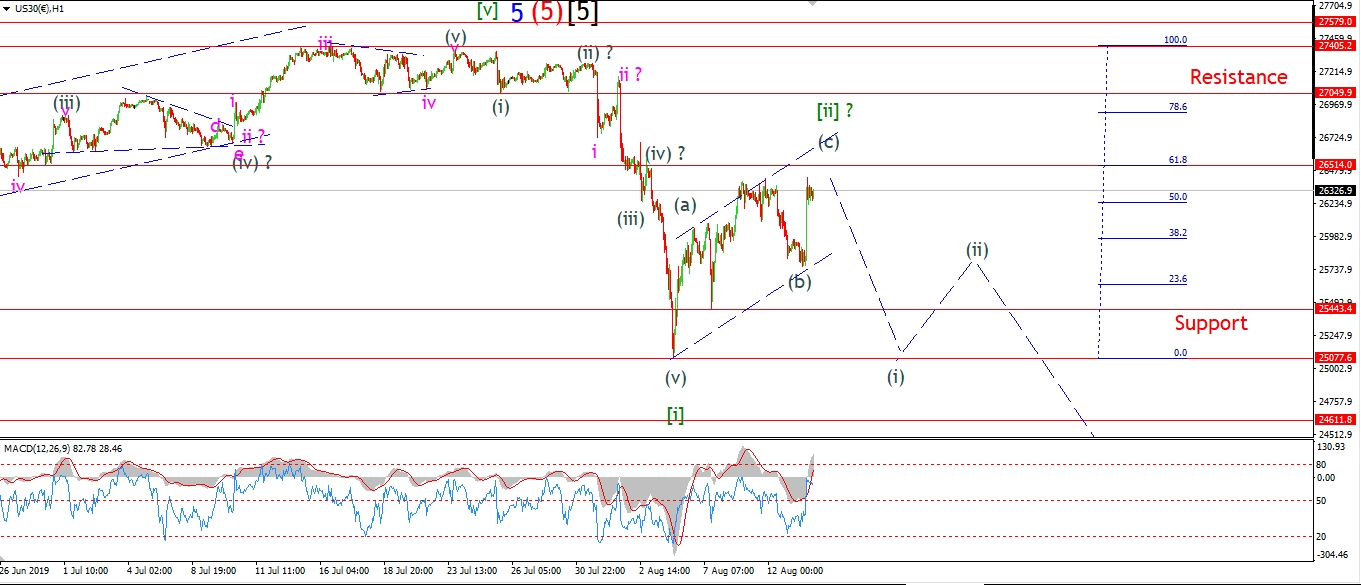 [/vc_column_text][/vc_column][vc_column width=”1/3″][vc_custom_heading text=”4 Hours” use_theme_fonts=”yes”][vc_column_text]
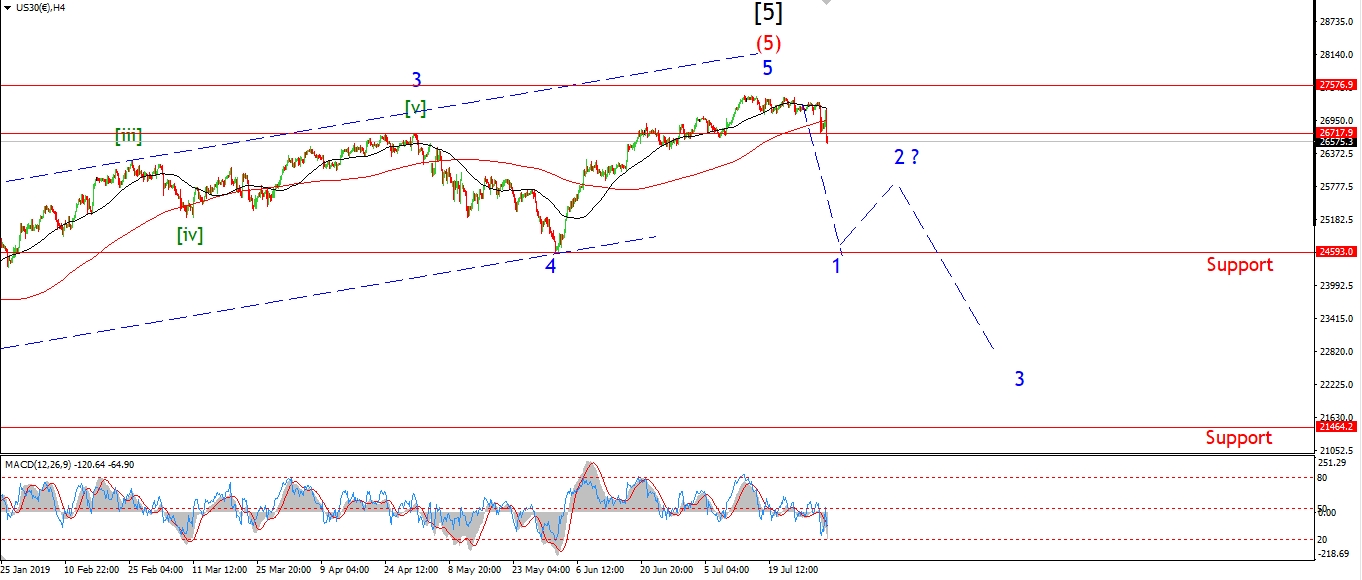 [/vc_column_text][vc_custom_heading text=”Daily” use_theme_fonts=”yes”][vc_column_text]
 [/vc_column_text][/vc_column][/vc_row]
[vc_row][vc_column][vc_column_text]
I have switched to the alternate count this evening after todays rally.
There was only a slight new high today by 13 points.
But that is enough to break the previous pattern.
The rally to date off the wave [i] low is still best viewed as a three wave correction in wave [ii].
The price is still completing wave (c) of [ii],
and when it does,
we should see a rapid decline again in wave [iii].
Wave [iii] will start with the formation of another lower high below 26000 with waves (i) and (ii).
At the moment it is a waiting game to see when wave (c) completes.
The price is holding below the 62% retracement level this evening,
And the minimum target for wave (c) has been met.
Tomorrow;
wave for wave (c) to top out.
We should see another spike lower to begin wave (i) soon.
[/vc_column_text][/vc_column][/vc_row]
[vc_row][vc_column][vc_separator border_width=”5″][/vc_column][/vc_row][vc_row][vc_column][vc_column_text]
GOLD
[/vc_column_text][/vc_column][/vc_row][vc_row][vc_column][vc_separator border_width=”5″][/vc_column][/vc_row][vc_row][vc_column width=”2/3″][vc_custom_heading text=”1 hr” use_theme_fonts=”yes”][vc_column_text]
 [/vc_column_text][/vc_column][vc_column width=”1/3″][vc_custom_heading text=”4 Hours” use_theme_fonts=”yes”][vc_column_text]
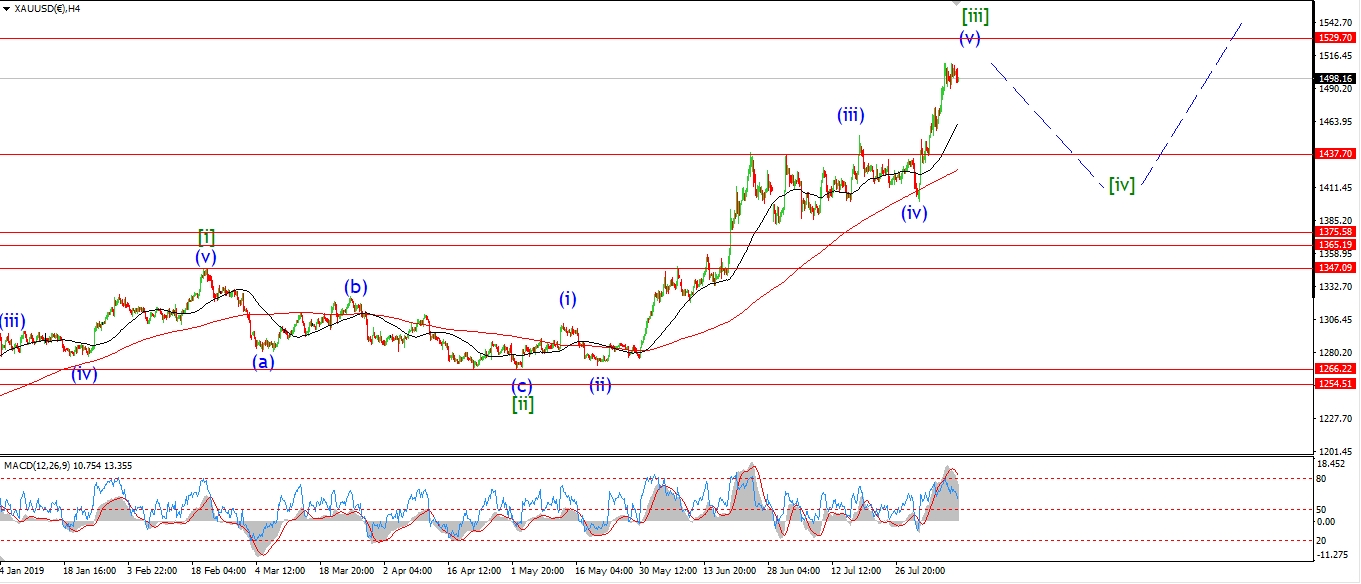 [/vc_column_text][vc_custom_heading text=”Daily” use_theme_fonts=”yes”][vc_column_text]
 [/vc_column_text][/vc_column][/vc_row]
[vc_row][vc_column][vc_column_text]
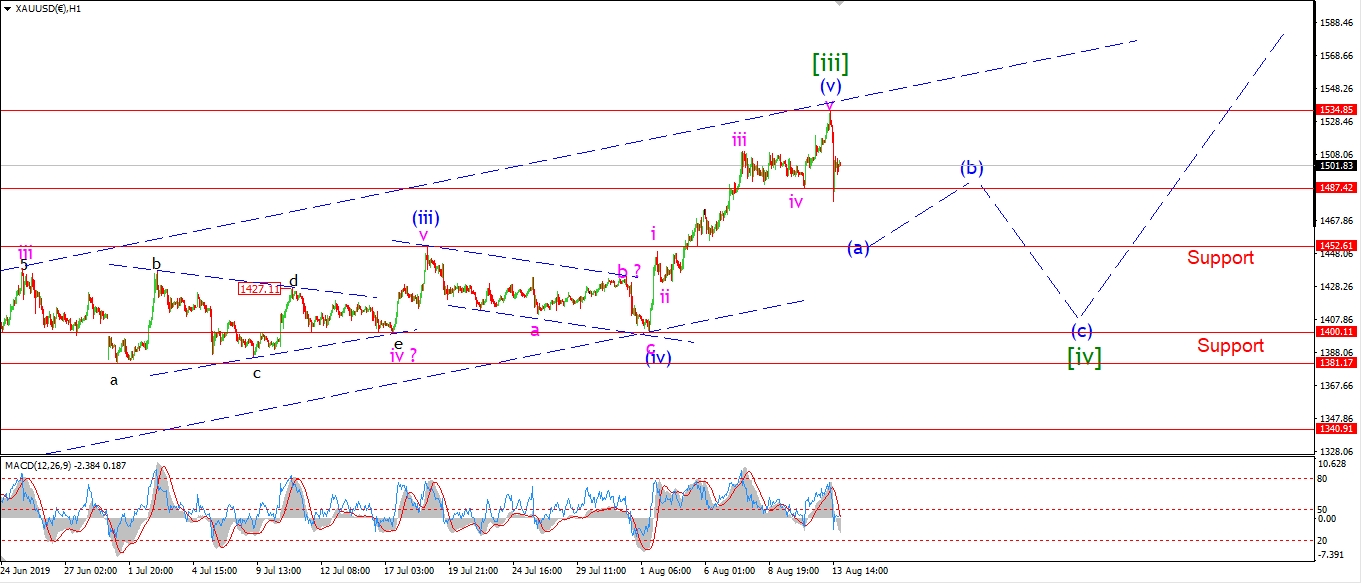
I have switched to the alternate count in Gold also today.
I think it worthwhile considering a larger correction in wave [iv] over the coming few weeks.
Given the current short term overbought scenario.
The price did push the above 1530 again today
as the pattern suggested last night.
Price almost reached the upper trend channel line also,
but was hit with a sharp spike lower early today to begin what should be wave (a) of [iv].
It is impossible to know how wave [iv] is going to play out now,
all we can say is that wave [ii] was a flat correction,
so wave [iv] should deviate from that pattern,
A triangle is common for a fourth wave, but we will see soon enough.
Tomorrow;
Watch for wave (a) of [iv] to trace out at least a three wave drop off the high,
with initial support at 1450.
[/vc_column_text][/vc_column][/vc_row]
[vc_row][vc_column][vc_separator border_width=”5″][/vc_column][/vc_row][vc_row][vc_column][vc_column_text]
U.S CRUDE OIL
[/vc_column_text][/vc_column][/vc_row][vc_row][vc_column][vc_separator border_width=”5″][/vc_column][/vc_row][vc_row][vc_column width=”2/3″][vc_custom_heading text=”1 hr” use_theme_fonts=”yes”][vc_column_text]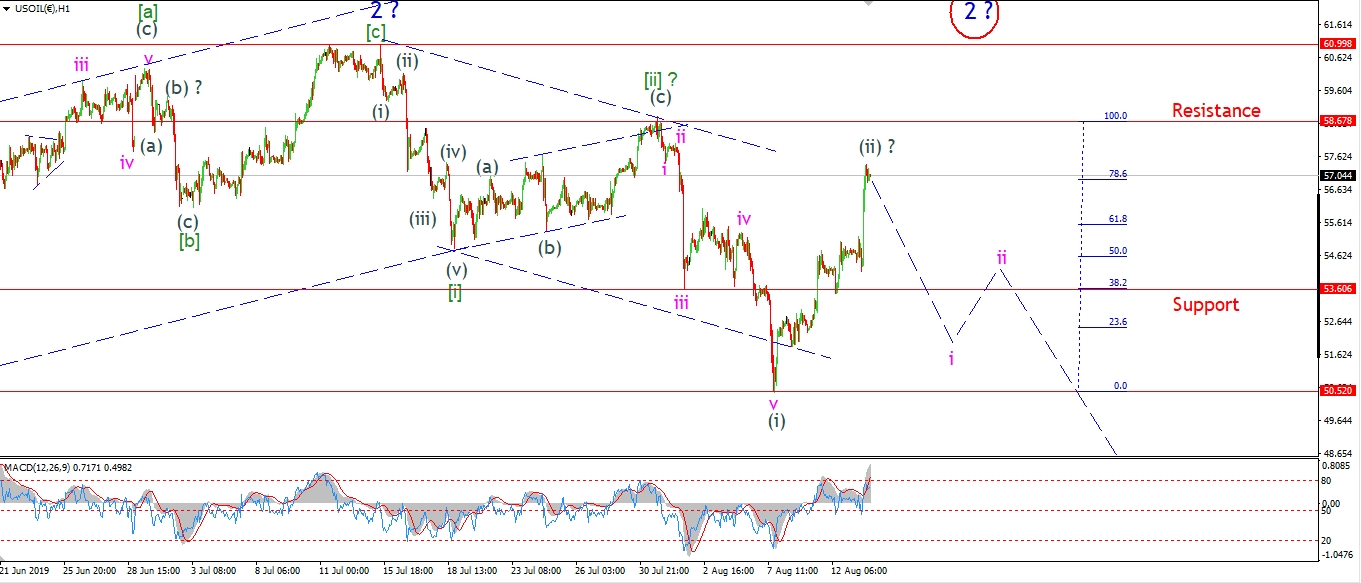 [/vc_column_text][/vc_column][vc_column width=”1/3″][vc_custom_heading text=”4 Hours” use_theme_fonts=”yes”][vc_column_text]
 [/vc_column_text][vc_custom_heading text=”Daily” use_theme_fonts=”yes”][vc_column_text]
 [/vc_column_text][/vc_column][/vc_row]
[vc_row][vc_column][vc_column_text]
Crude caught a serious bid today also.
This has not ruled out the current short term count,
but I think its worth considering the alternate count for wave ‘2’ blue shown on the 4hr chart.
This views the recent decline as a large wave [b] of ‘2’.
And the current rise as wave [c] of ‘2’.
Once wave ‘2’ completes,
it will lead to an acceleration lower in wave [iii].
A break of 58.67 will favor the alternate count.
Tomorrow;
Back to the current short term count.
If we see an equally sharp move lower tomorrow below 53.50,
that will favor the current bearish setup.
Watch for wave (ii) to hold below 58.67 and return lower in wave ‘i’ of (iii).
[/vc_column_text][/vc_column][/vc_row]
[vc_row][vc_column][vc_separator border_width=”5″][/vc_column][/vc_row][vc_row][vc_column][vc_column_text]
US 10 yr Treasuries.
[/vc_column_text][/vc_column][/vc_row][vc_row][vc_column][vc_separator border_width=”5″][/vc_column][/vc_row][vc_row][vc_column width=”2/3″][vc_custom_heading text=”1 hr” use_theme_fonts=”yes”][vc_column_text] [/vc_column_text][/vc_column][vc_column width=”1/3″][vc_custom_heading text=”4 Hours” use_theme_fonts=”yes”][vc_column_text]
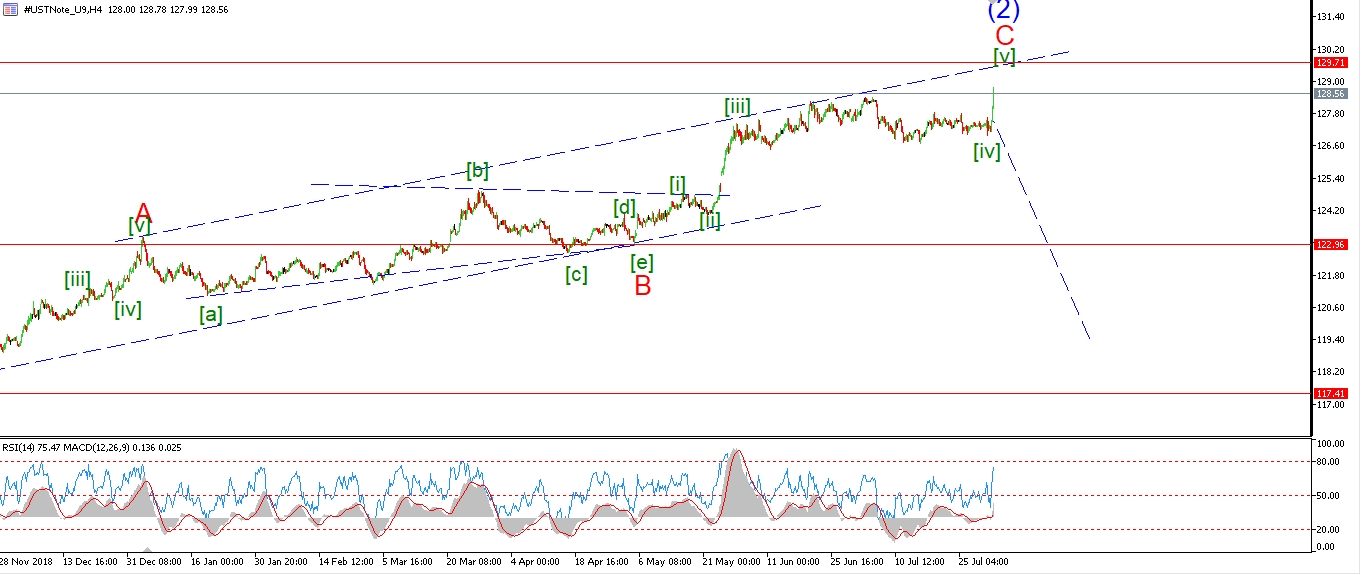 [/vc_column_text][vc_custom_heading text=”Daily” use_theme_fonts=”yes”][vc_column_text]
 [/vc_column_text][/vc_column][/vc_row]
[vc_row][vc_column][vc_column_text]
Bonds did complete a lower high in wave (ii) today,
The price spiked lower in a possible wave ‘i’ of (iii) into the session low at 129.52.
Wave ‘ii’ is now underway and should again create another smaller lower high,
before the price accelerates lower into wave ‘iii’ of (iii) in the coming days.
Tomorrow;
Watch for wave ‘ii’ of (iii) to complete soon.
Wave ‘iii’ of (iii) should begin with a break of 129.35.
[/vc_column_text][/vc_column][/vc_row]
[vc_row][vc_column][vc_separator border_width=”5″][/vc_column][/vc_row][vc_row][vc_column][vc_column_text]
SILVER
[/vc_column_text][/vc_column][/vc_row][vc_row][vc_column][vc_separator border_width=”5″][/vc_column][/vc_row][vc_row][vc_column width=”2/3″][vc_custom_heading text=”1 hr” use_theme_fonts=”yes”][vc_column_text]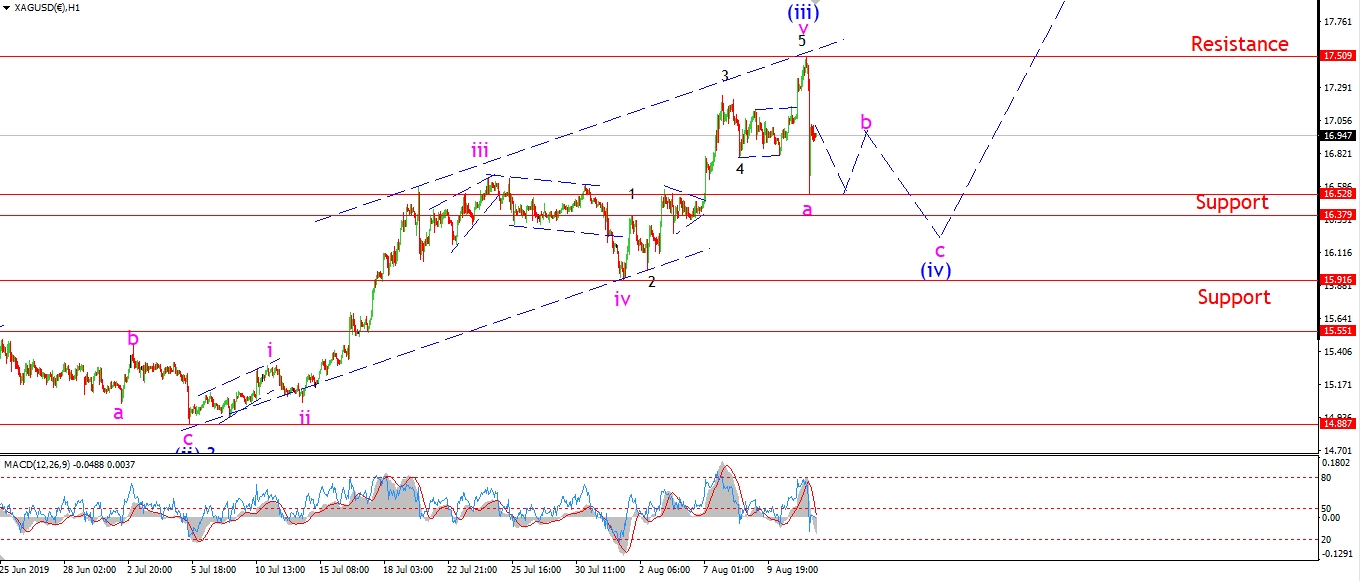 [/vc_column_text][/vc_column][vc_column width=”1/3″][vc_custom_heading text=”4 Hours” use_theme_fonts=”yes”][vc_column_text]
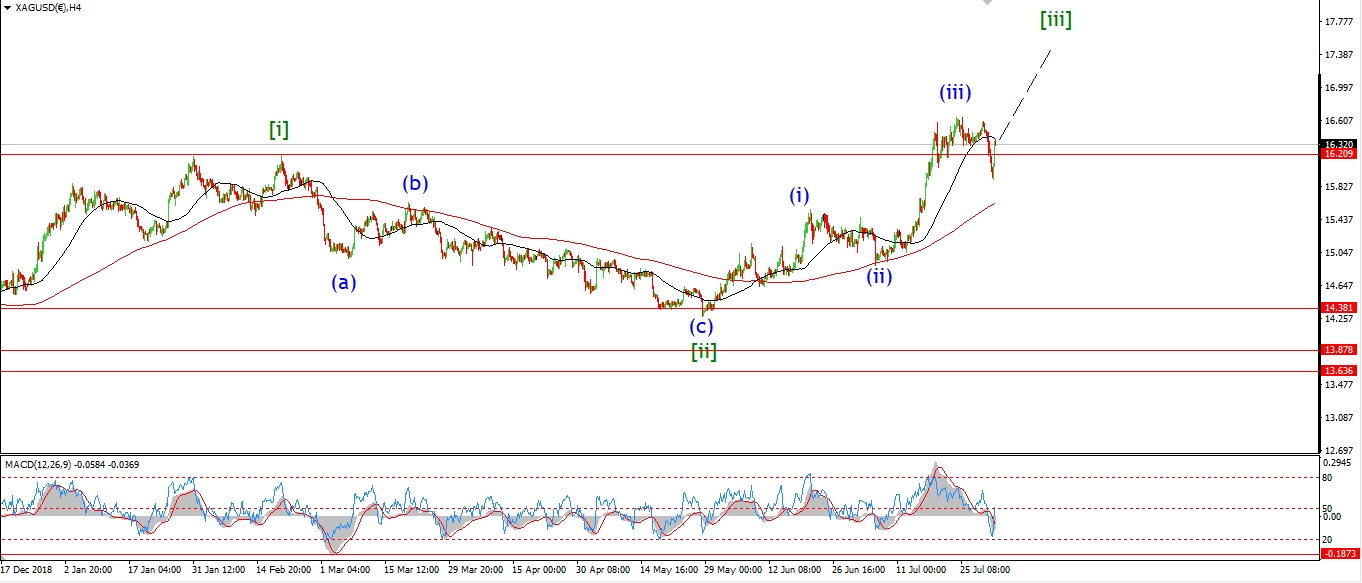 [/vc_column_text][vc_custom_heading text=”Daily” use_theme_fonts=”yes”][vc_column_text]
 [/vc_column_text][/vc_column][/vc_row]
[vc_row][vc_column][vc_column_text]
That was a pretty serious spike lower today in silver.
After hitting a new high at the upper trend channel line of 17.50,
the price was immediately hit with a 100 point drop in the space of an hour!
I am viewing this decline as the first step of a three wave correction in wave (iv).
So todays decline may even be the whole of wave ‘a’ now complete.
Wave (iv) may take the rest of the week to play out,
so it is again a hold and see time.
Tomorrow;
The bounce off the low of the session today may even be the beginning of wave ‘b’ of (iv).
Watch for wave ‘b’ to create a small three wave pattern sideways tomorrow.
[/vc_column_text][/vc_column][/vc_row]
[vc_row][vc_column][vc_separator border_width=”5″][/vc_column][/vc_row][vc_row][vc_column][vc_column_text]
S&P 500.
[/vc_column_text][/vc_column][/vc_row][vc_row][vc_column][vc_separator border_width=”5″][/vc_column][/vc_row][vc_row][vc_column width=”2/3″][vc_custom_heading text=”1 hr” use_theme_fonts=”yes”][vc_column_text] [/vc_column_text][/vc_column][vc_column width=”1/3″][vc_custom_heading text=”4 Hours” use_theme_fonts=”yes”][vc_column_text]
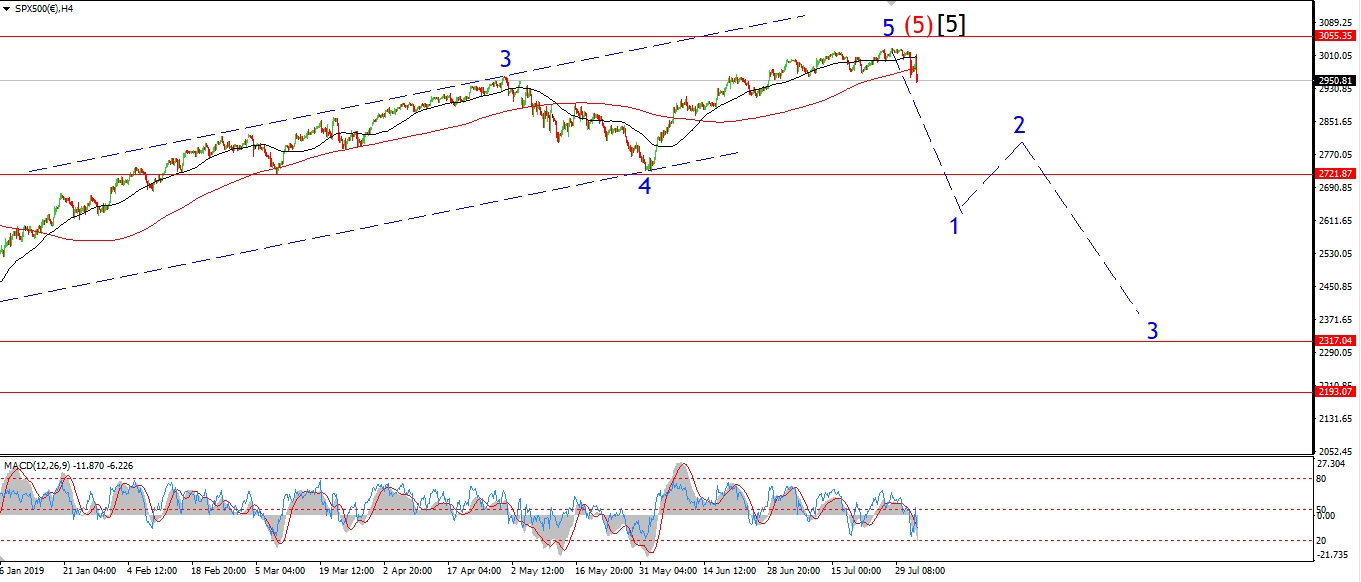 [/vc_column_text][vc_custom_heading text=”Daily” use_theme_fonts=”yes”][vc_column_text]
 [/vc_column_text][/vc_column][/vc_row]
[vc_row][vc_column][vc_column_text]
The rally in the S&P also ruled out the previous count.
This is still viewed as a correction overall in wave [ii].
And todays spike higher is the terminal move in that correction
in wave (c) of [ii].
There is not much left to go in wave (c) now either,
the price is sitting right below a band of resistance
and the 62% retracement level of wave [i].
If we see a decline below 2860 again in a five wave pattern.
That should signal wave [iii] down has begun.
Tomorrow;
Watch for wave (c) of [ii] to complete at a nearby high.
This week should see the beginning of wave [iii] down.
[/vc_column_text][/vc_column][/vc_row]
[vc_row][vc_column][vc_separator border_width=”5″][/vc_column][/vc_row]