
[vc_row][vc_column][vc_separator border_width=”5″][/vc_column][/vc_row]
[vc_row][vc_column][vc_column_text]
Good evening everyone.
[/vc_column_text][/vc_column][/vc_row]
[vc_row][vc_column][vc_separator border_width=”5″][/vc_column][/vc_row]
[vc_row][vc_column][vc_column_text]
EURUSD
[/vc_column_text][/vc_column][/vc_row]
[vc_row][vc_column][vc_separator border_width=”5″][/vc_column][/vc_row][vc_row][vc_column width=”2/3″][vc_custom_heading text=”1 hr” use_theme_fonts=”yes”][vc_column_text]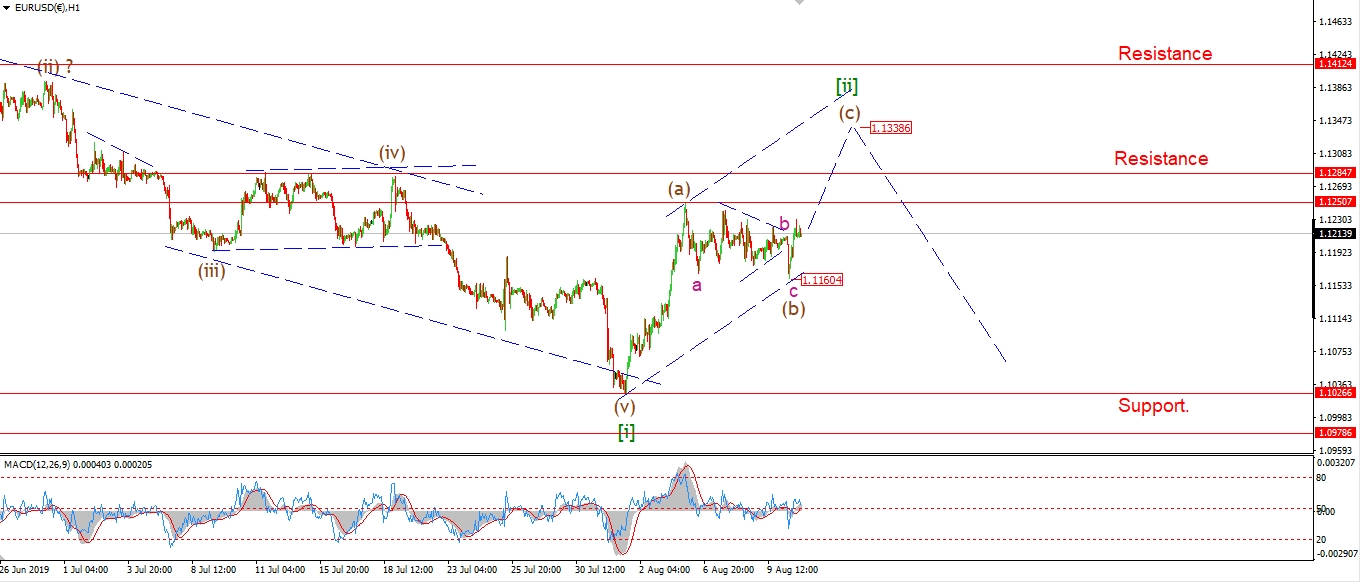 [/vc_column_text][/vc_column][vc_column width=”1/3″][vc_custom_heading text=”4 Hours” use_theme_fonts=”yes”][vc_column_text]
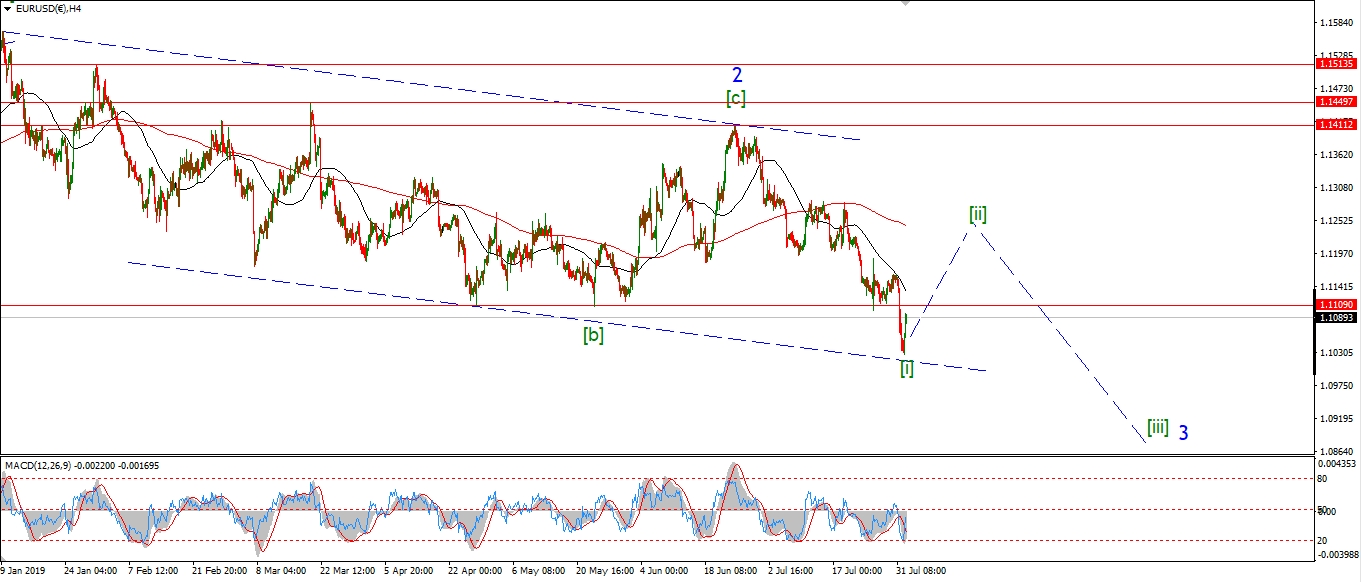 [/vc_column_text][vc_custom_heading text=”Daily” use_theme_fonts=”yes”][vc_column_text]
 [/vc_column_text][/vc_column][/vc_row]
[vc_row][vc_column][vc_column_text]
EURUSD hit spiked lower to 1.1160 this morning in wave ‘c’ pink.
This action has completed a combination wave (b).
The market rallied off the low and is now back above 1.1200 again.
Wave (c) is now most likely underway and the pattern allows for a rally above initial resistance at 1.1284.
If wave (c) reaches all the way to the upper trend channel line that would give us a target at about 1.1350.
Wave [ii] must complete below 1.1412.
A break of that level will invalidate the current wave count.
Tomorrow;
Watch for wave (c) to continue towards above 1.1284.
1.1160 should hold.
[/vc_column_text][/vc_column][/vc_row]
[vc_row][vc_column][vc_separator border_width=”5″][/vc_column][/vc_row][vc_row][vc_column][vc_column_text]
GBPUSD
[/vc_column_text][/vc_column][/vc_row][vc_row][vc_column][vc_separator border_width=”5″][/vc_column][/vc_row][vc_row][vc_column width=”2/3″][vc_custom_heading text=”1 hr” use_theme_fonts=”yes”][vc_column_text] [/vc_column_text][/vc_column][vc_column width=”1/3″][vc_custom_heading text=”4 Hours” use_theme_fonts=”yes”][vc_column_text]
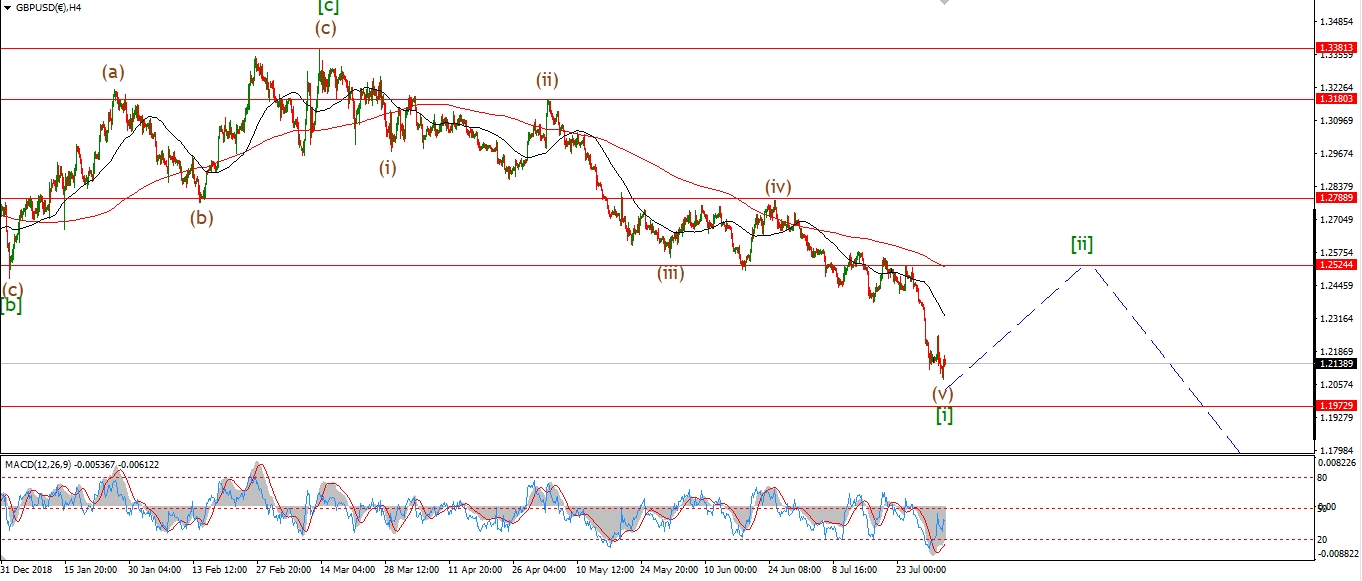 [/vc_column_text][vc_custom_heading text=”Daily” use_theme_fonts=”yes”][vc_column_text]
 [/vc_column_text][/vc_column][/vc_row]
[vc_row][vc_column][vc_column_text]
I have switched to the alternate count today because of the further spike lower this morning.
The price spiked lower from a triangle wave ‘iv’.
So this move should be terminal within the larger structure.
And wave (v) should be complete now.
This change does not change the bigger picture call for a rally in wave [ii].
I suspect we will see that rally begin this week.
I have labelled the chart as such.
Tomorrow;
Watch for wave (a) to continue higher tomorrow,
A break of 1.2183 will confirm that wave [ii] has begun.
[/vc_column_text][/vc_column][/vc_row]
[vc_row][vc_column][vc_separator border_width=”5″][/vc_column][/vc_row][vc_row][vc_column][vc_column_text]
USDJPY
[/vc_column_text][/vc_column][/vc_row][vc_row][vc_column][vc_separator border_width=”5″][/vc_column][/vc_row][vc_row][vc_column width=”2/3″][vc_custom_heading text=”1 hr” use_theme_fonts=”yes”][vc_column_text]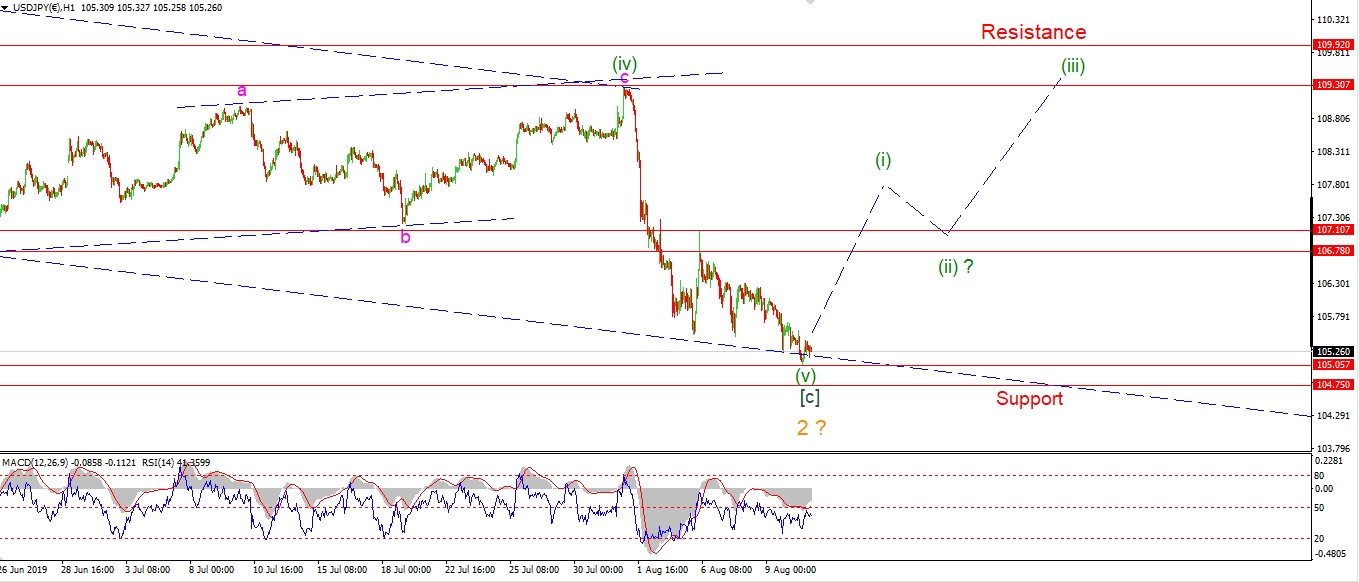 [/vc_column_text][/vc_column][vc_column width=”1/3″][vc_custom_heading text=”4 Hours” use_theme_fonts=”yes”][vc_column_text]
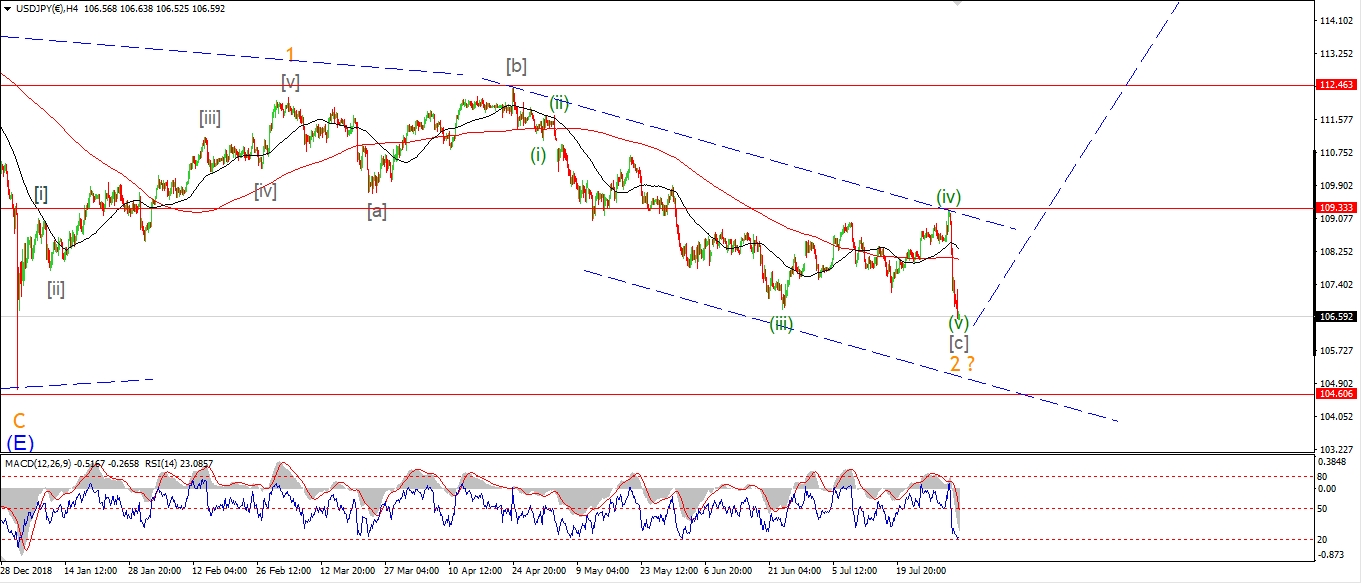 [/vc_column_text][vc_custom_heading text=”Daily” use_theme_fonts=”yes”][vc_column_text]
 [/vc_column_text][/vc_column][/vc_row]
[vc_row][vc_column][vc_column_text]
Still no joy for USDJPY today!
The price is so close to invalidating the current count now that That I must expect it to happen.
I am looking at the alternates at the moment,
And if we get a break overnight,
I will change to the next most likely wave count.
Tomorrow;
For the moment I will hold fire.
If we see an impulsive spike overnight and support at 104.75 actually holds,
then I will continue to work with the current count.
[/vc_column_text][/vc_column][/vc_row]
[vc_row][vc_column][vc_separator border_width=”5″][/vc_column][/vc_row][vc_row][vc_column][vc_column_text]
DOW JONES INDUSTRIALS
[/vc_column_text][/vc_column][/vc_row][vc_row][vc_column][vc_separator border_width=”5″][/vc_column][/vc_row][vc_row][vc_column width=”2/3″][vc_custom_heading text=”1 hr” use_theme_fonts=”yes”][vc_column_text]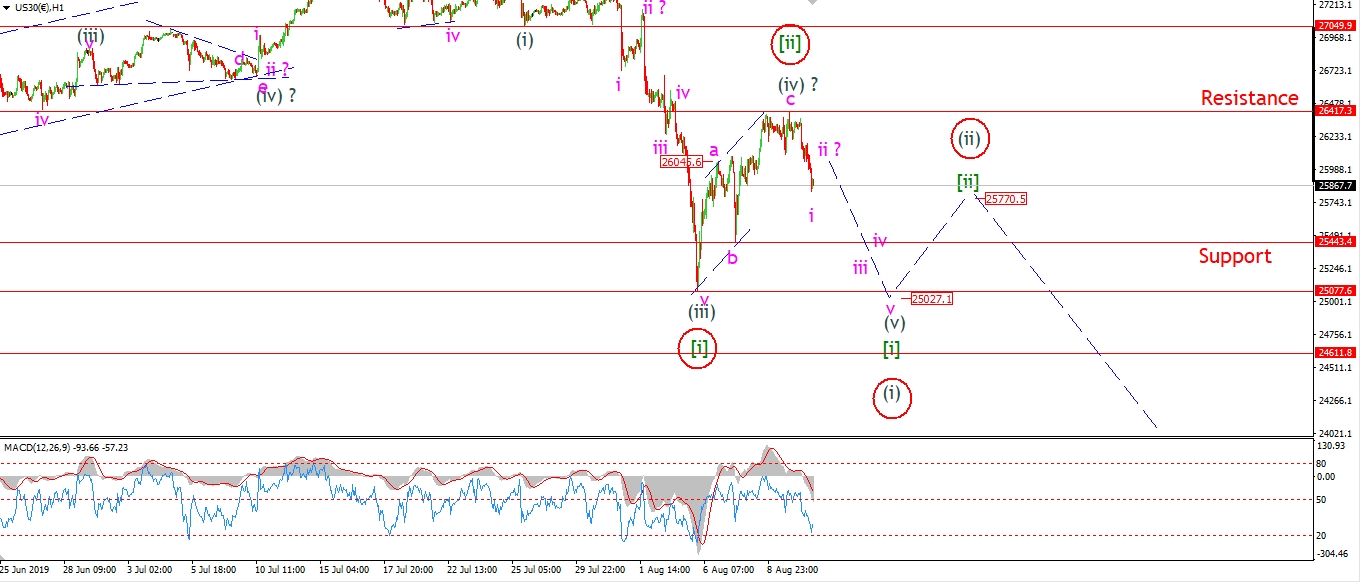 [/vc_column_text][/vc_column][vc_column width=”1/3″][vc_custom_heading text=”4 Hours” use_theme_fonts=”yes”][vc_column_text]
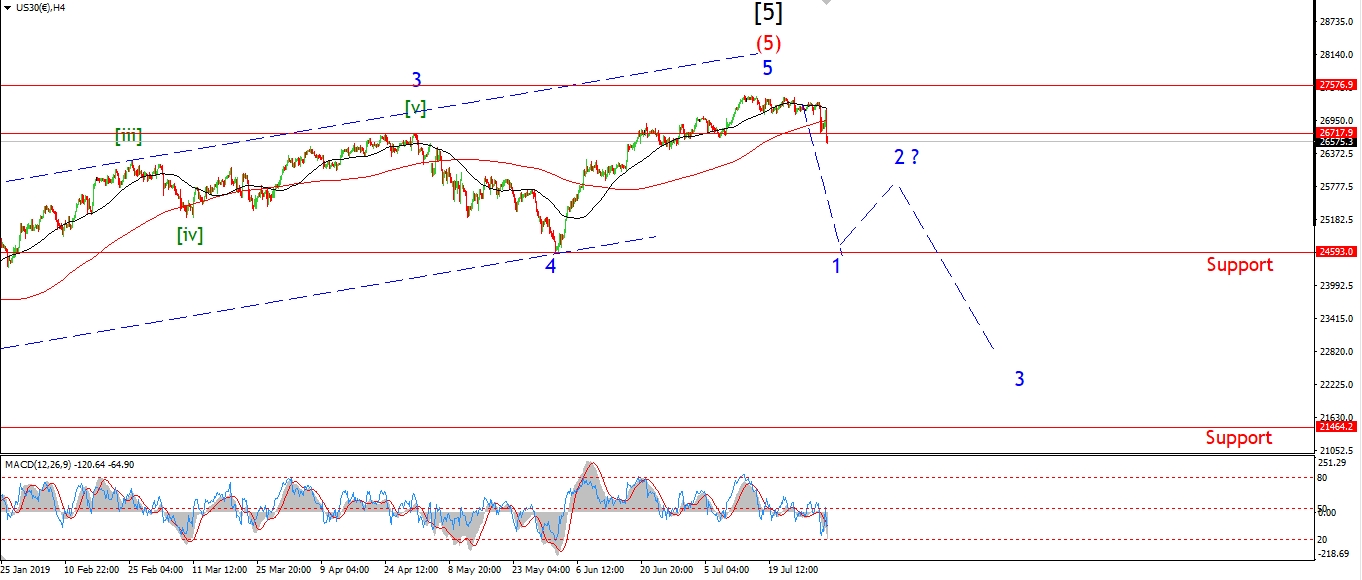 [/vc_column_text][vc_custom_heading text=”Daily” use_theme_fonts=”yes”][vc_column_text]
 [/vc_column_text][/vc_column][/vc_row]
[vc_row][vc_column][vc_column_text]
The DOW is dropping impulsively today off Fridays high.
The price has broken initial support at the high of wave (a) at 26.045.
And price has dropped below the 26000 level again.
The next support lies at wave (b) at 25443.
If this level breaks,
a break of that level should confirm the larger decline is underway.
Today’s spike lower has occurred off a three wave rally,
this action suggests the corrective phase is complete to the upside in wave [ii].
And the larger trend is turning to the downside again.
The big question remains,
Is this a decline in wave (v) of [i],
Or,
The beginning of a larger decline in wave (i) of [iii].
Only time will tell on that front.
Tomorrow;
watch for wave (v) or (i) to continue lower for the next few days.
A break of 25000 is expected in the current count.
26400 should hold from here.
[/vc_column_text][/vc_column][/vc_row]
[vc_row][vc_column][vc_separator border_width=”5″][/vc_column][/vc_row][vc_row][vc_column][vc_column_text]
GOLD
[/vc_column_text][/vc_column][/vc_row][vc_row][vc_column][vc_separator border_width=”5″][/vc_column][/vc_row][vc_row][vc_column width=”2/3″][vc_custom_heading text=”1 hr” use_theme_fonts=”yes”][vc_column_text]
 [/vc_column_text][/vc_column][vc_column width=”1/3″][vc_custom_heading text=”4 Hours” use_theme_fonts=”yes”][vc_column_text]
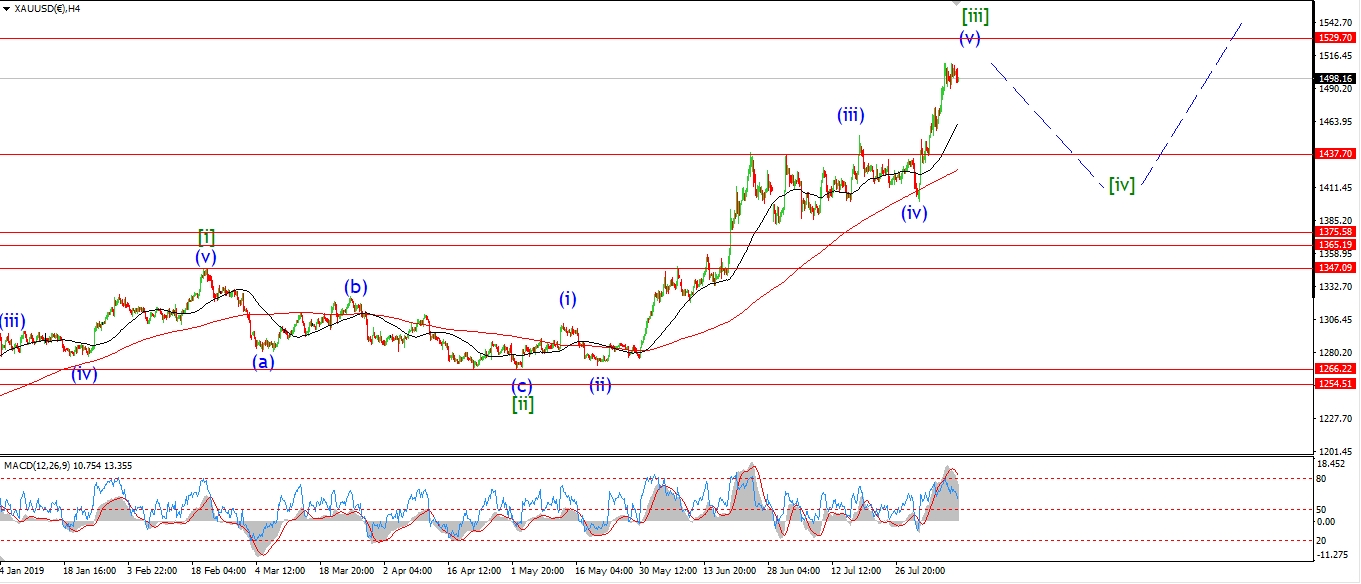 [/vc_column_text][vc_custom_heading text=”Daily” use_theme_fonts=”yes”][vc_column_text]
 [/vc_column_text][/vc_column][/vc_row]
[vc_row][vc_column][vc_column_text]
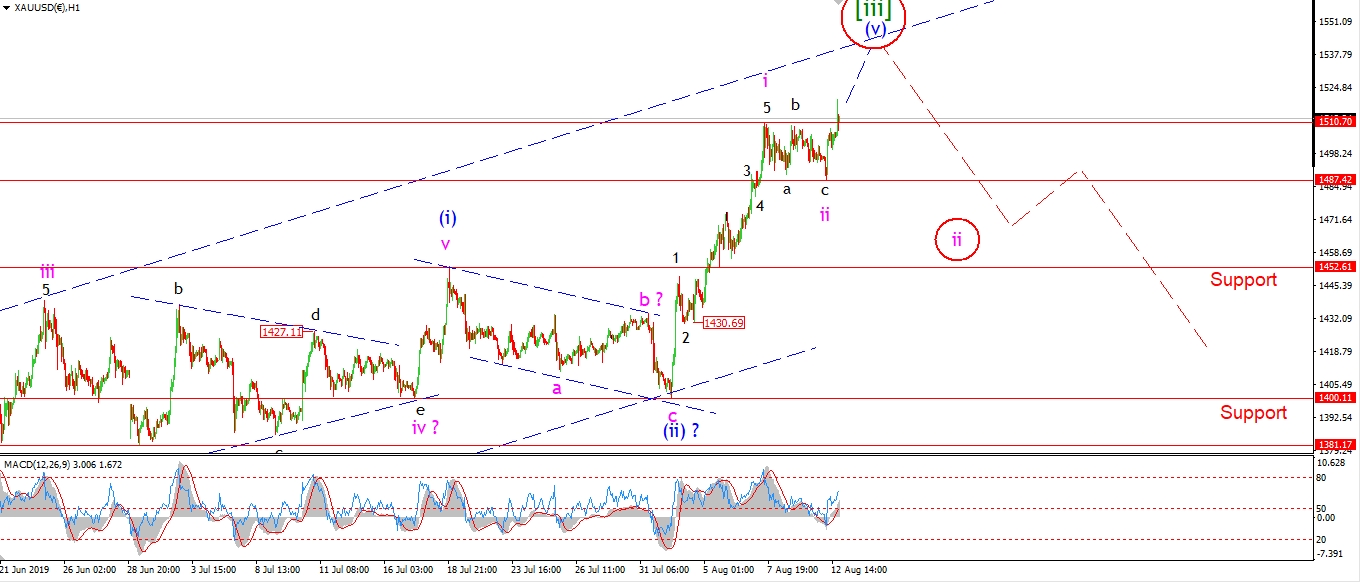
I am leaning in favor of the alternate count in gold this evening.
This is best viewed on the 4hr chart.
This alternate count views the current highs as a top in wave [iii] of ‘3’.
And now we should prepare for a correction lower in wave [iv] of ‘3’ which will play out over the coming month or so.
If this alternate count is correct,
we should see wave [iv] fall in three waves and complete above 1347.
1347 is the high of wave [i] green,
and wave [iv] should not break that level according to the rules of Elliott wave.
Tomorrow;
Watch for price to hold above 1487 initially.
If the market reaches the upper trend line and then falls below that level again,
then I will have to consider at least a larger wave ‘ii’ pink.
[/vc_column_text][/vc_column][/vc_row]
[vc_row][vc_column][vc_separator border_width=”5″][/vc_column][/vc_row][vc_row][vc_column][vc_column_text]
U.S CRUDE OIL
[/vc_column_text][/vc_column][/vc_row][vc_row][vc_column][vc_separator border_width=”5″][/vc_column][/vc_row][vc_row][vc_column width=”2/3″][vc_custom_heading text=”1 hr” use_theme_fonts=”yes”][vc_column_text] [/vc_column_text][/vc_column][vc_column width=”1/3″][vc_custom_heading text=”4 Hours” use_theme_fonts=”yes”][vc_column_text]
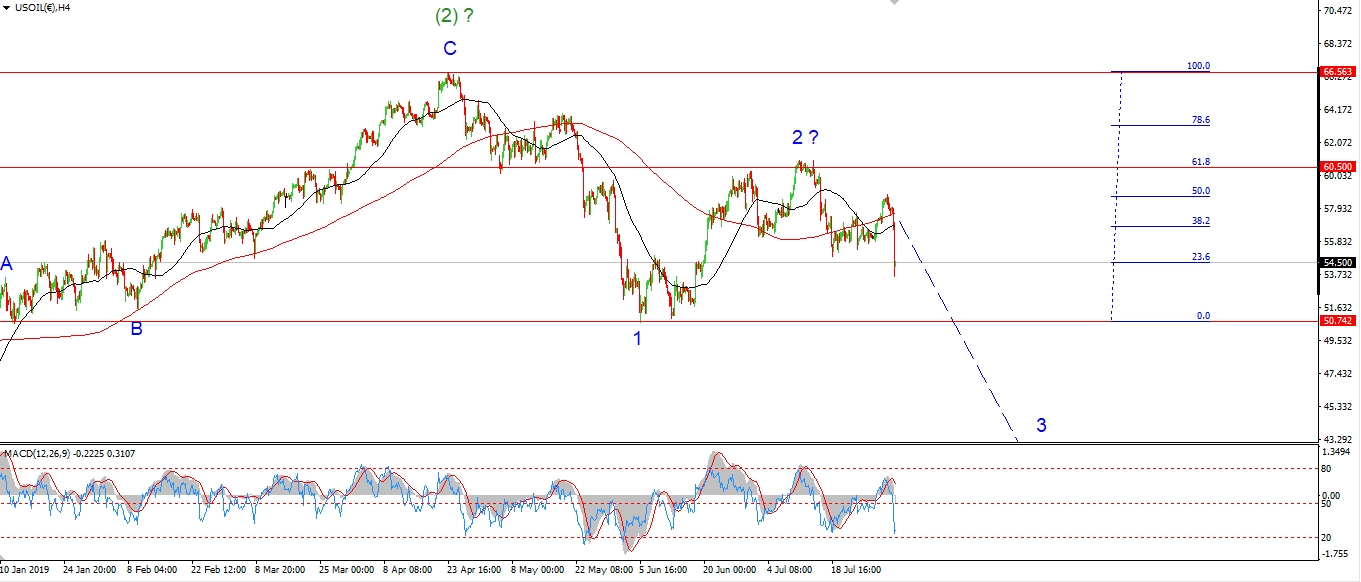 [/vc_column_text][vc_custom_heading text=”Daily” use_theme_fonts=”yes”][vc_column_text]
 [/vc_column_text][/vc_column][/vc_row]
[vc_row][vc_column][vc_column_text]
Crude reached a slight new high this afternoon but the rally has backed off again now.
The price is hovering at the 50% retracement level,
and the previous fourth wave high at 55.33 this evening.
So we are in the area where I would expect a turn to occur again.
This next decline should be the beginning of wave (iii) of [iii].
Especially if we see a sharp move lower over the next few sessions.
If we see only a weak drift lower this week,
that corrective action will suggest wave (ii) is creating another larger structure.
Tomorrow;
Watch for a decline to begin in wave ‘i’ of (iii).
A break of 50.52 will signal wave (iii) has begun.
[/vc_column_text][/vc_column][/vc_row]
[vc_row][vc_column][vc_separator border_width=”5″][/vc_column][/vc_row][vc_row][vc_column][vc_column_text]
US 10 yr Treasuries.
[/vc_column_text][/vc_column][/vc_row][vc_row][vc_column][vc_separator border_width=”5″][/vc_column][/vc_row][vc_row][vc_column width=”2/3″][vc_custom_heading text=”1 hr” use_theme_fonts=”yes”][vc_column_text] [/vc_column_text][/vc_column][vc_column width=”1/3″][vc_custom_heading text=”4 Hours” use_theme_fonts=”yes”][vc_column_text]
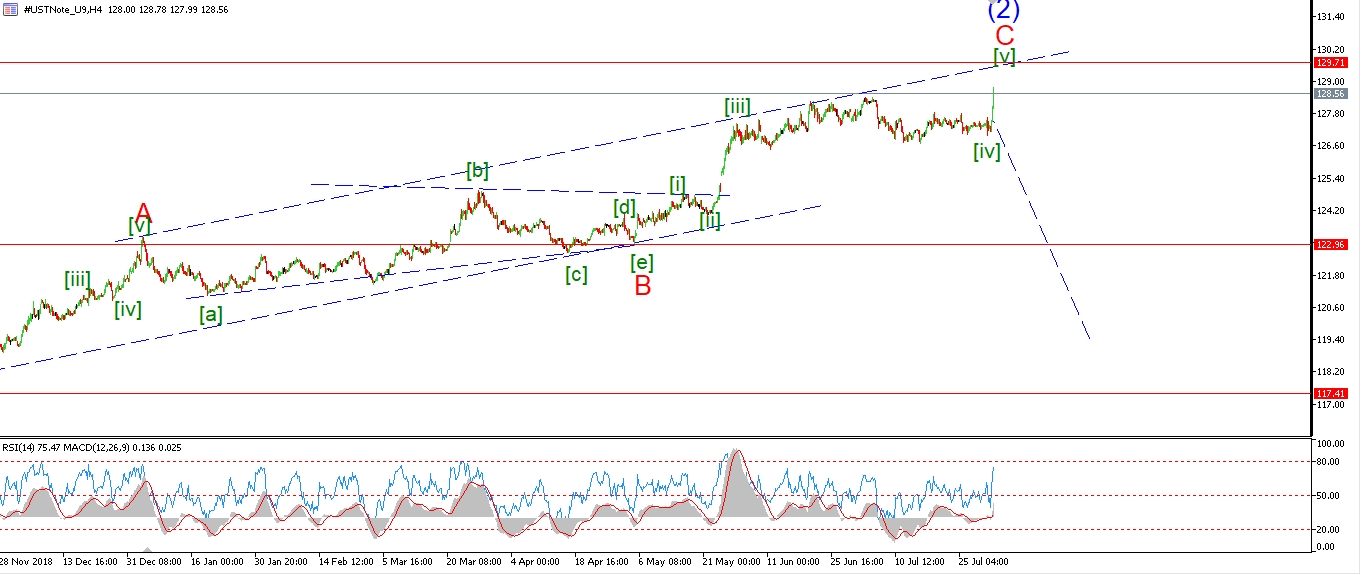 [/vc_column_text][vc_custom_heading text=”Daily” use_theme_fonts=”yes”][vc_column_text]
 [/vc_column_text][/vc_column][/vc_row]
[vc_row][vc_column][vc_column_text]
Bonds rose today in a possible wave ‘c’ of (ii).
This rally should complete wave (ii),
and now leave the way open for wave (iii) to fall back towards 128.00 again.
A break of 129.35 will be the first sign that wave (iii) down has begun.
Tomorrow;
Price must hold below 130.86 now.
Watch for wave (iii) to begin with a break of wave (i) at 129.35.
[/vc_column_text][/vc_column][/vc_row]
[vc_row][vc_column][vc_separator border_width=”5″][/vc_column][/vc_row][vc_row][vc_column][vc_column_text]
SILVER
[/vc_column_text][/vc_column][/vc_row][vc_row][vc_column][vc_separator border_width=”5″][/vc_column][/vc_row][vc_row][vc_column width=”2/3″][vc_custom_heading text=”1 hr” use_theme_fonts=”yes”][vc_column_text]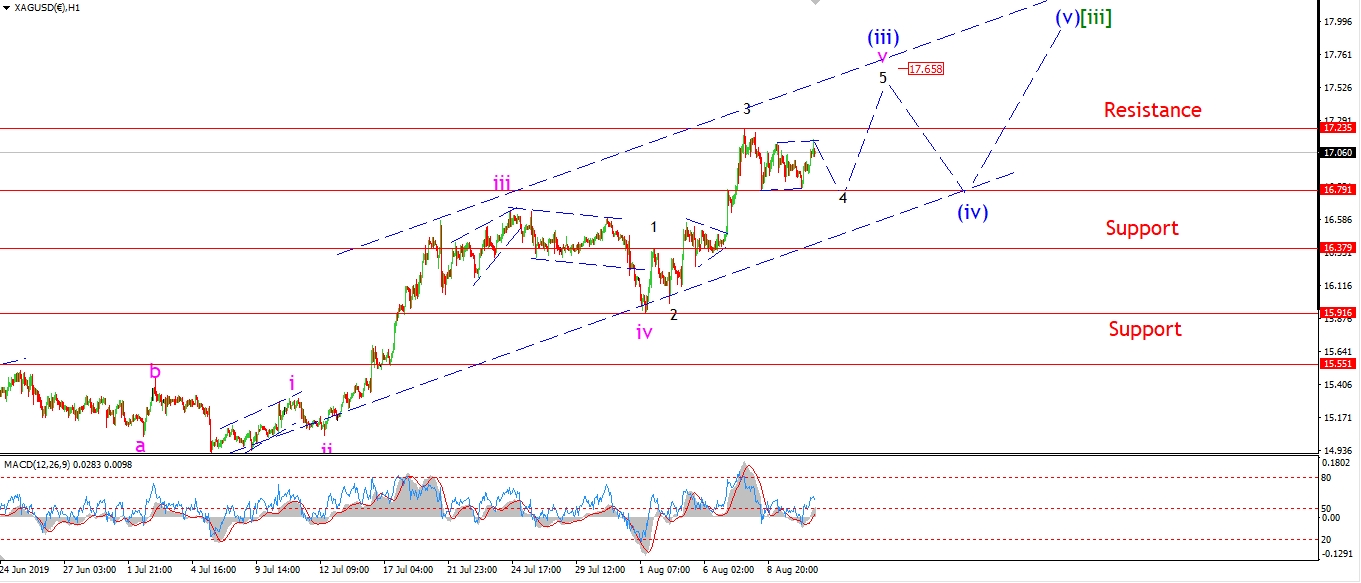 [/vc_column_text][/vc_column][vc_column width=”1/3″][vc_custom_heading text=”4 Hours” use_theme_fonts=”yes”][vc_column_text]
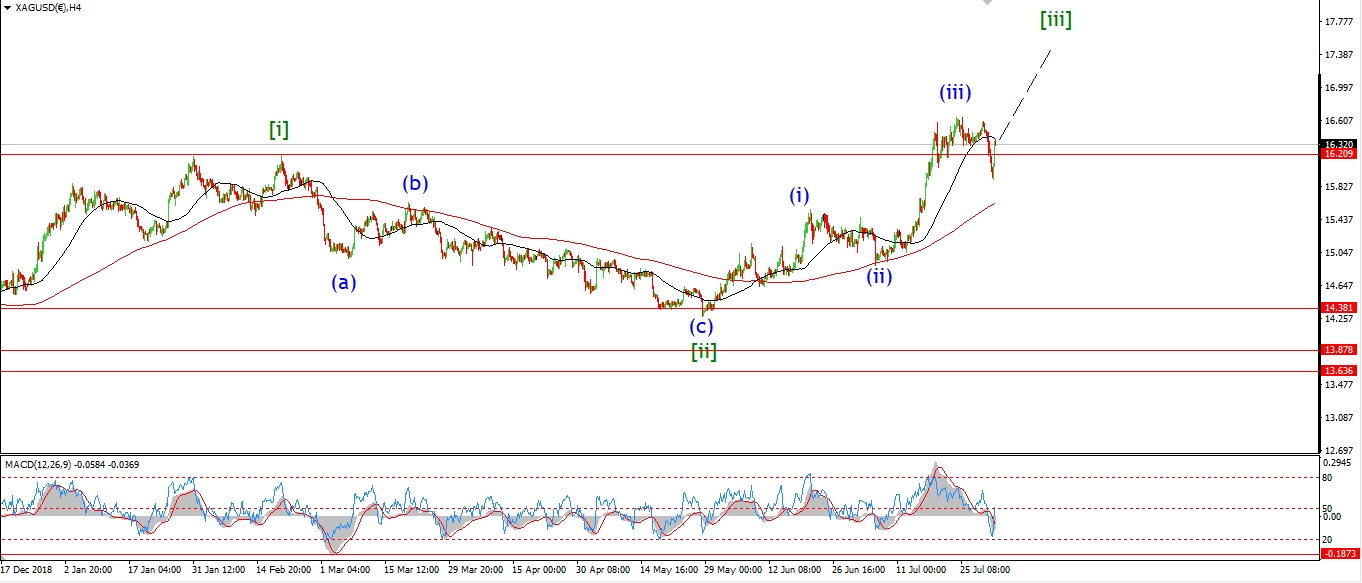 [/vc_column_text][vc_custom_heading text=”Daily” use_theme_fonts=”yes”][vc_column_text]
 [/vc_column_text][/vc_column][/vc_row]
[vc_row][vc_column][vc_column_text]
Silver has been tracking sideways over the last few sessions.
The action has now completed a three wave move
and this is shown within a small trend channel.
If this correction completes wave ‘4’ of ‘v’,
Then wave ‘v’ of (iii) will rally higher this week above 17.23 at a minimum,
and possibly towards the upper trend channel line at 17.65.
That action will complete wave (iii) and wave (iv) should correct lower again.
Tomorrow;
watch for wave ‘4’ to complete with a small drop to 16.79.
And the wave ‘5’ of ‘v’ will be set to rally again.
Price must hold above 16.37.
[/vc_column_text][/vc_column][/vc_row]
[vc_row][vc_column][vc_separator border_width=”5″][/vc_column][/vc_row][vc_row][vc_column][vc_column_text]
S&P 500.
[/vc_column_text][/vc_column][/vc_row][vc_row][vc_column][vc_separator border_width=”5″][/vc_column][/vc_row][vc_row][vc_column width=”2/3″][vc_custom_heading text=”1 hr” use_theme_fonts=”yes”][vc_column_text]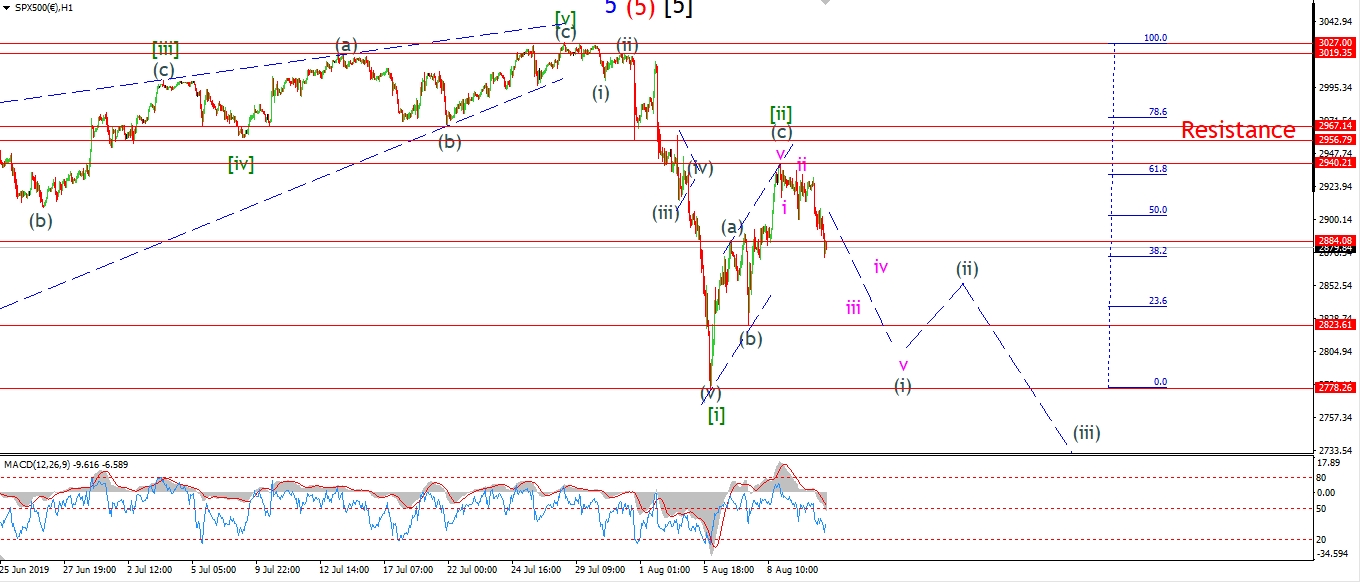 [/vc_column_text][/vc_column][vc_column width=”1/3″][vc_custom_heading text=”4 Hours” use_theme_fonts=”yes”][vc_column_text]
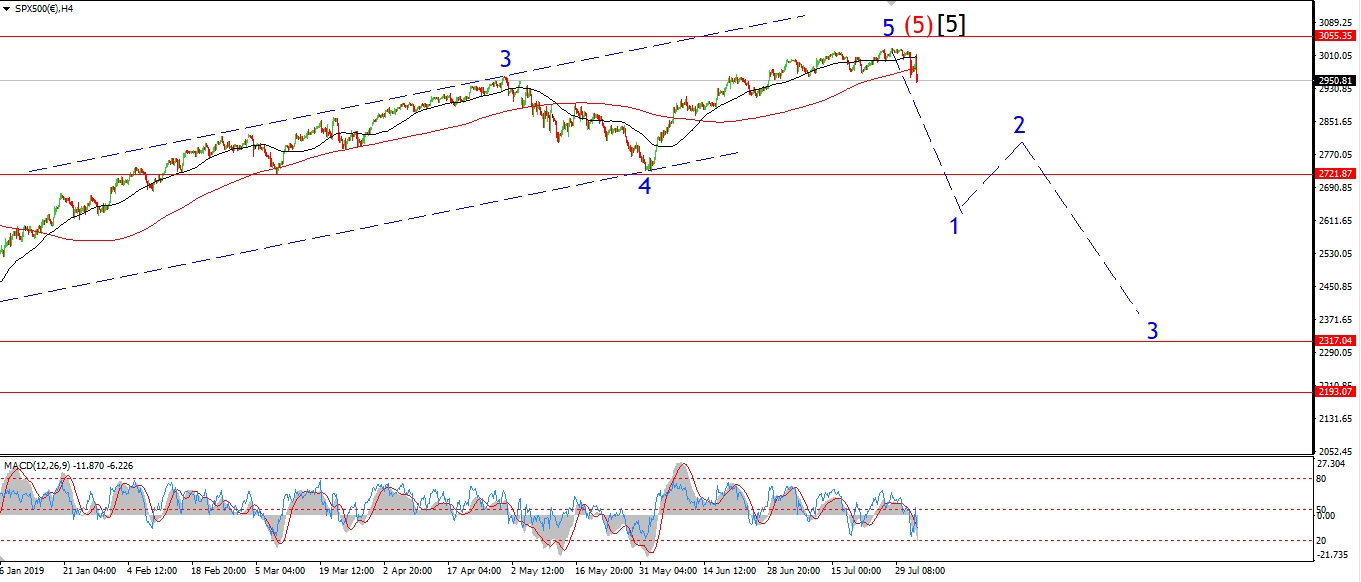 [/vc_column_text][vc_custom_heading text=”Daily” use_theme_fonts=”yes”][vc_column_text]
 [/vc_column_text][/vc_column][/vc_row]
[vc_row][vc_column][vc_column_text]
The short term count is a little messy off the high last week.
We could have a failed fifth wave in place at Fridays lower high,
or the market dropped in a series of small impulse moves,
and today’s drop is part of wave ‘iii’ of (i) down.
this is a minor technicality in some sense
because;
If the market continues lower over the coming week and breaks 2823 at wave (b),
that should confirm the turn into wave [iii] down has begun.
And we can expect a rocky few weeks in the market as price begins to accelerate lower in wave [iii] down.
tomorrow;
Watch for wave (i) of [iii] to continue lower in five waves.
Wave (i) should break 2823 at a minimum.
the high at 2940 should hold from here.
[/vc_column_text][/vc_column][/vc_row]
[vc_row][vc_column][vc_separator border_width=”5″][/vc_column][/vc_row]