
[vc_row][vc_column][vc_separator border_width=”5″][/vc_column][/vc_row]
[vc_row][vc_column][vc_column_text]
Good evening everyone.
[/vc_column_text][/vc_column][/vc_row]
[vc_row][vc_column][vc_separator border_width=”5″][/vc_column][/vc_row]
[vc_row][vc_column][vc_column_text]
EURUSD
[/vc_column_text][/vc_column][/vc_row]
[vc_row][vc_column][vc_separator border_width=”5″][/vc_column][/vc_row][vc_row][vc_column width=”2/3″][vc_custom_heading text=”1 hr” use_theme_fonts=”yes”][vc_column_text]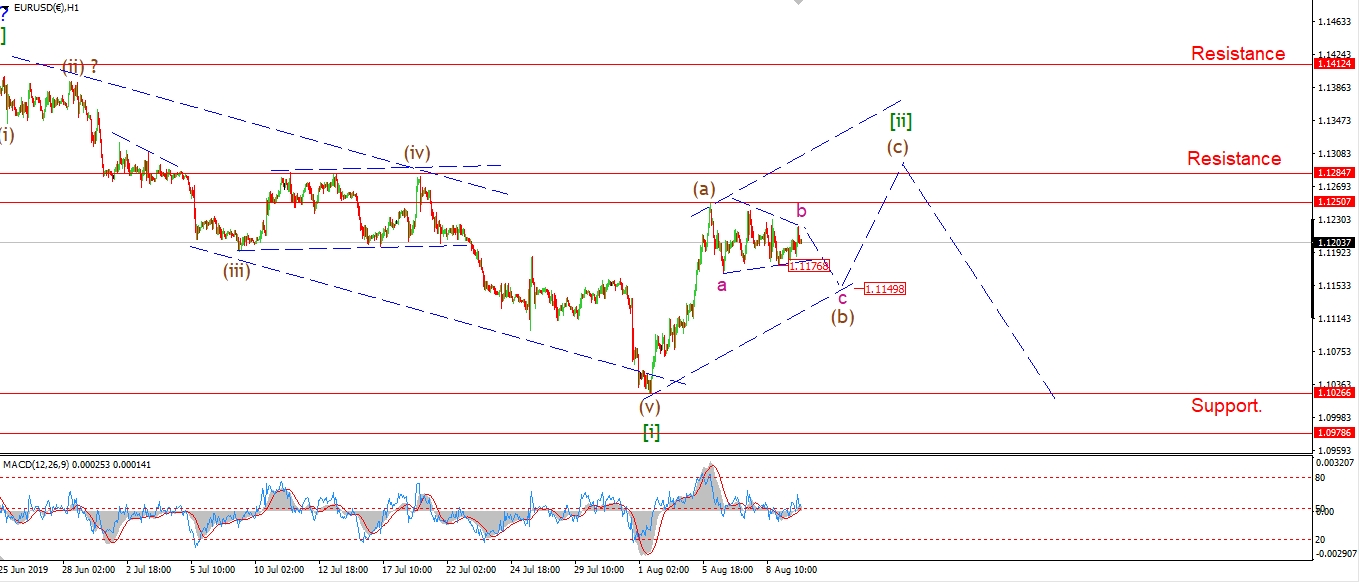 [/vc_column_text][/vc_column][vc_column width=”1/3″][vc_custom_heading text=”4 Hours” use_theme_fonts=”yes”][vc_column_text]
 [/vc_column_text][vc_custom_heading text=”Daily” use_theme_fonts=”yes”][vc_column_text]
 [/vc_column_text][/vc_column][/vc_row]
[vc_row][vc_column][vc_column_text]
The sideways correction in EURUSD rumbles on today.
The current triangle is either wave ‘b’ of (b) as shown,
or this triangle is going to complete wave (b) all together.
I that case,
Thursdays low at 1.1176 will not be broken again,
and wave (c) will begin with a break of 1.1250.
Monday;
Watch for wave (b) to complete by the end of Mondays trade.
1.1250 is the level to watch to confirm wave (c).
[/vc_column_text][/vc_column][/vc_row]
[vc_row][vc_column][vc_separator border_width=”5″][/vc_column][/vc_row][vc_row][vc_column][vc_column_text]
GBPUSD
[/vc_column_text][/vc_column][/vc_row][vc_row][vc_column][vc_separator border_width=”5″][/vc_column][/vc_row][vc_row][vc_column width=”2/3″][vc_custom_heading text=”1 hr” use_theme_fonts=”yes”][vc_column_text] [/vc_column_text][/vc_column][vc_column width=”1/3″][vc_custom_heading text=”4 Hours” use_theme_fonts=”yes”][vc_column_text]
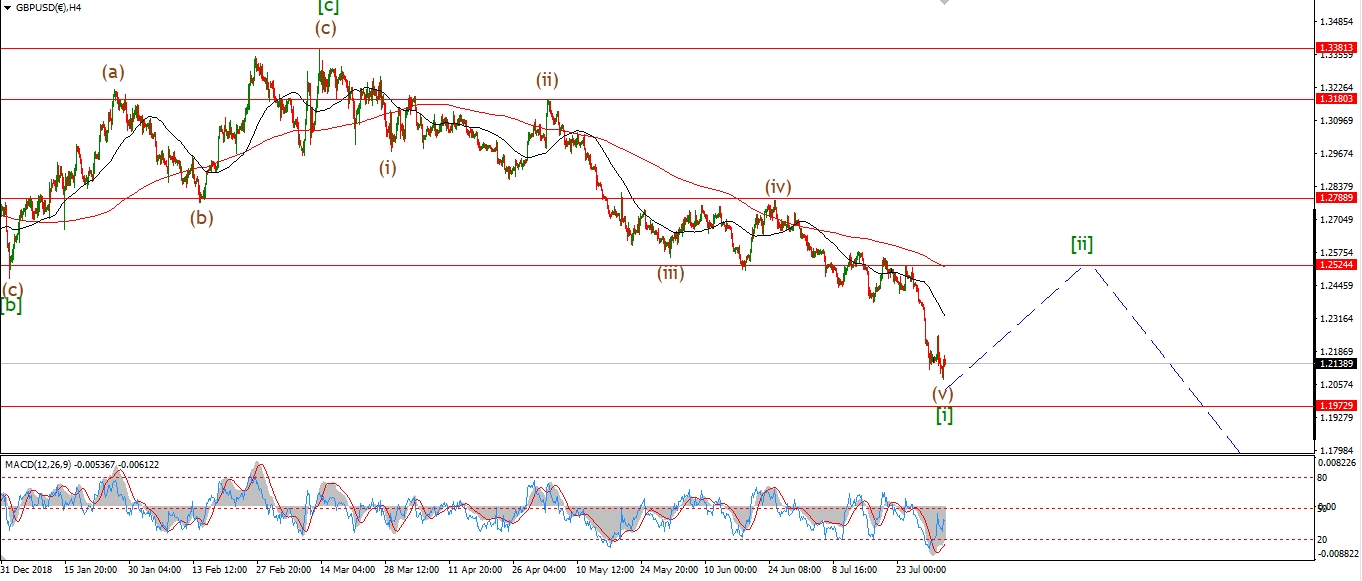 [/vc_column_text][vc_custom_heading text=”Daily” use_theme_fonts=”yes”][vc_column_text]
 [/vc_column_text][/vc_column][/vc_row]
[vc_row][vc_column][vc_column_text]
The short term pattern in cable is as confusing and frustrating as you can get!
I am sticking with the idea that wave [ii] is already underway,
The new low can be viewed as wave (b) of an expanded flat.
Wave (c) should push higher early next week.
And the rally in wave (c) should blow off some of that extreme bearish sentiment.
Monday;
Watch for wave (c) to begin with a push above 1.2180.
[/vc_column_text][/vc_column][/vc_row]
[vc_row][vc_column][vc_separator border_width=”5″][/vc_column][/vc_row][vc_row][vc_column][vc_column_text]
USDJPY
[/vc_column_text][/vc_column][/vc_row][vc_row][vc_column][vc_separator border_width=”5″][/vc_column][/vc_row][vc_row][vc_column width=”2/3″][vc_custom_heading text=”1 hr” use_theme_fonts=”yes”][vc_column_text]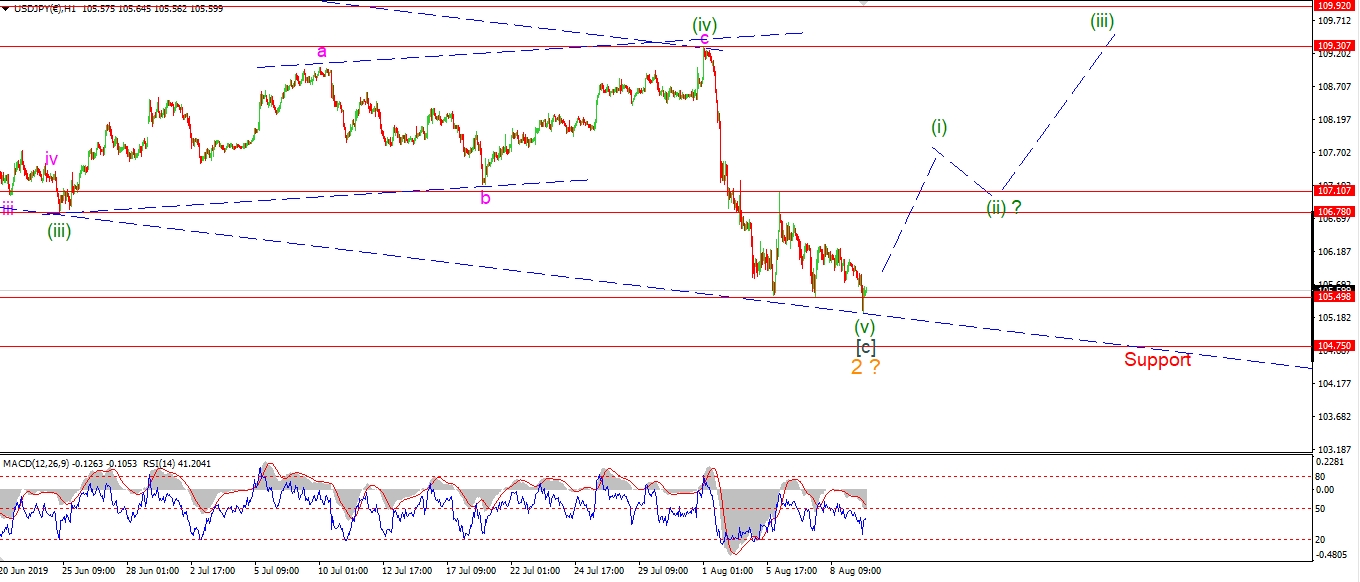 [/vc_column_text][/vc_column][vc_column width=”1/3″][vc_custom_heading text=”4 Hours” use_theme_fonts=”yes”][vc_column_text]
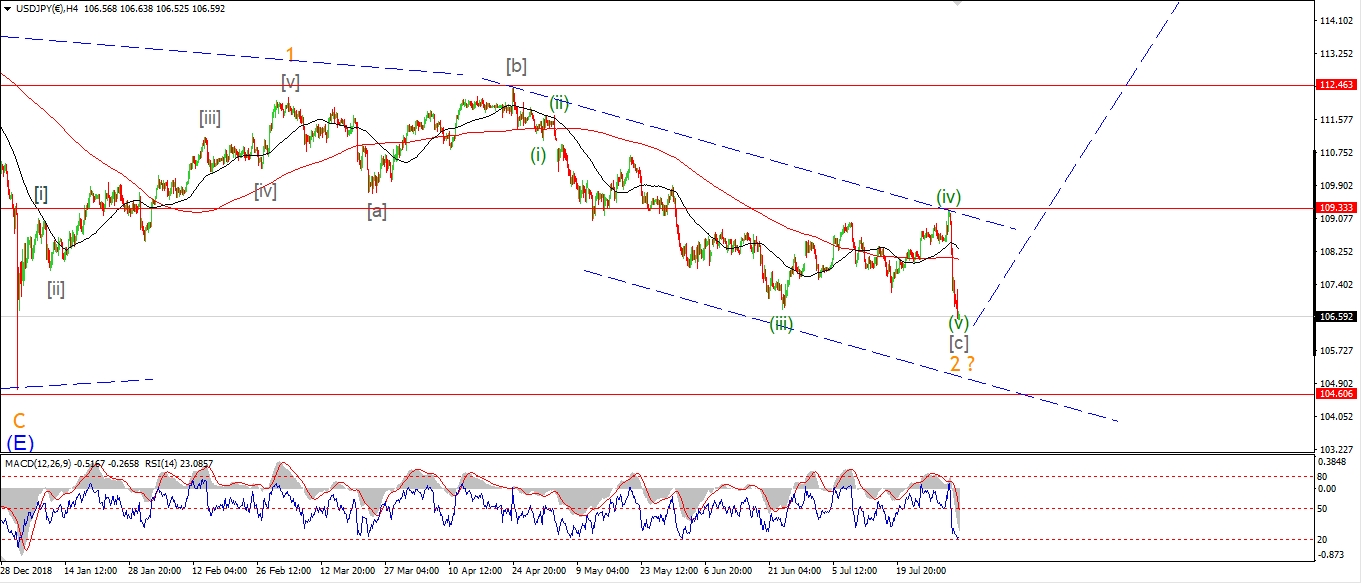 [/vc_column_text][vc_custom_heading text=”Daily” use_theme_fonts=”yes”][vc_column_text]
 [/vc_column_text][/vc_column][/vc_row]
[vc_row][vc_column][vc_column_text]
USDJPY has been playing me for a fool over the last few weeks.
The price is very close to breaking the bullish pattern that I have been using for years now!
So I must stand back and wait for a signal for what comes next.
As long as 104,75 holds next week,
then we are still in with a chance.
Monday;
Watch for wave [c] of ‘2’ to finally come to and end.
104.75 is the key level in the short term.
A break of that level next week will send me back to the drawing board.
[/vc_column_text][/vc_column][/vc_row]
[vc_row][vc_column][vc_separator border_width=”5″][/vc_column][/vc_row][vc_row][vc_column][vc_column_text]
DOW JONES INDUSTRIALS
[/vc_column_text][/vc_column][/vc_row][vc_row][vc_column][vc_separator border_width=”5″][/vc_column][/vc_row][vc_row][vc_column width=”2/3″][vc_custom_heading text=”1 hr” use_theme_fonts=”yes”][vc_column_text]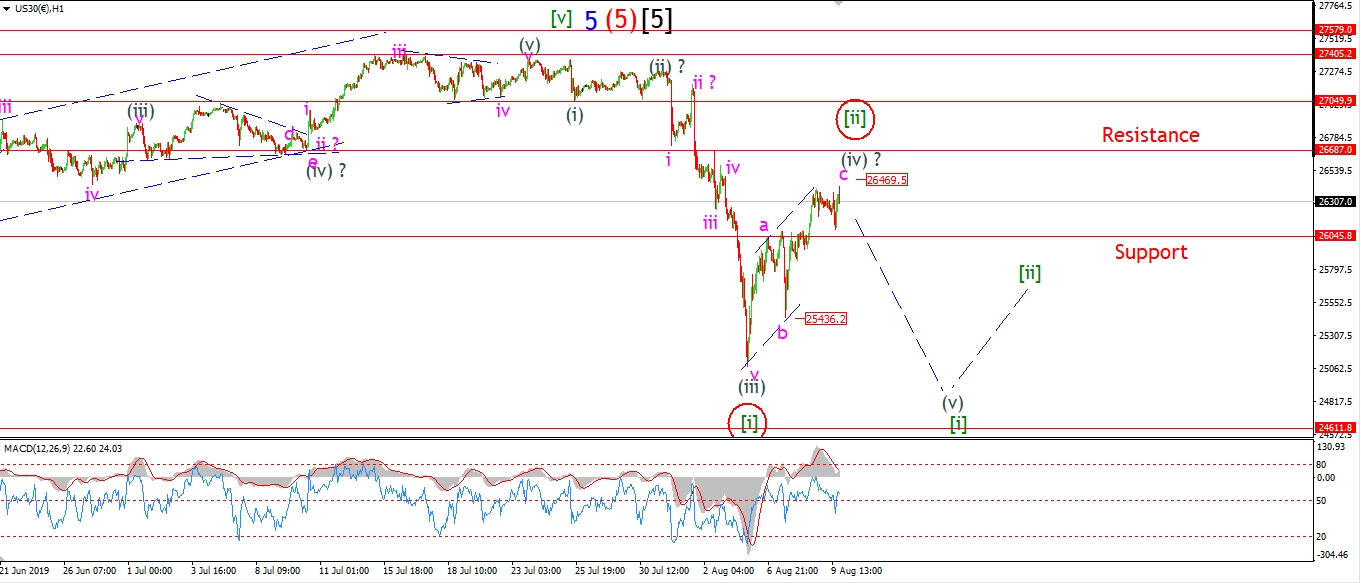 [/vc_column_text][/vc_column][vc_column width=”1/3″][vc_custom_heading text=”4 Hours” use_theme_fonts=”yes”][vc_column_text]
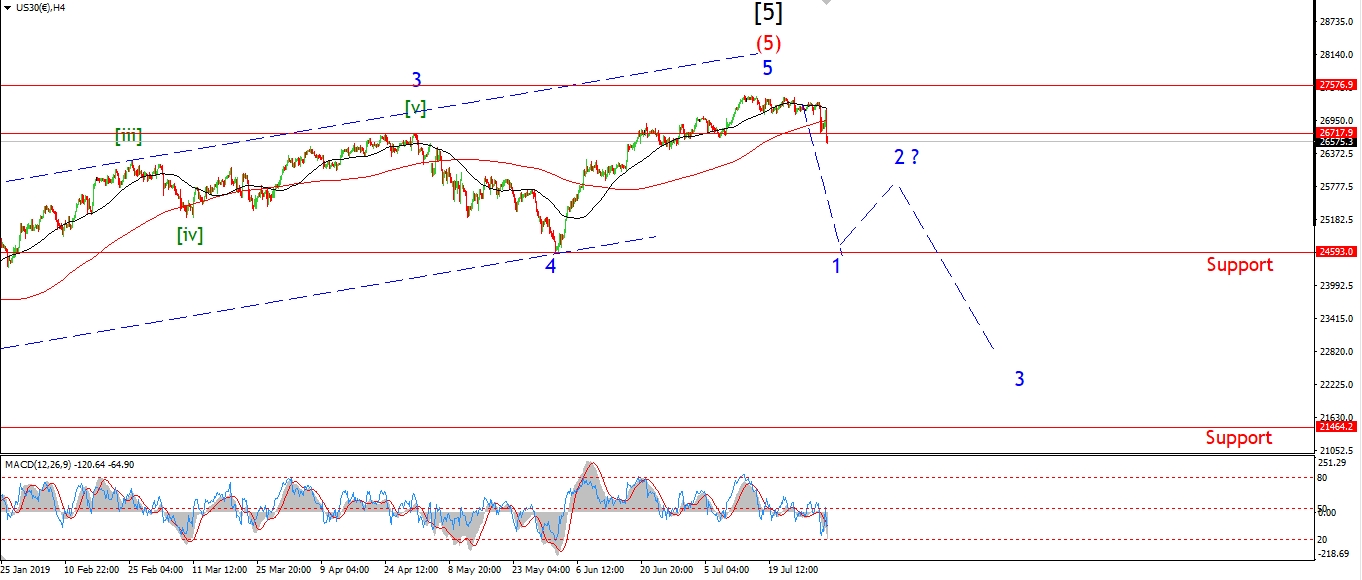 [/vc_column_text][vc_custom_heading text=”Daily” use_theme_fonts=”yes”][vc_column_text]
 [/vc_column_text][/vc_column][/vc_row]
[vc_row][vc_column][vc_column_text]
The rally in wave ‘c’ is petering out now.
It looks like wave ‘c’ of (iv) is creating one last new high
which will complete a five wave structure in wave ‘c’ itself.
The overall three wave rally is all but complete now.
And the next major move in this market should be to the downside in wave [iii].
And there is major bearish potential in that wave!
Monday;
Watch for this correction to complete by Monday evening.
and the first move lower in either wave (v) of [i],
or wave (i) of [iii] as per the alternate count.
Next week is going to be a real shock to the system in either wave count.
[/vc_column_text][/vc_column][/vc_row]
[vc_row][vc_column][vc_separator border_width=”5″][/vc_column][/vc_row][vc_row][vc_column][vc_column_text]
GOLD
[/vc_column_text][/vc_column][/vc_row][vc_row][vc_column][vc_separator border_width=”5″][/vc_column][/vc_row][vc_row][vc_column width=”2/3″][vc_custom_heading text=”1 hr” use_theme_fonts=”yes”][vc_column_text]
 [/vc_column_text][/vc_column][vc_column width=”1/3″][vc_custom_heading text=”4 Hours” use_theme_fonts=”yes”][vc_column_text]
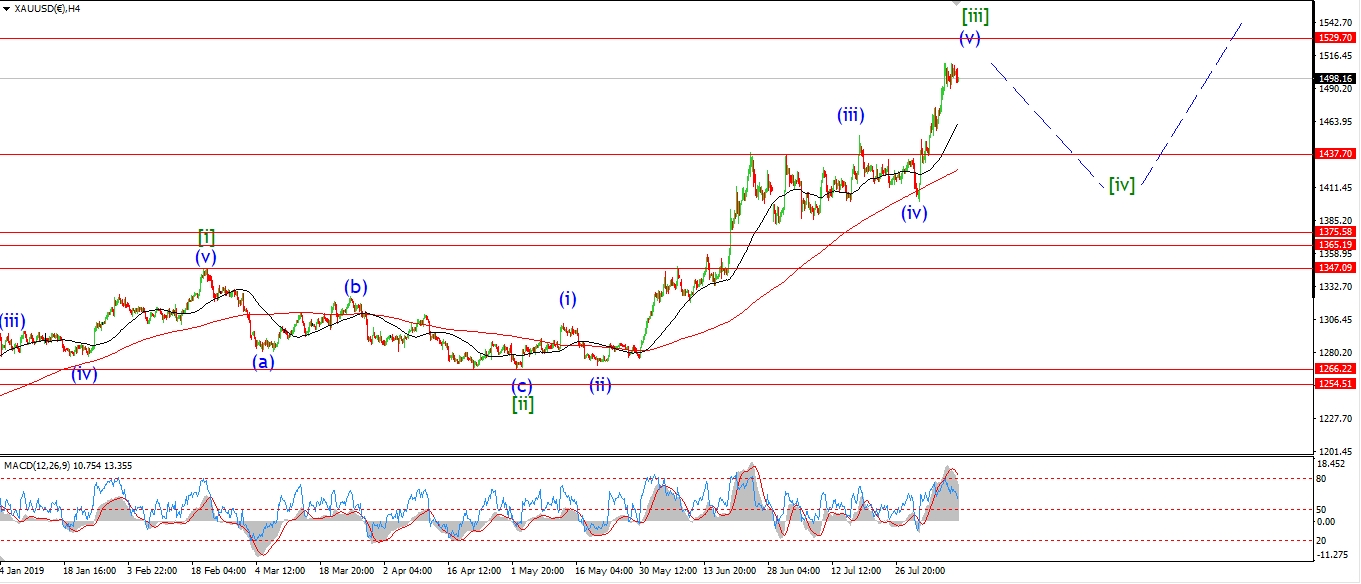 [/vc_column_text][vc_custom_heading text=”Daily” use_theme_fonts=”yes”][vc_column_text]
 [/vc_column_text][/vc_column][/vc_row]
[vc_row][vc_column][vc_column_text]
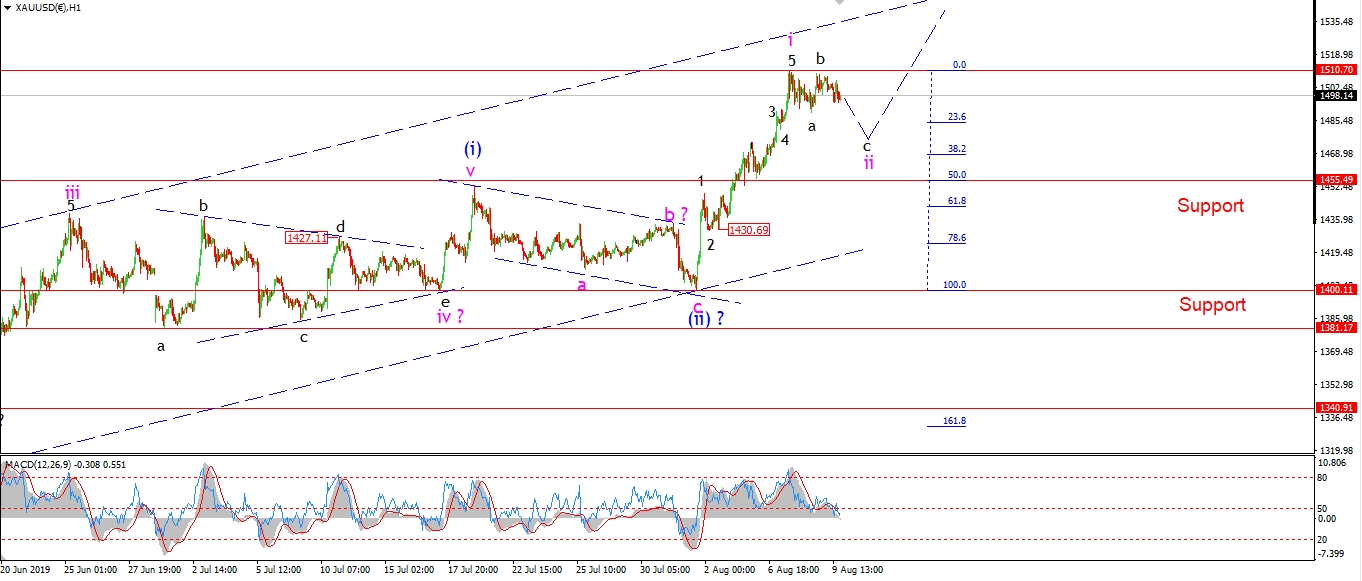
On the 4hr chart,
I have shown a different interpretation for wave [iii] green.
This wave count also calls for a correction to begin in wave [iv[ green.
Although it allows for a larger correction than currently anticipated.
If the wave count on the 4hr chart is correct,
then wave [iv] will carry price back to 1400 in three waves over the next month or so.
So far things are humming along quite well for gold,
But I will be watching the size of the current correction as it develops.
If price continues to fall below 1450,
that will favor the alternate count.
Monday.
watch for wave ‘ii’ to continue lower early next week.
The price should find support at about 1455.
[/vc_column_text][/vc_column][/vc_row]
[vc_row][vc_column][vc_separator border_width=”5″][/vc_column][/vc_row][vc_row][vc_column][vc_column_text]
U.S CRUDE OIL
[/vc_column_text][/vc_column][/vc_row][vc_row][vc_column][vc_separator border_width=”5″][/vc_column][/vc_row][vc_row][vc_column width=”2/3″][vc_custom_heading text=”1 hr” use_theme_fonts=”yes”][vc_column_text]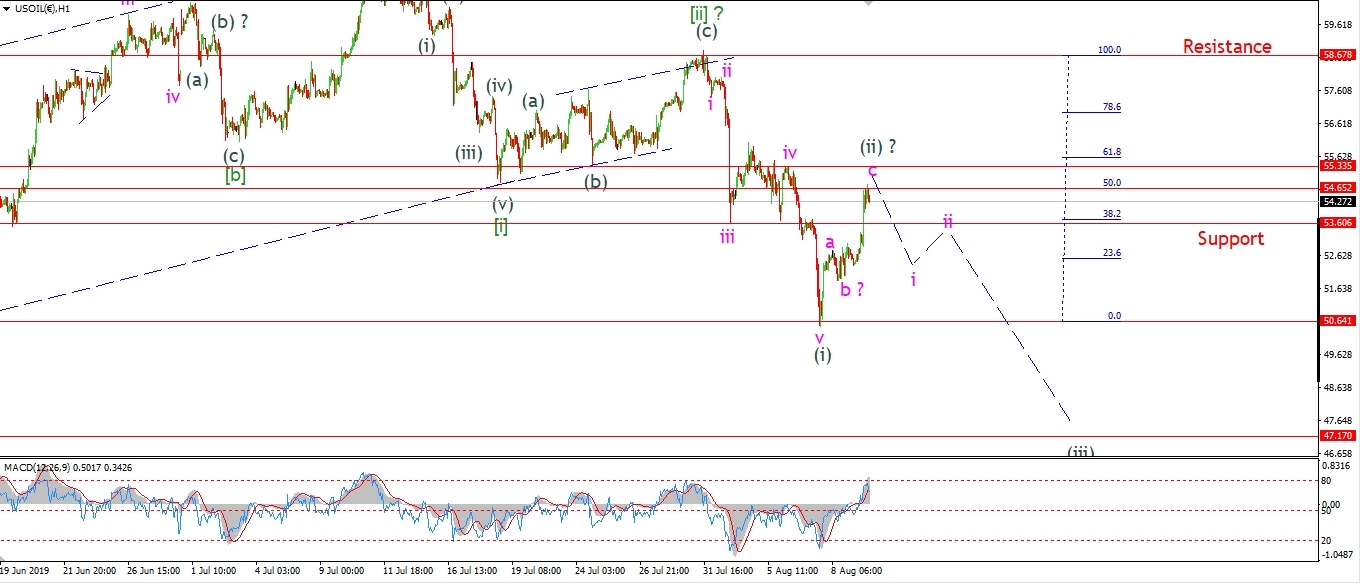 [/vc_column_text][/vc_column][vc_column width=”1/3″][vc_custom_heading text=”4 Hours” use_theme_fonts=”yes”][vc_column_text]
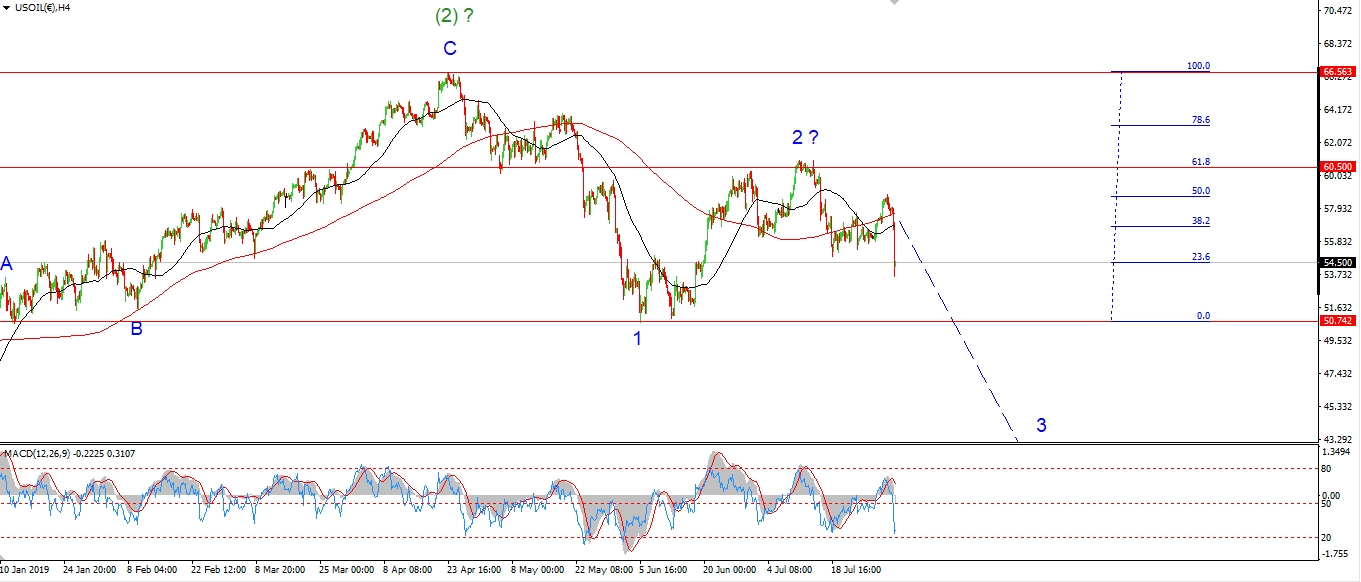 [/vc_column_text][vc_custom_heading text=”Daily” use_theme_fonts=”yes”][vc_column_text]
 [/vc_column_text][/vc_column][/vc_row]
[vc_row][vc_column][vc_column_text]
I have switched to the alternate count in crude oil tonight.
The size of the correction fits a larger correction in wave (ii),
rather than lower degree correction in wave ‘ii’ pink as shown last night.
At todays highs,
the price has traced out a three wave correction.
The rally in wave (ii) has reached the previous fourth wave,
and this evenings high has hit the 50% retracement level also.
So;
Along with the stock market,
we are sitting at corrective lower highs after a three wave correction.
The next big move should be to the downside again.
Monday;
Watch for wave (iii) to begin with a drop back below 53.00 again.
[/vc_column_text][/vc_column][/vc_row]
[vc_row][vc_column][vc_separator border_width=”5″][/vc_column][/vc_row][vc_row][vc_column][vc_column_text]
US 10 yr Treasuries.
[/vc_column_text][/vc_column][/vc_row][vc_row][vc_column][vc_separator border_width=”5″][/vc_column][/vc_row][vc_row][vc_column width=”2/3″][vc_custom_heading text=”1 hr” use_theme_fonts=”yes”][vc_column_text]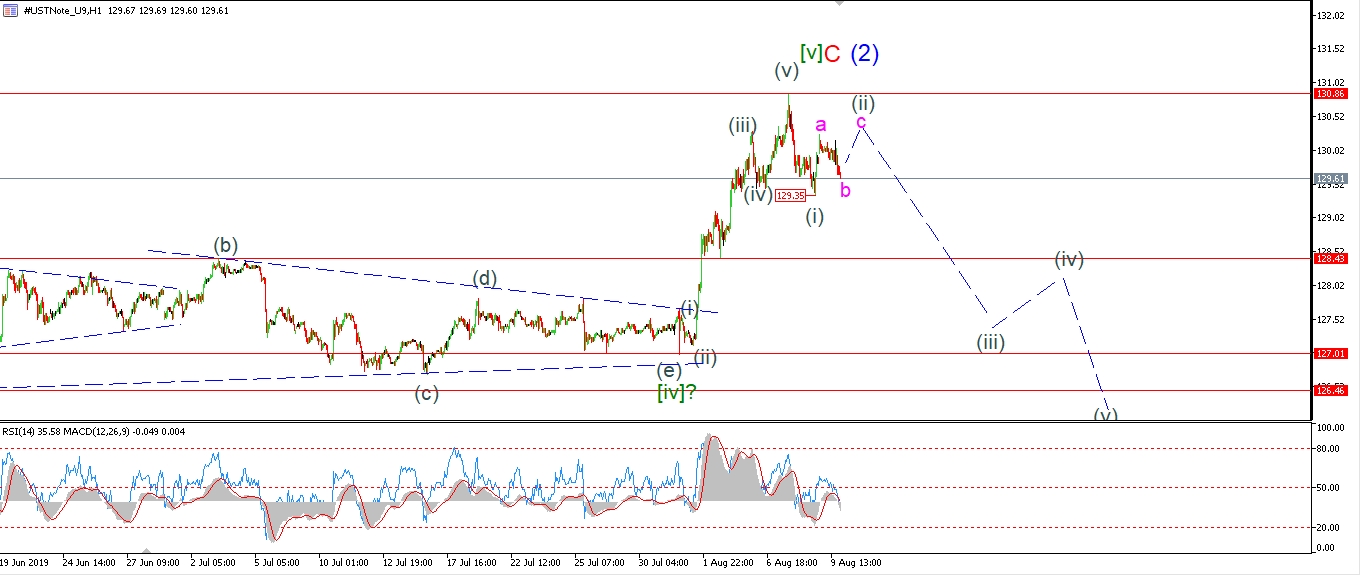 [/vc_column_text][/vc_column][vc_column width=”1/3″][vc_custom_heading text=”4 Hours” use_theme_fonts=”yes”][vc_column_text]
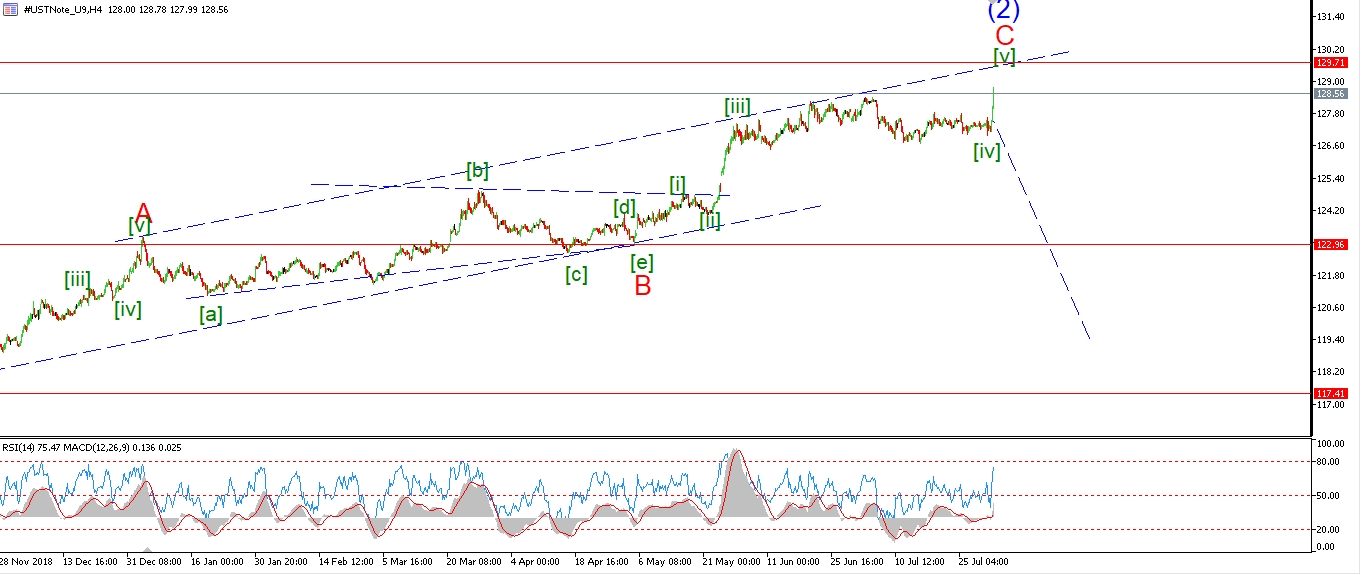 [/vc_column_text][vc_custom_heading text=”Daily” use_theme_fonts=”yes”][vc_column_text]
 [/vc_column_text][/vc_column][/vc_row]
[vc_row][vc_column][vc_column_text]
The short term count is beginning to look promising on the bearish side.
Todays action saw a decline in a possible wave ‘b’ of (ii) as shown.
This count suggests a further rise again in wave ‘c’ of (ii) on Monday
this will complete a three wave correction.
And we should be set then for a decline again in wave (iii) for the remainder of the week.
Tomorrow;
Watch for wave (ii) to complete below 130.86.
A break of 129.35 again will signal wave (iii) has begun.
[/vc_column_text][/vc_column][/vc_row]
[vc_row][vc_column][vc_separator border_width=”5″][/vc_column][/vc_row][vc_row][vc_column][vc_column_text]
SILVER
[/vc_column_text][/vc_column][/vc_row][vc_row][vc_column][vc_separator border_width=”5″][/vc_column][/vc_row][vc_row][vc_column width=”2/3″][vc_custom_heading text=”1 hr” use_theme_fonts=”yes”][vc_column_text]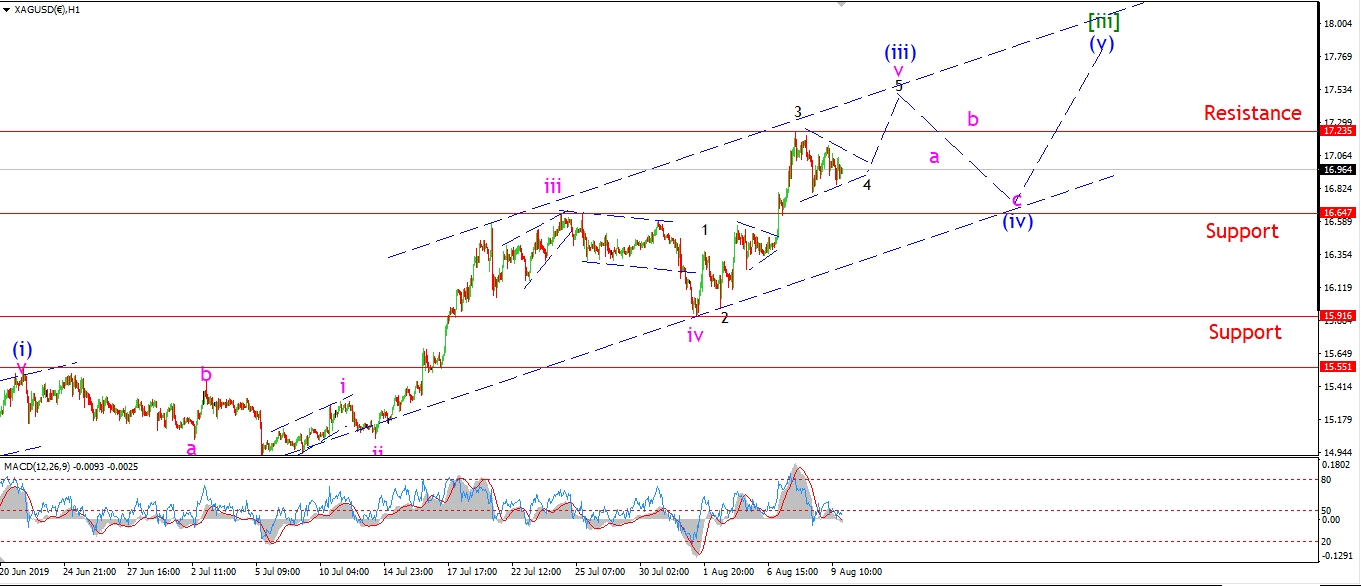 [/vc_column_text][/vc_column][vc_column width=”1/3″][vc_custom_heading text=”4 Hours” use_theme_fonts=”yes”][vc_column_text]
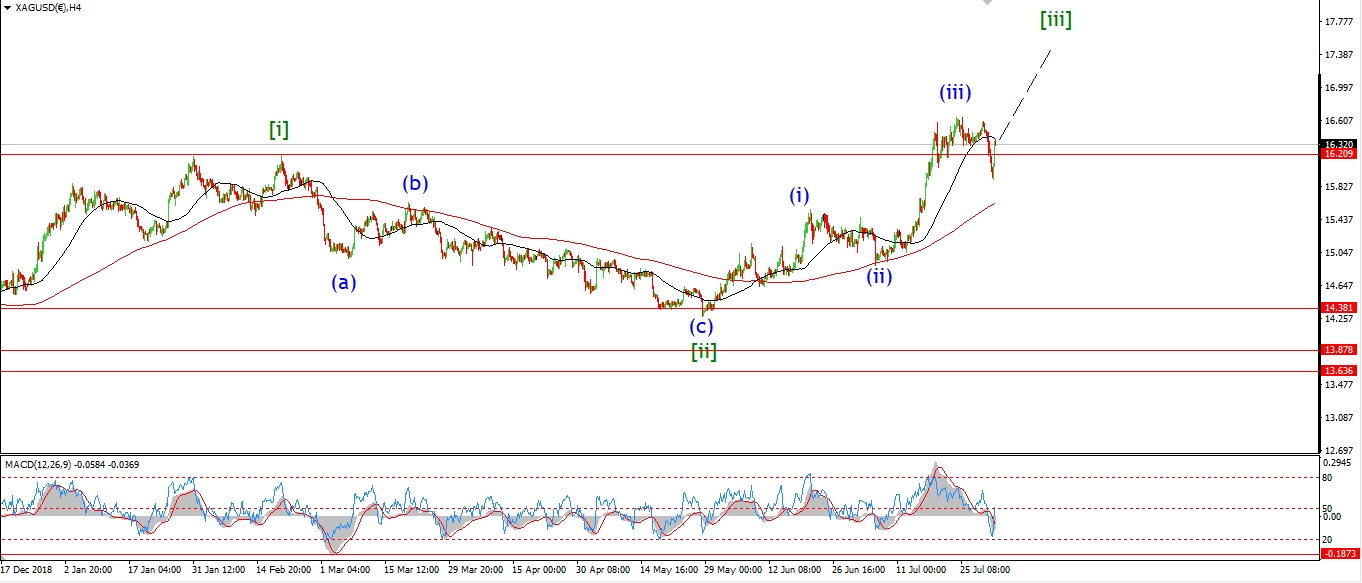 [/vc_column_text][vc_custom_heading text=”Daily” use_theme_fonts=”yes”][vc_column_text]
 [/vc_column_text][/vc_column][/vc_row]
[vc_row][vc_column][vc_column_text]
I have switched to the slightly more bullish alternate count this evening.
The corrective action this week is now viewed as a minor fourth wave within wave ‘v’ of (iii).
If this count holds,
then we should see another pop higher towards 17.50 over the coming days to complete wave (iii).
And then wave (iv) blue will carry the price lower in three waves.
Wave (iv) should find support at about 16.60 again where the price meets the rising trend line.
Monday;
Watch for this small triangle to continue sideways and complete monday at about 16.90.
Wave ‘5’ of ‘v’ should push above 17.23 at a minimum.
[/vc_column_text][/vc_column][/vc_row]
[vc_row][vc_column][vc_separator border_width=”5″][/vc_column][/vc_row][vc_row][vc_column][vc_column_text]
S&P 500.
[/vc_column_text][/vc_column][/vc_row][vc_row][vc_column][vc_separator border_width=”5″][/vc_column][/vc_row][vc_row][vc_column width=”2/3″][vc_custom_heading text=”1 hr” use_theme_fonts=”yes”][vc_column_text]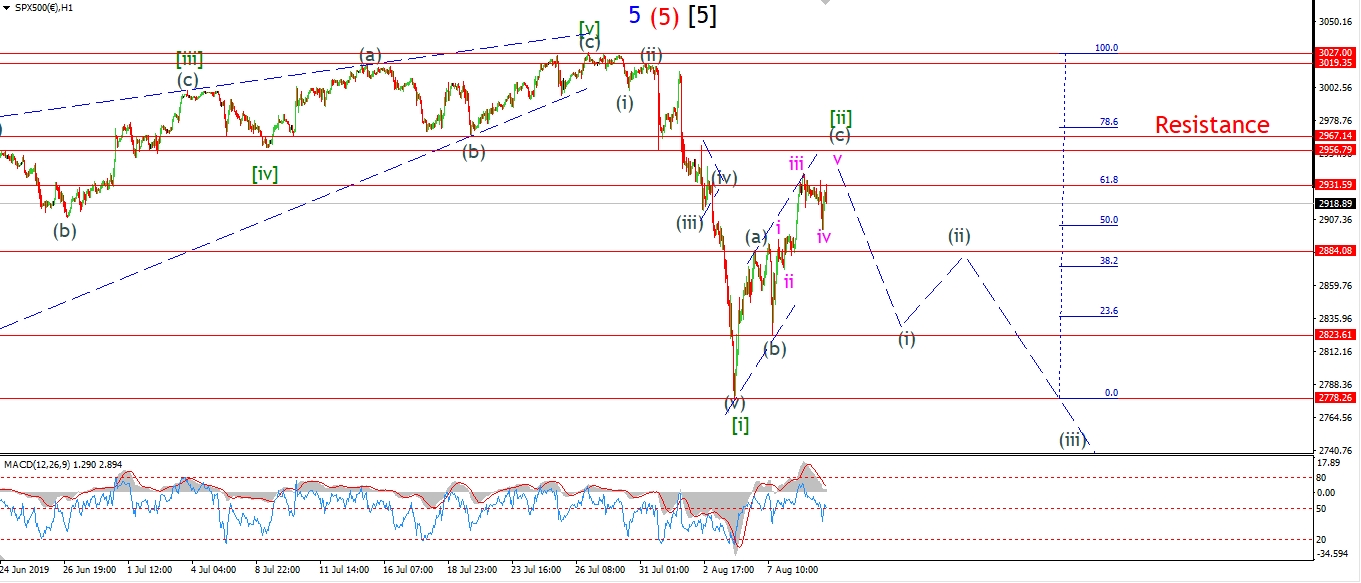 [/vc_column_text][/vc_column][vc_column width=”1/3″][vc_custom_heading text=”4 Hours” use_theme_fonts=”yes”][vc_column_text]
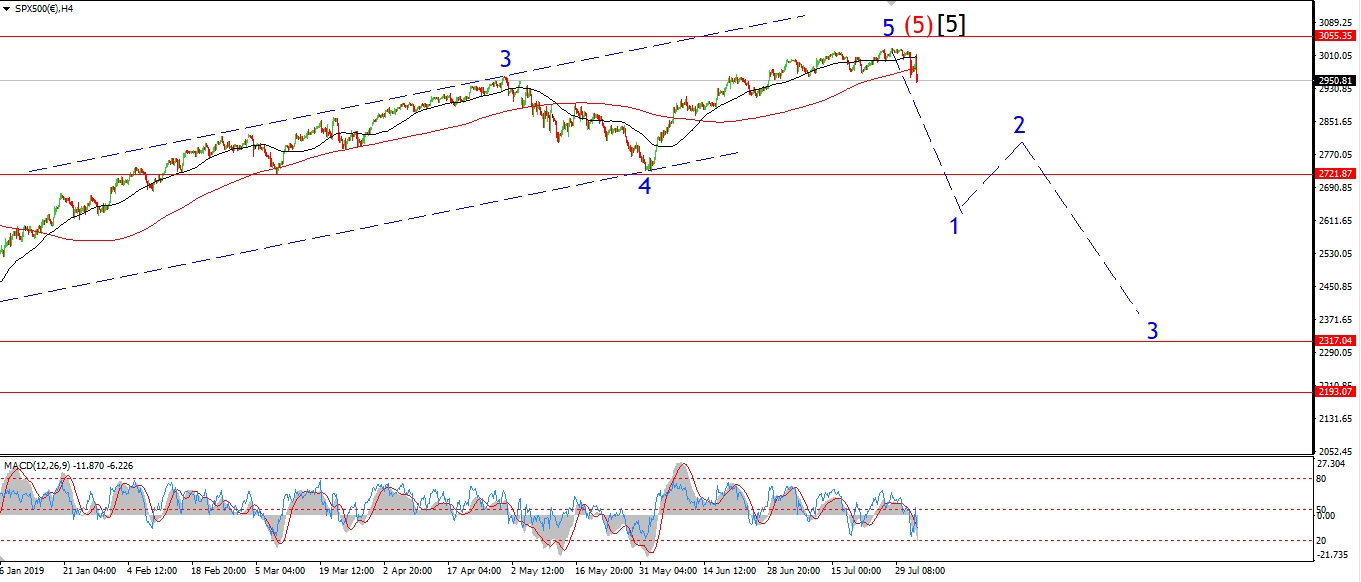 [/vc_column_text][vc_custom_heading text=”Daily” use_theme_fonts=”yes”][vc_column_text]
 [/vc_column_text][/vc_column][/vc_row]
[vc_row][vc_column][vc_column_text]
The drop off the all time high has created a five wave pattern.
And now the corrective rally has just completed a three wave rally.
In terms of a bearish Elliott wave setup,
you could not get a better one!
Todays decline looks corrective so far,
so I expect wave (c) of [ii] is still underway.
I have shown a five wave rally almost complete with the correction today labelled wave ‘iv’ of (c).
Mondays trade should complete wave (c),
and then I will be looking for a sharp drop again to begin wave [iii].
Monday;
Watch for wave ‘v’ of (c) to finish.
If we see a sharp turn lower on next week that takes out the wave (b) low at 2823,
That will signal that wave (i) of [iii] has begun.
That does it for another week.
Next week is setting up to be a wild one!
so get some rest if you can,
and smoke em if you got em!
Until Monday,
GOD bless,
and GOD’s speed to you all.
Enda.
[/vc_column_text][/vc_column][/vc_row]
[vc_row][vc_column][vc_separator border_width=”5″][/vc_column][/vc_row]