
[vc_row][vc_column][vc_separator border_width=”5″][/vc_column][/vc_row]
[vc_row][vc_column][vc_column_text]
Good evening all.
[/vc_column_text][/vc_column][/vc_row]
[vc_row][vc_column][vc_separator border_width=”5″][/vc_column][/vc_row]
[vc_row][vc_column][vc_column_text]
EURUSD
[/vc_column_text][/vc_column][/vc_row]
[vc_row][vc_column][vc_separator border_width=”5″][/vc_column][/vc_row][vc_row][vc_column width=”2/3″][vc_custom_heading text=”1 hr” use_theme_fonts=”yes”][vc_column_text]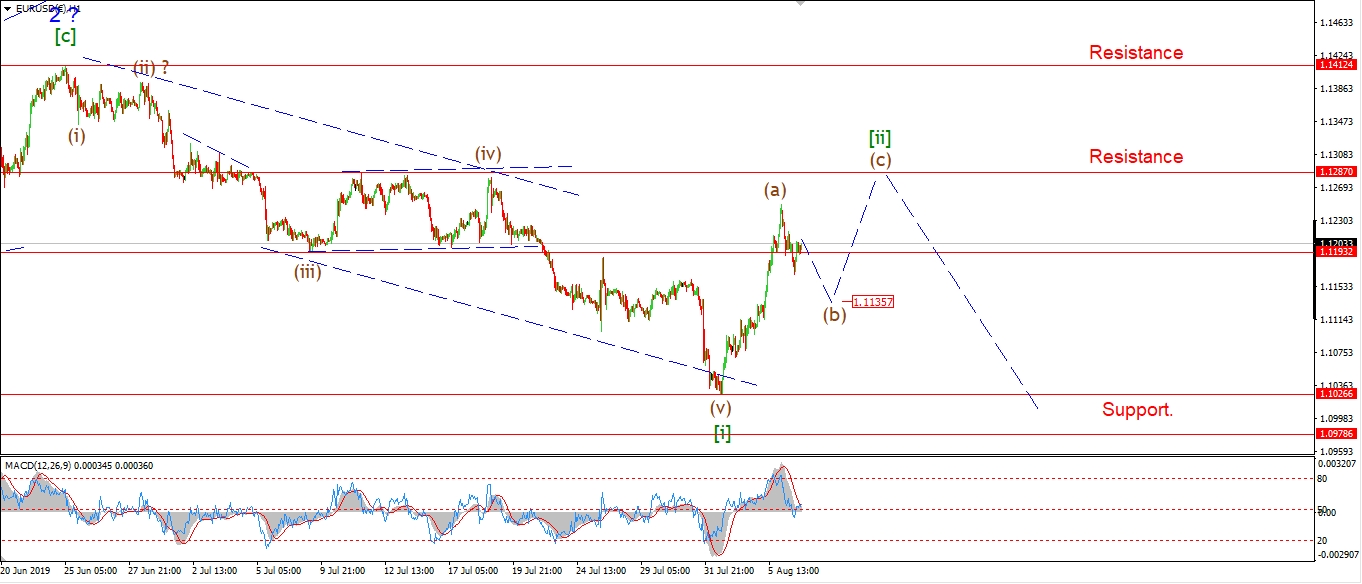 [/vc_column_text][/vc_column][vc_column width=”1/3″][vc_custom_heading text=”4 Hours” use_theme_fonts=”yes”][vc_column_text]
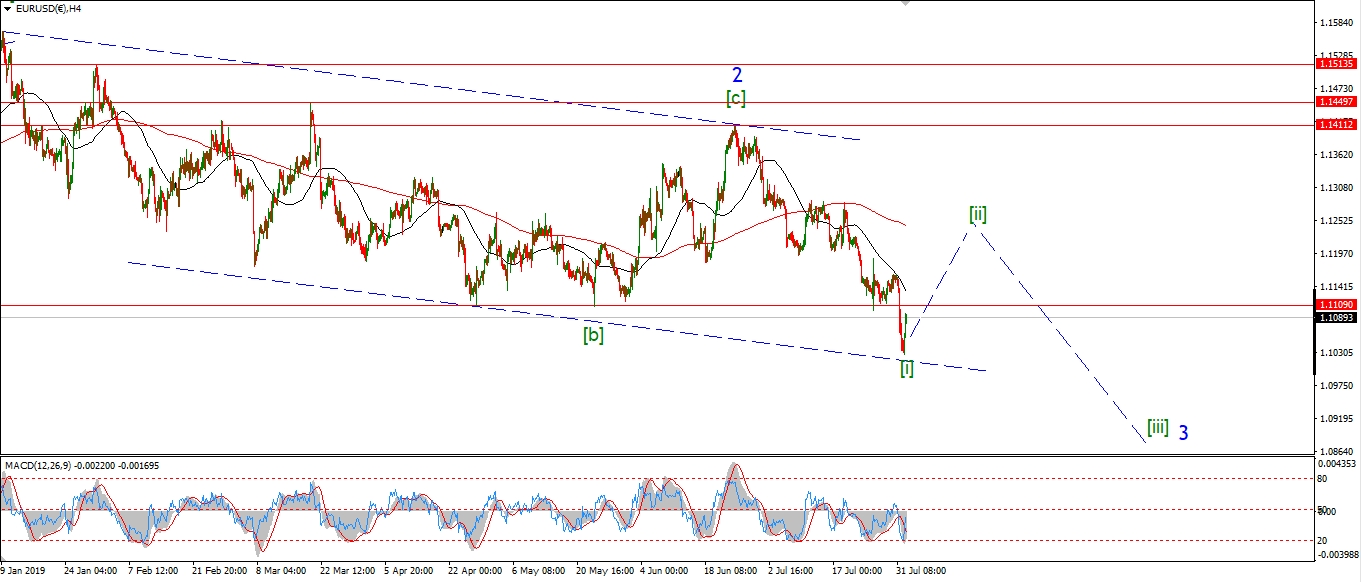 [/vc_column_text][vc_custom_heading text=”Daily” use_theme_fonts=”yes”][vc_column_text]
 [/vc_column_text][/vc_column][/vc_row]
[vc_row][vc_column][vc_column_text]
EURUSD has rallied in five waves off the 1.1026 lows.
The question now is this,
is the market tracing out a simple zigzag, 5,3,5 pattern to complete wave [ii].
And then we turn down again into wave [iii].
Or is there a bigger move on the cards in an alternate wave count.
The main alternate count is shown on the daily chart.
And that will allow for a move back up to the 1.1825 level to complete a larger wave (2) red.
In the short term both wave count are pointing up further.
The main count suggests that wave [ii] should top out at about 1.1300 or so.
Wave (b) seems to be underway now,
and it should fall to about 1.1150 to complete and the wave (C) will carry us up to the target.
Tomorrow;
Watch for wave (b) to complete and wave (c) to continue higher.
[/vc_column_text][/vc_column][/vc_row]
[vc_row][vc_column][vc_separator border_width=”5″][/vc_column][/vc_row][vc_row][vc_column][vc_column_text]
GBPUSD
[/vc_column_text][/vc_column][/vc_row][vc_row][vc_column][vc_separator border_width=”5″][/vc_column][/vc_row][vc_row][vc_column width=”2/3″][vc_custom_heading text=”1 hr” use_theme_fonts=”yes”][vc_column_text]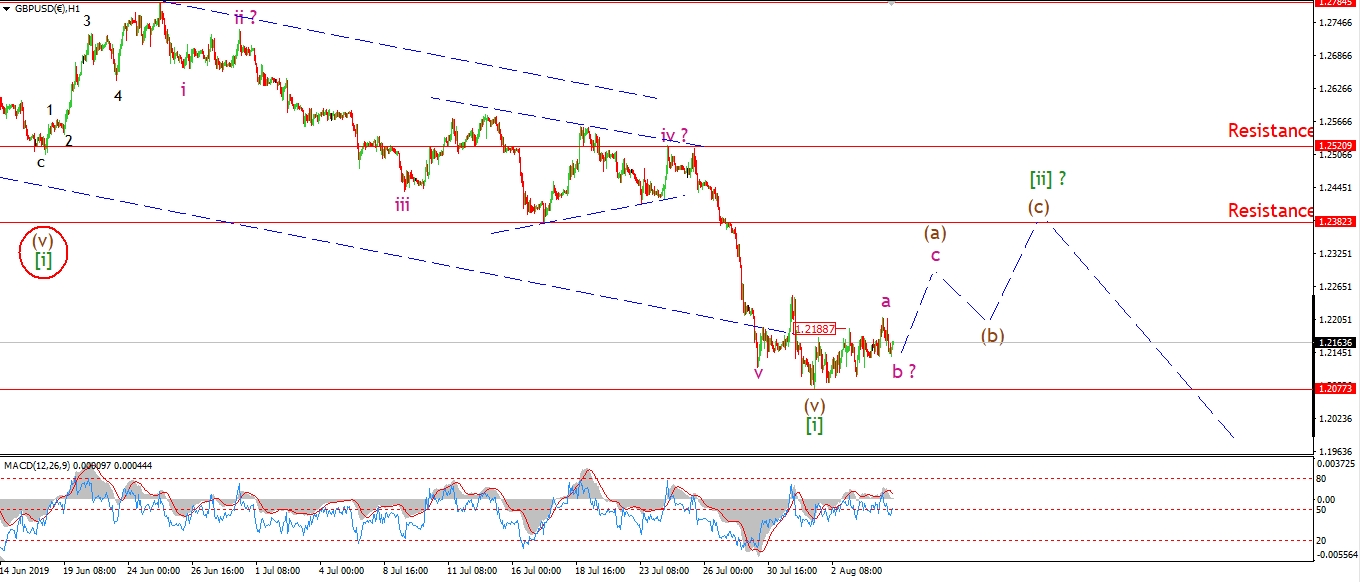 [/vc_column_text][/vc_column][vc_column width=”1/3″][vc_custom_heading text=”4 Hours” use_theme_fonts=”yes”][vc_column_text]
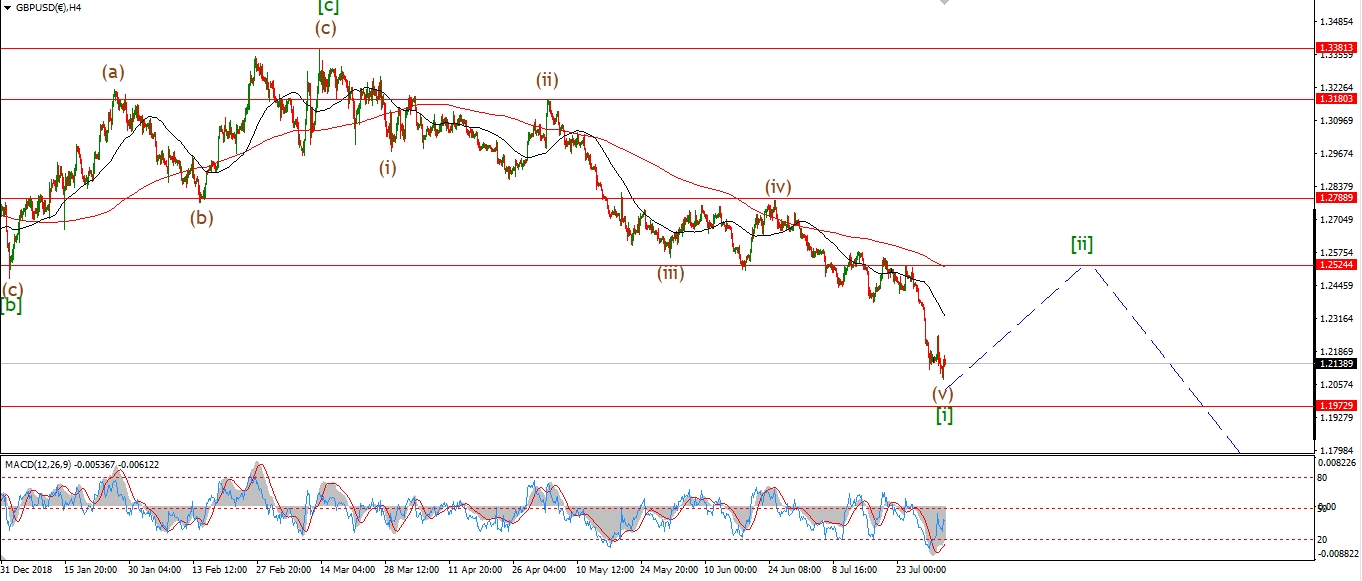 [/vc_column_text][vc_custom_heading text=”Daily” use_theme_fonts=”yes”][vc_column_text]
 [/vc_column_text][/vc_column][/vc_row]
[vc_row][vc_column][vc_column_text]
Wave [ii] is still only in the early stages after another flat days trade.
The price should counter act the extreme bearishness by rallying in a correction higher.
And this action should take place over the coming days.
So I do expect the rally to pick up soon.
The eventual pattern is undecided yet.
I have shown a posible complex flat underway.
We will have to wait and see though.
Tomorrow;
Watch for wave (a) of [ii] to continue higher to about 1.2300 before correcting lower again in wave (b).
[/vc_column_text][/vc_column][/vc_row]
[vc_row][vc_column][vc_separator border_width=”5″][/vc_column][/vc_row][vc_row][vc_column][vc_column_text]
USDJPY
[/vc_column_text][/vc_column][/vc_row][vc_row][vc_column][vc_separator border_width=”5″][/vc_column][/vc_row][vc_row][vc_column width=”2/3″][vc_custom_heading text=”1 hr” use_theme_fonts=”yes”][vc_column_text]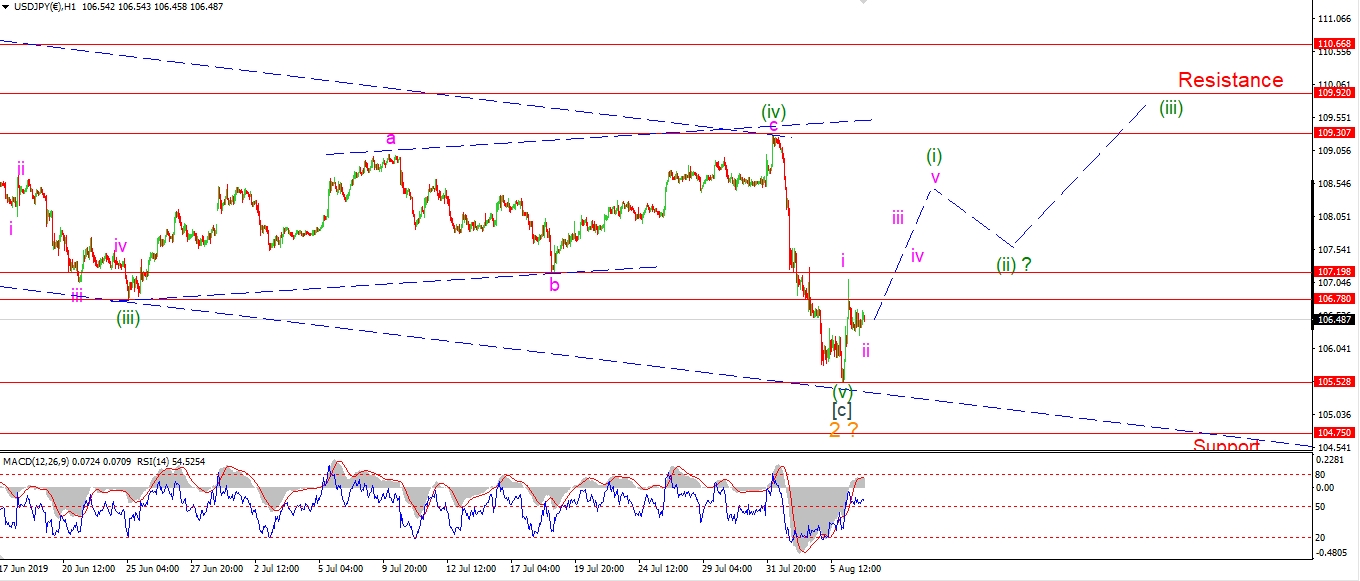 [/vc_column_text][/vc_column][vc_column width=”1/3″][vc_custom_heading text=”4 Hours” use_theme_fonts=”yes”][vc_column_text]
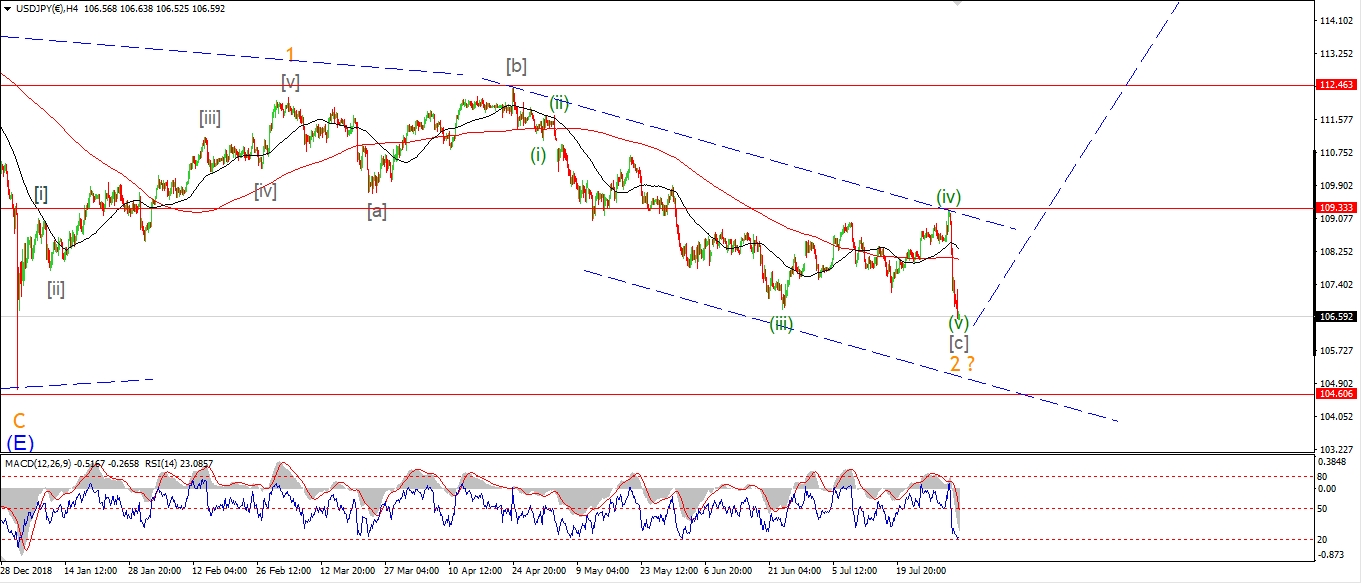 [/vc_column_text][vc_custom_heading text=”Daily” use_theme_fonts=”yes”][vc_column_text]
 [/vc_column_text][/vc_column][/vc_row]
[vc_row][vc_column][vc_column_text]
The bullish count was saved by the bell with a rally off the wave ‘2’ low today.
I have labelled this as wave ‘i’ and ‘ii’ of (i).
So I want to see the rally continue for the next few days at least.
The goal is for wave (i) to complete a clear five waves up to begin a larger move up into wave ‘3’.
Tomorrow;
Watch for the low at wave ‘2’ of 105.53 to hold now for good!
Lets see if this rally continues higher in five waves.
[/vc_column_text][/vc_column][/vc_row]
[vc_row][vc_column][vc_separator border_width=”5″][/vc_column][/vc_row][vc_row][vc_column][vc_column_text]
DOW JONES INDUSTRIALS
[/vc_column_text][/vc_column][/vc_row][vc_row][vc_column][vc_separator border_width=”5″][/vc_column][/vc_row][vc_row][vc_column width=”2/3″][vc_custom_heading text=”1 hr” use_theme_fonts=”yes”][vc_column_text]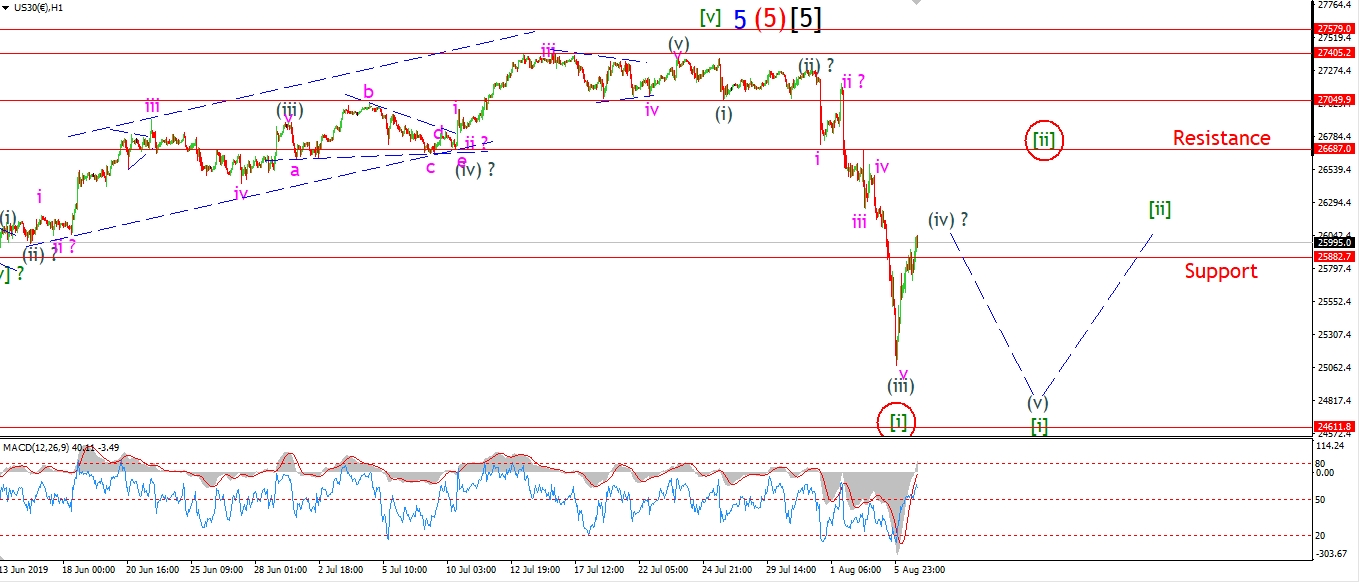 [/vc_column_text][/vc_column][vc_column width=”1/3″][vc_custom_heading text=”4 Hours” use_theme_fonts=”yes”][vc_column_text]
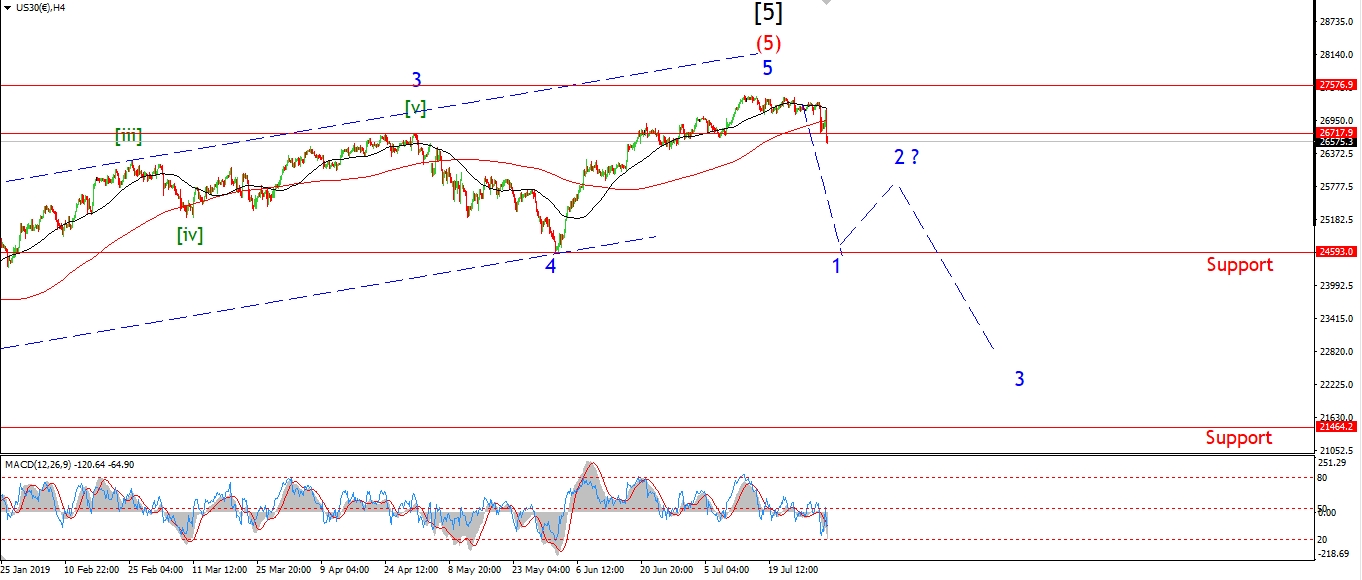 [/vc_column_text][vc_custom_heading text=”Daily” use_theme_fonts=”yes”][vc_column_text]
 [/vc_column_text][/vc_column][/vc_row]
[vc_row][vc_column][vc_column_text]
The dead cat bounce begins!
I am considering todays rally as part of wave (iv) of [i].
This rally should trace out a three wave form in wave (iv),
and then we should decline again in wave (v) to complete the larger wave [i] down.
There is a way of viewing yesterdays lows as a complete five wave decline,
but I don’t prefer it at the moment.
A whole lot depends on how this correction higher plays.
The higher we go in three waves,
the more likely that the rally is wave [ii] rather than wave (iv).
So, the next few sessions are critical to decide which count is more likely.
Tomorrow;
Watch for wave (iv) of [i] to continue tomorrow.
If wave (iv) takes the form of a triangle,
then the market will likely range sideways for a few more days.
[/vc_column_text][/vc_column][/vc_row]
[vc_row][vc_column][vc_separator border_width=”5″][/vc_column][/vc_row][vc_row][vc_column][vc_column_text]
GOLD
[/vc_column_text][/vc_column][/vc_row][vc_row][vc_column][vc_separator border_width=”5″][/vc_column][/vc_row][vc_row][vc_column width=”2/3″][vc_custom_heading text=”1 hr” use_theme_fonts=”yes”][vc_column_text]
 [/vc_column_text][/vc_column][vc_column width=”1/3″][vc_custom_heading text=”4 Hours” use_theme_fonts=”yes”][vc_column_text]
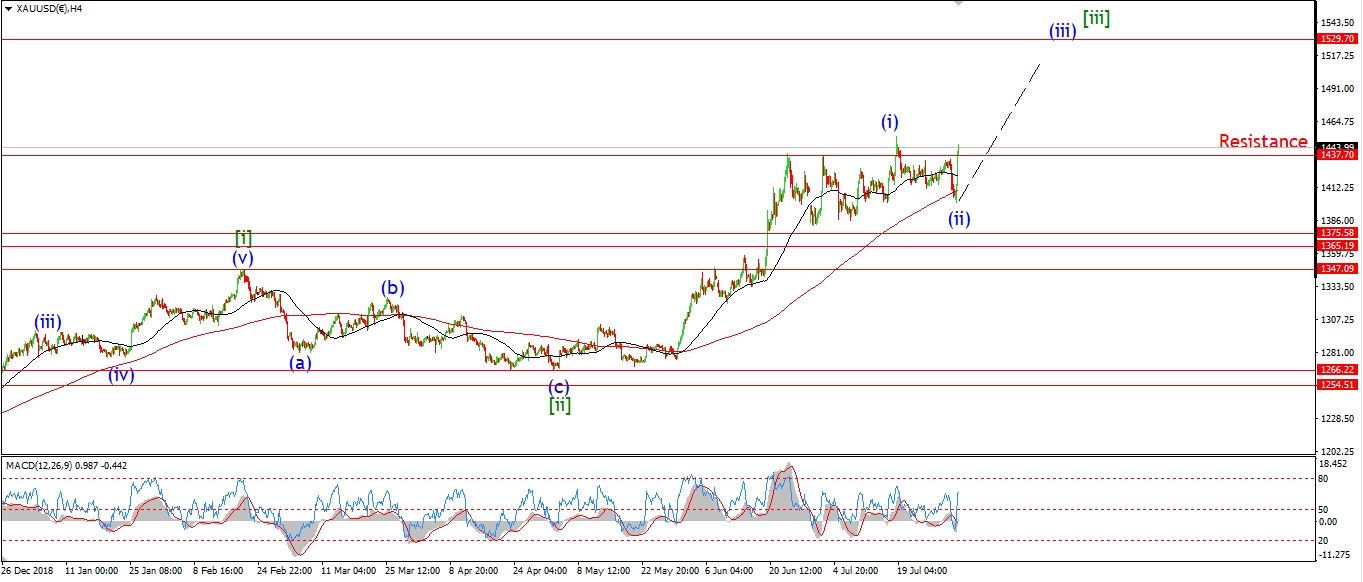 [/vc_column_text][vc_custom_heading text=”Daily” use_theme_fonts=”yes”][vc_column_text]
 [/vc_column_text][/vc_column][/vc_row]
[vc_row][vc_column][vc_column_text]
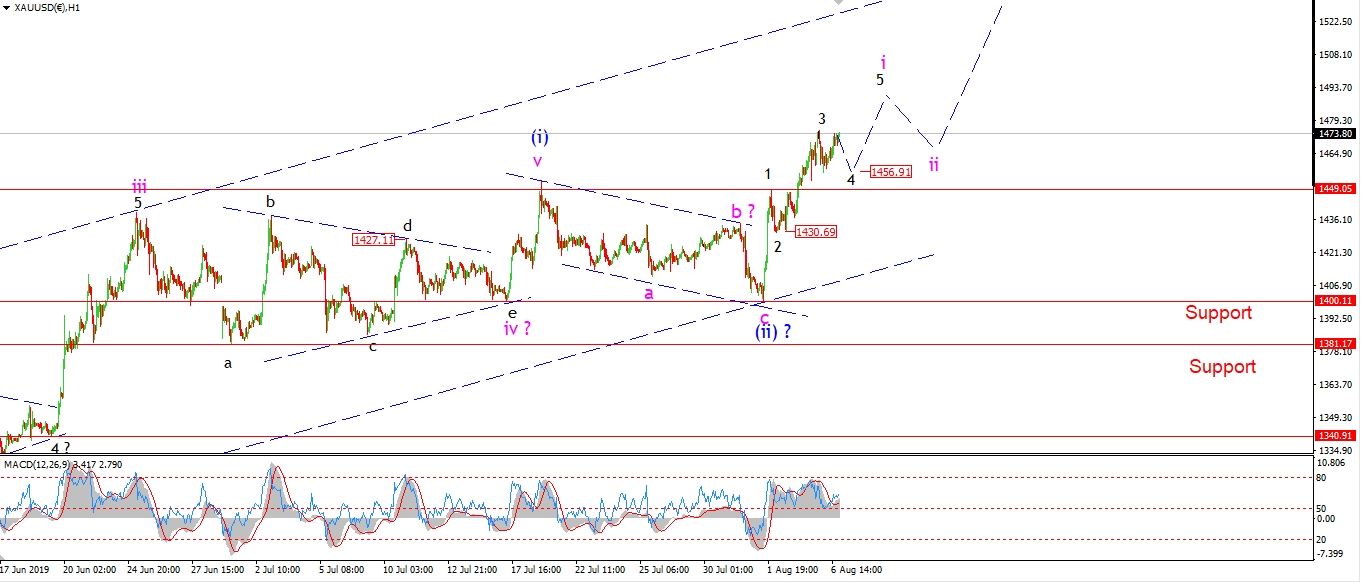
Gold is still working higher in wave ‘i’ pink.
the internal structure does not look complete yet in wave ‘4’ of ‘i’.
So we will likely see a drop back to 1456 to complete three waves in wave ‘4’.
And if the short term count is correct,
the market should rally again in wave ‘5’ of ‘i’ over the coming days.
Tomorrow;
Watch for price to hold above 1449 as shown.
A break of that level will suggest wave ‘ii’ has already begun.
[/vc_column_text][/vc_column][/vc_row]
[vc_row][vc_column][vc_separator border_width=”5″][/vc_column][/vc_row][vc_row][vc_column][vc_column_text]
U.S CRUDE OIL
[/vc_column_text][/vc_column][/vc_row][vc_row][vc_column][vc_separator border_width=”5″][/vc_column][/vc_row][vc_row][vc_column width=”2/3″][vc_custom_heading text=”1 hr” use_theme_fonts=”yes”][vc_column_text]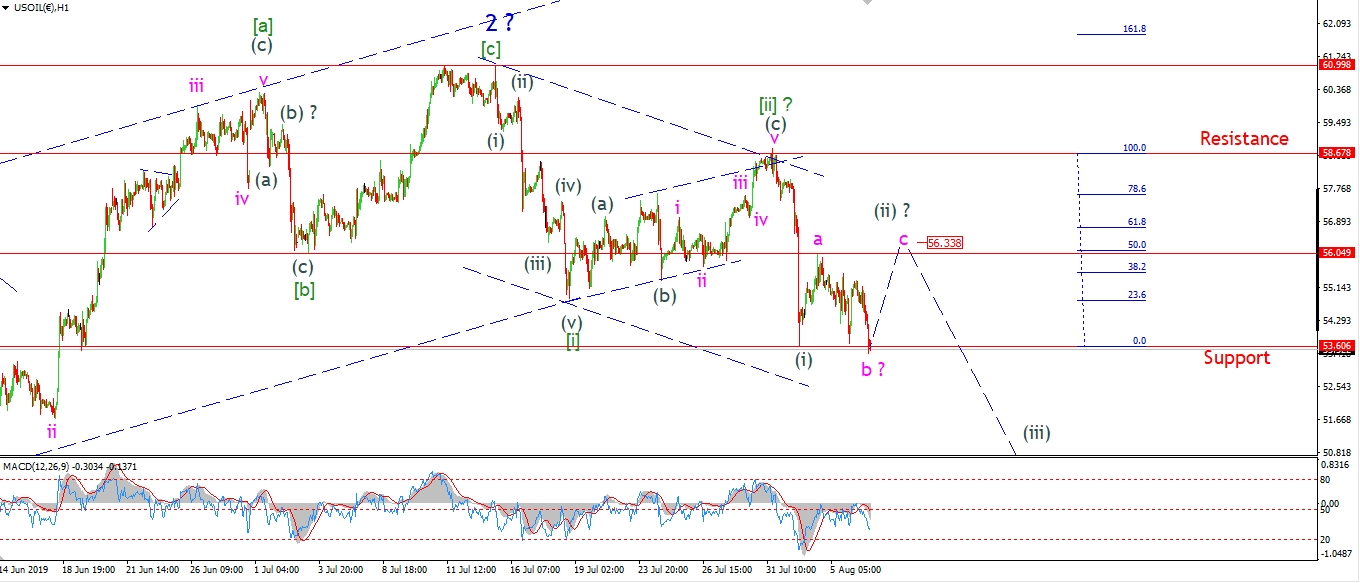 [/vc_column_text][/vc_column][vc_column width=”1/3″][vc_custom_heading text=”4 Hours” use_theme_fonts=”yes”][vc_column_text]
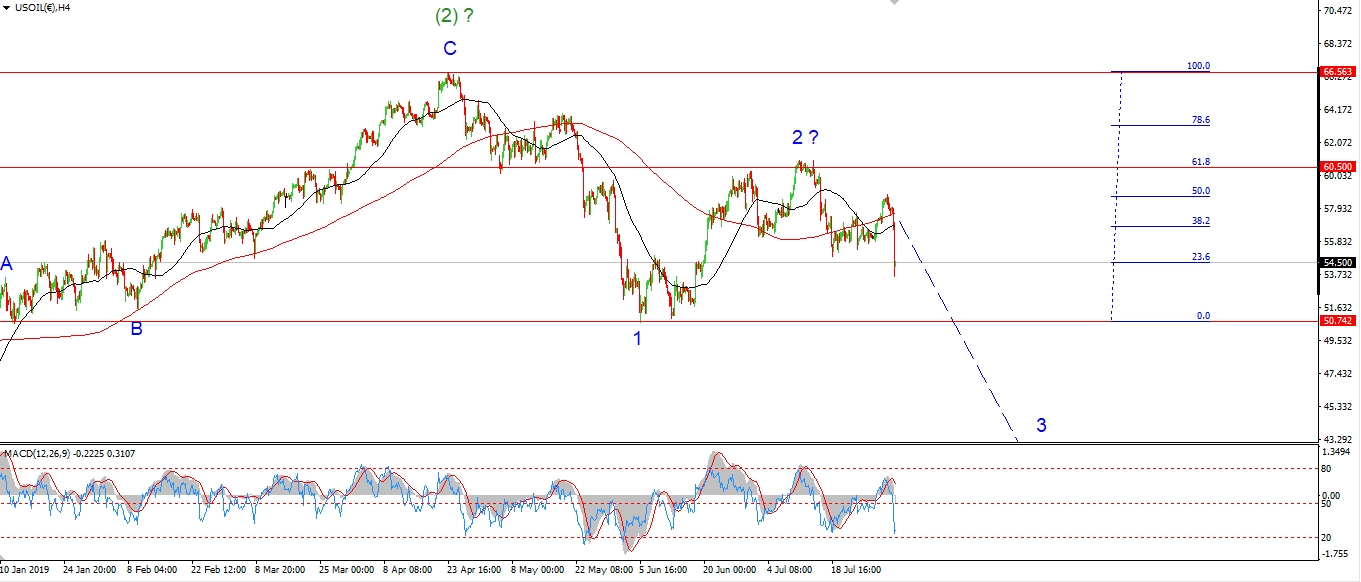 [/vc_column_text][vc_custom_heading text=”Daily” use_theme_fonts=”yes”][vc_column_text]
 [/vc_column_text][/vc_column][/vc_row]
[vc_row][vc_column][vc_column_text]
Even though crude fell to a new low again today,
I suspect this decline is still part of a correction sideways in wave (ii).
The decline off wave ‘a’ is a three wave structure,
so wave (ii) is likely tracing out an expanded flat correction.
And wave ‘c’ of (ii) should rise back above 56.04 again at wave ‘a’ to complete wave (ii).
At that point I will prepare again for a drop into wave (iii) of [iii].
Tomorrow;
Watch for wave ‘c’ to begin a five wave rally back to 56.00.
[/vc_column_text][/vc_column][/vc_row]
[vc_row][vc_column][vc_separator border_width=”5″][/vc_column][/vc_row][vc_row][vc_column][vc_column_text]
US 10 yr Treasuries.
[/vc_column_text][/vc_column][/vc_row][vc_row][vc_column][vc_separator border_width=”5″][/vc_column][/vc_row][vc_row][vc_column width=”2/3″][vc_custom_heading text=”1 hr” use_theme_fonts=”yes”][vc_column_text]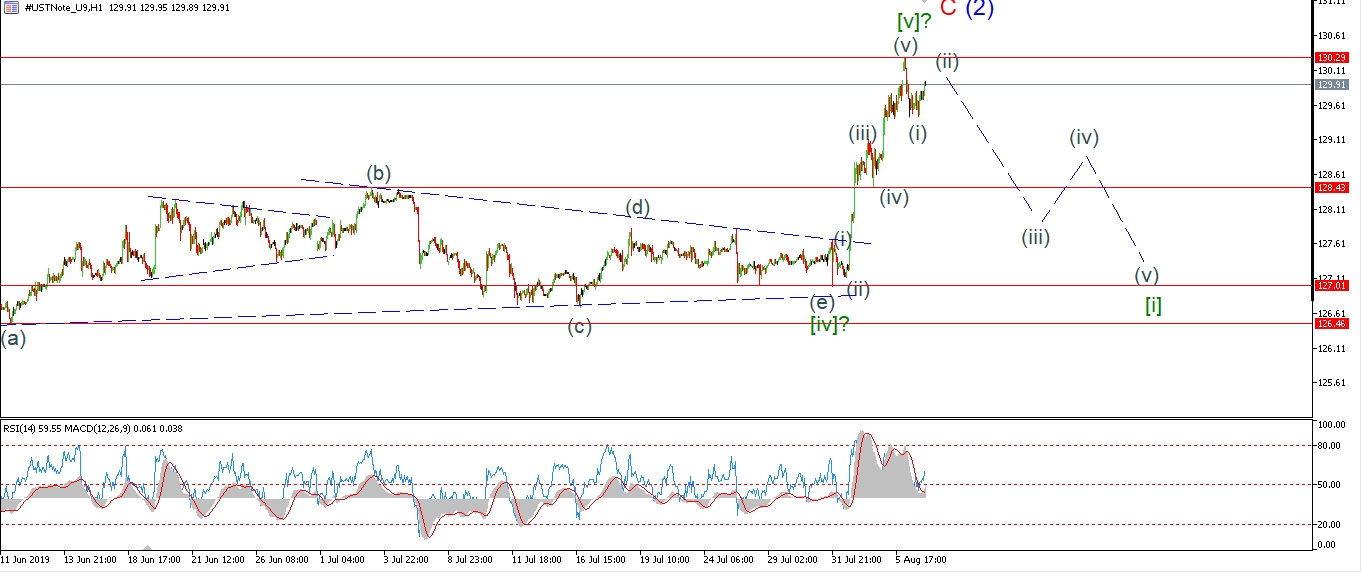 [/vc_column_text][/vc_column][vc_column width=”1/3″][vc_custom_heading text=”4 Hours” use_theme_fonts=”yes”][vc_column_text]
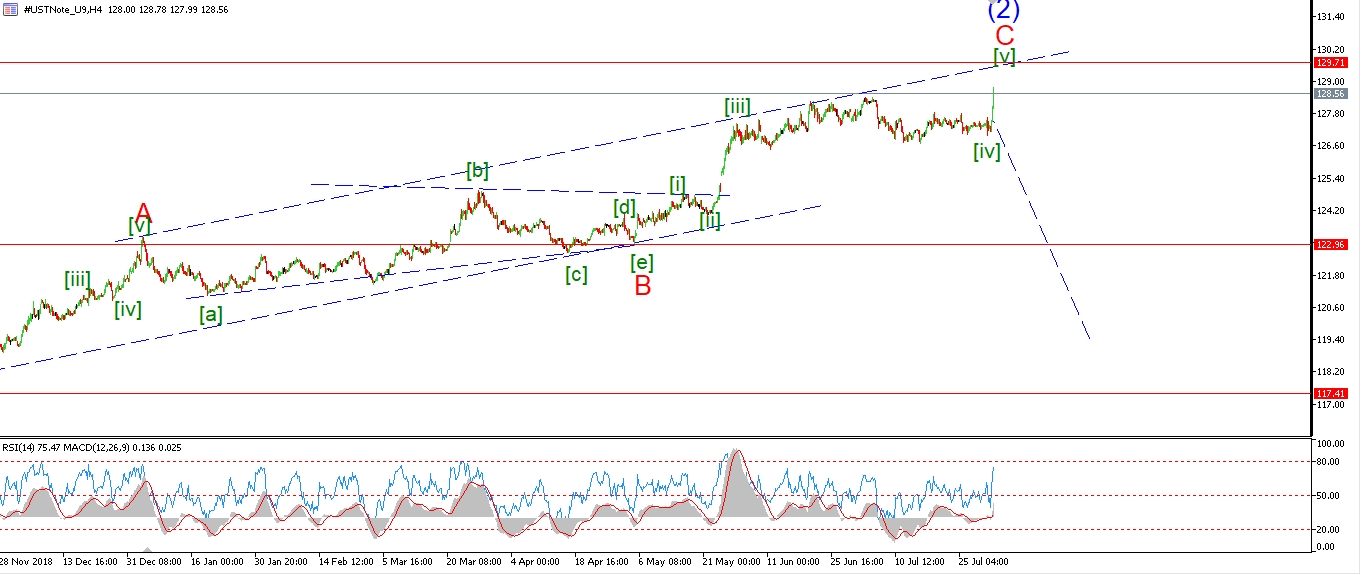 [/vc_column_text][vc_custom_heading text=”Daily” use_theme_fonts=”yes”][vc_column_text]
 [/vc_column_text][/vc_column][/vc_row]
[vc_row][vc_column][vc_column_text]
The 10YR has declined off the highs with a nice spike lower.
I have labelled this drop as wave (i) down of the next leg down.
but we must see a five wave decline occur from here to confirm the turn.
That remains the goal for the next week or so.
Tomorrow;
Watch for wave (ii) to complete a lower higher below 130.29, and then decline again in wave (iii).
Once 127.00 breaks again,
that will signal the trend has changed.
[/vc_column_text][/vc_column][/vc_row]
[vc_row][vc_column][vc_separator border_width=”5″][/vc_column][/vc_row][vc_row][vc_column][vc_column_text]
SILVER
[/vc_column_text][/vc_column][/vc_row][vc_row][vc_column][vc_separator border_width=”5″][/vc_column][/vc_row][vc_row][vc_column width=”2/3″][vc_custom_heading text=”1 hr” use_theme_fonts=”yes”][vc_column_text]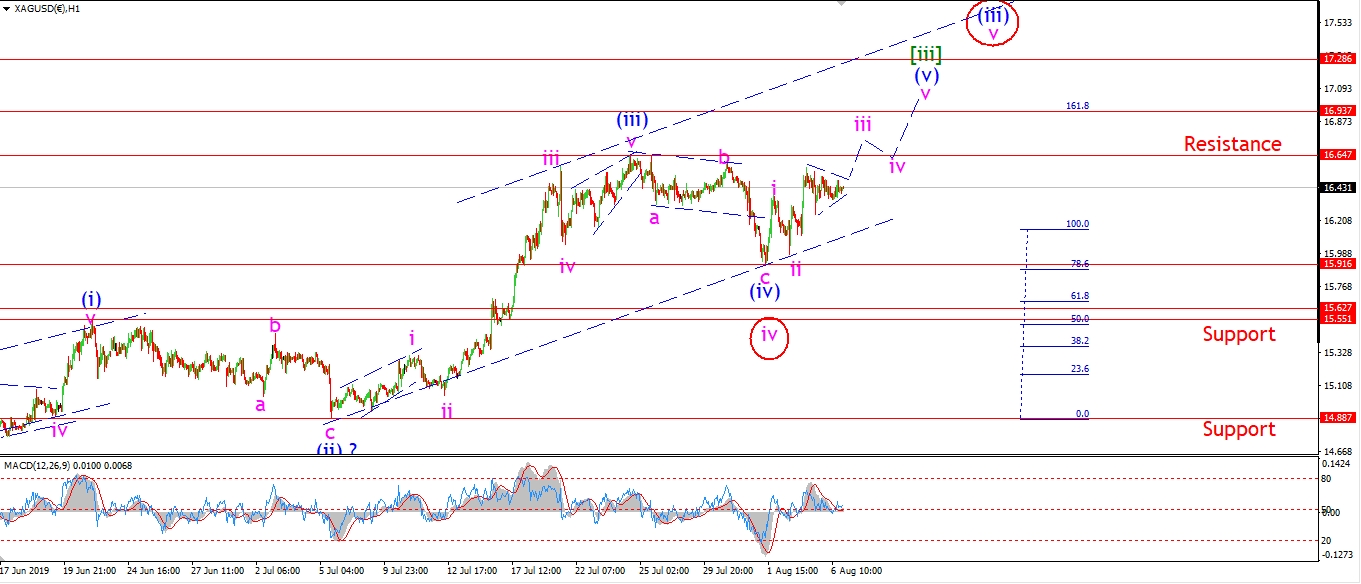 [/vc_column_text][/vc_column][vc_column width=”1/3″][vc_custom_heading text=”4 Hours” use_theme_fonts=”yes”][vc_column_text]
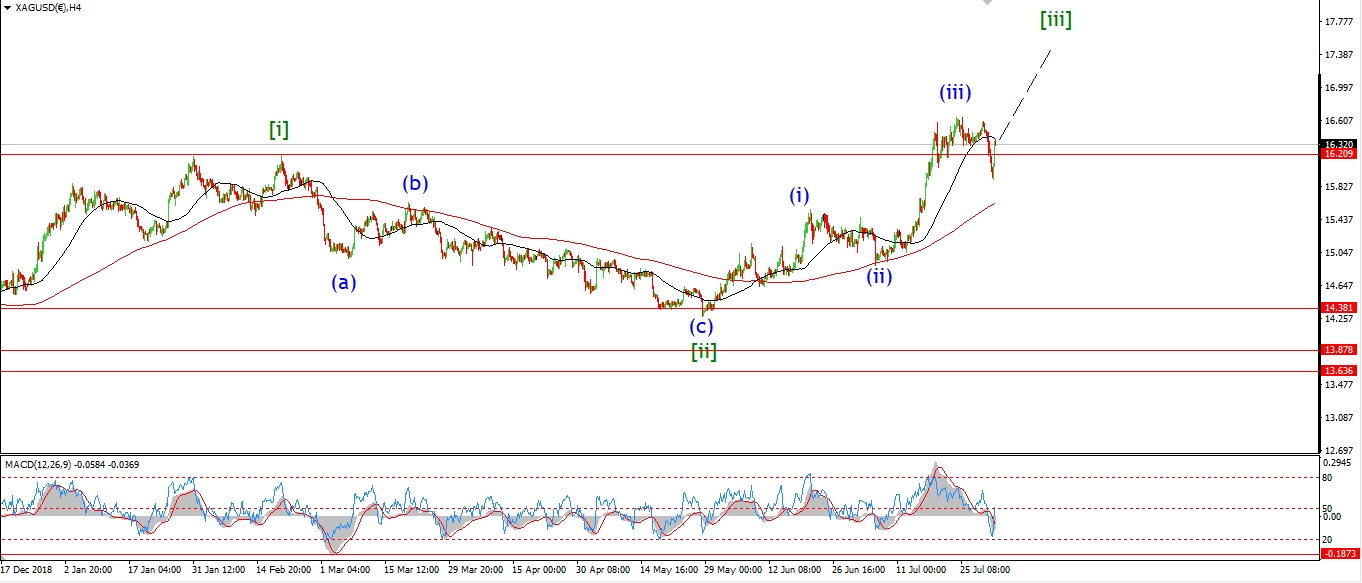 [/vc_column_text][vc_custom_heading text=”Daily” use_theme_fonts=”yes”][vc_column_text]
 [/vc_column_text][/vc_column][/vc_row]
[vc_row][vc_column][vc_column_text]
Silver has drifted sideways in a possible triangle over the last few days.
I think this is best viewed as a triangle within wave ‘iii’ of (v).
And this suggests wave ‘iii’ will push higher tomorrow back above 16.64.
This action also suggests that wave (v) has some fuel left in the tank still.
If this wave count is correct,
then wave (v) will now complete above 17.00 early next week.
Tomorrow;
Watch for wave ‘iii’ to continue higher and break initial resistance at 16.64.
[/vc_column_text][/vc_column][/vc_row]
[vc_row][vc_column][vc_separator border_width=”5″][/vc_column][/vc_row][vc_row][vc_column][vc_column_text]
S&P 500.
[/vc_column_text][/vc_column][/vc_row][vc_row][vc_column][vc_separator border_width=”5″][/vc_column][/vc_row][vc_row][vc_column width=”2/3″][vc_custom_heading text=”1 hr” use_theme_fonts=”yes”][vc_column_text]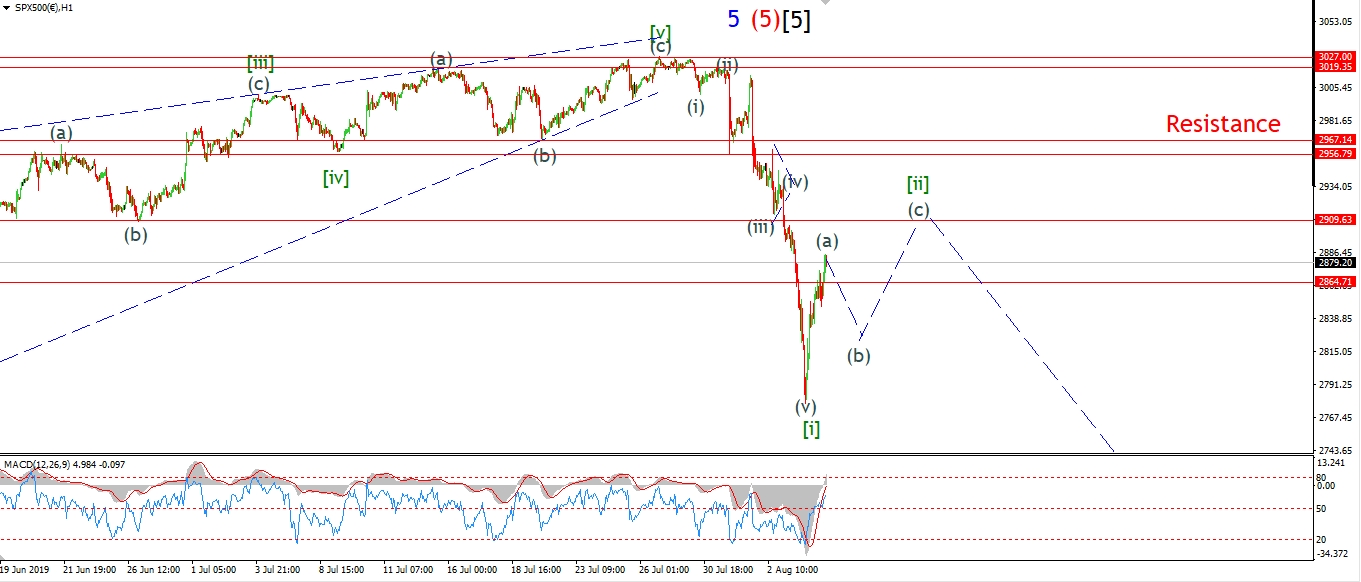 [/vc_column_text][/vc_column][vc_column width=”1/3″][vc_custom_heading text=”4 Hours” use_theme_fonts=”yes”][vc_column_text]
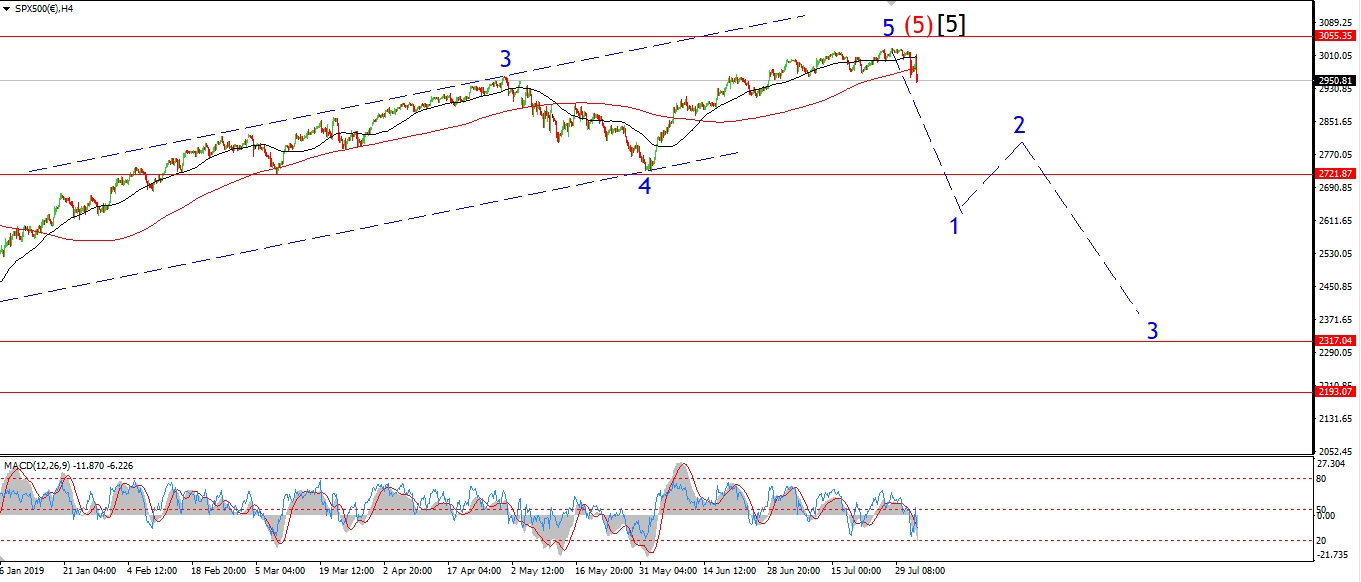 [/vc_column_text][vc_custom_heading text=”Daily” use_theme_fonts=”yes”][vc_column_text]
 [/vc_column_text][/vc_column][/vc_row]
[vc_row][vc_column][vc_column_text]
The decline in the S&P is a little easier to label as a complete five waves down.
So I have shown wave [i] now in place at the recent low.
Wave [ii] should trace out a three wave rally higher over the coming days.
The rally today is viewed as wave (a) of [ii].
Wave (b) should bring the price lower tomorrow.
And wave (c) then top out in the area of 2900 later this week.
The action I am describing will complete a bearish impulse wave off the highs.
And this should leave the market open to a crash type scenario in wave [iii] down.
Tomorrow;
Watch for wave (b) to fall back in three waves to about 2800 before wave (c) begins.
[/vc_column_text][/vc_column][/vc_row]
[vc_row][vc_column][vc_separator border_width=”5″][/vc_column][/vc_row]