
[vc_row][vc_column][vc_separator border_width=”5″][/vc_column][/vc_row]
[vc_row][vc_column][vc_column_text]
Hi there everyone.
It seems like the summer of 2007 again in many ways.
Bullishness on the economy is sky high,
but there are very menacing currents shifting underneath the surface.
Very few people recognize the trend change occurring in real time.
But these people are around.
Of course when the economy is tanking next year, the common phrase will be that nobody could see it coming…………
Exactly as before.
The old saying is apt here, “times change, people don’t.”
[/vc_column_text][/vc_column][/vc_row]
[vc_row][vc_column][vc_separator border_width=”5″][/vc_column][/vc_row]
[vc_row][vc_column][vc_column_text]
EURUSD
[/vc_column_text][/vc_column][/vc_row]
[vc_row][vc_column][vc_separator border_width=”5″][/vc_column][/vc_row][vc_row][vc_column width=”2/3″][vc_custom_heading text=”1 hr” use_theme_fonts=”yes”][vc_column_text] [/vc_column_text][/vc_column][vc_column width=”1/3″][vc_custom_heading text=”4 Hours” use_theme_fonts=”yes”][vc_column_text]
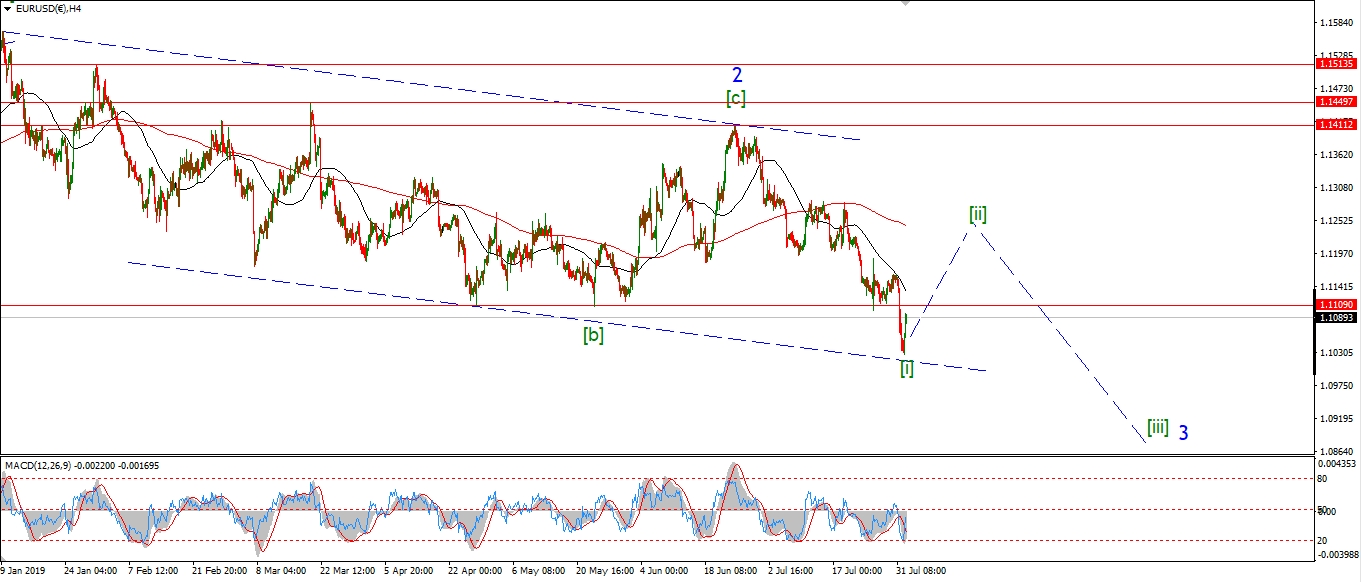 [/vc_column_text][vc_custom_heading text=”Daily” use_theme_fonts=”yes”][vc_column_text]
 [/vc_column_text][/vc_column][/vc_row]
[vc_row][vc_column][vc_column_text]
A three wave correction in wave (b) is still in force today after another flat session.
The rise into the session high was in a clear three wave pattern that has topped out.
So it looks like wave ‘c’ of (b) is now dropping again to complete the overall correction.
Wave ‘c’ should hit the lower trend channel line at about 1.1149 or so as shown.
The we can look higher again in wave (c).
Tomorrow;
Watch for wave ‘c’ to fill the trend channel again at 1.1149.
[/vc_column_text][/vc_column][/vc_row]
[vc_row][vc_column][vc_separator border_width=”5″][/vc_column][/vc_row][vc_row][vc_column][vc_column_text]
GBPUSD
[/vc_column_text][/vc_column][/vc_row][vc_row][vc_column][vc_separator border_width=”5″][/vc_column][/vc_row][vc_row][vc_column width=”2/3″][vc_custom_heading text=”1 hr” use_theme_fonts=”yes”][vc_column_text]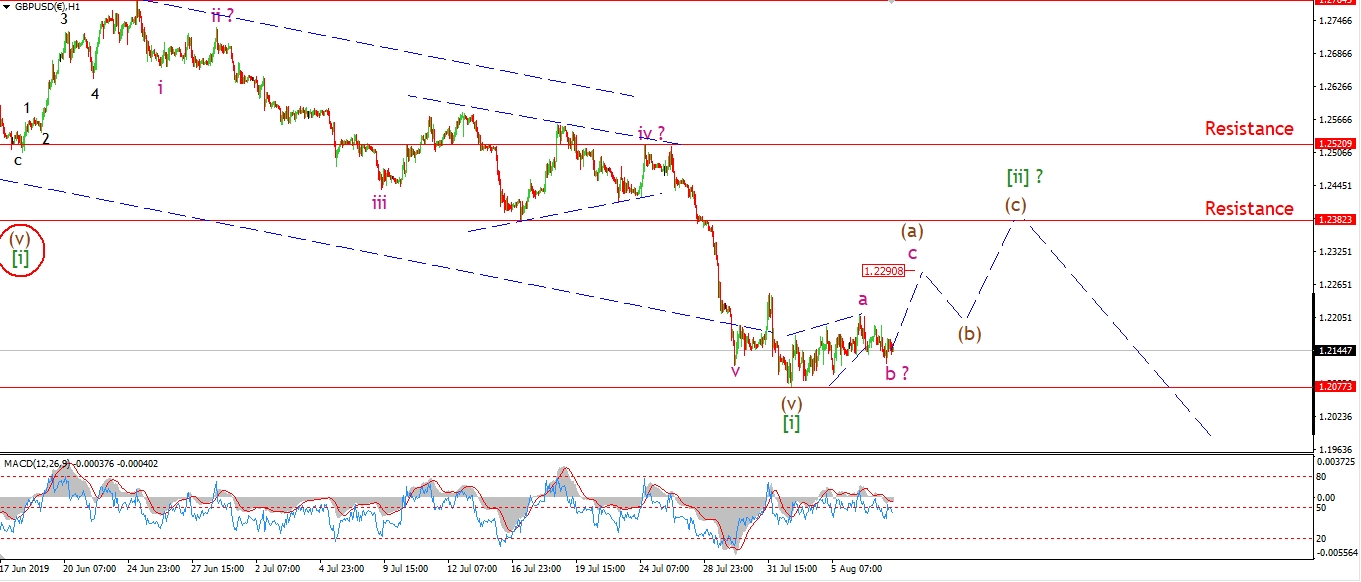 [/vc_column_text][/vc_column][vc_column width=”1/3″][vc_custom_heading text=”4 Hours” use_theme_fonts=”yes”][vc_column_text]
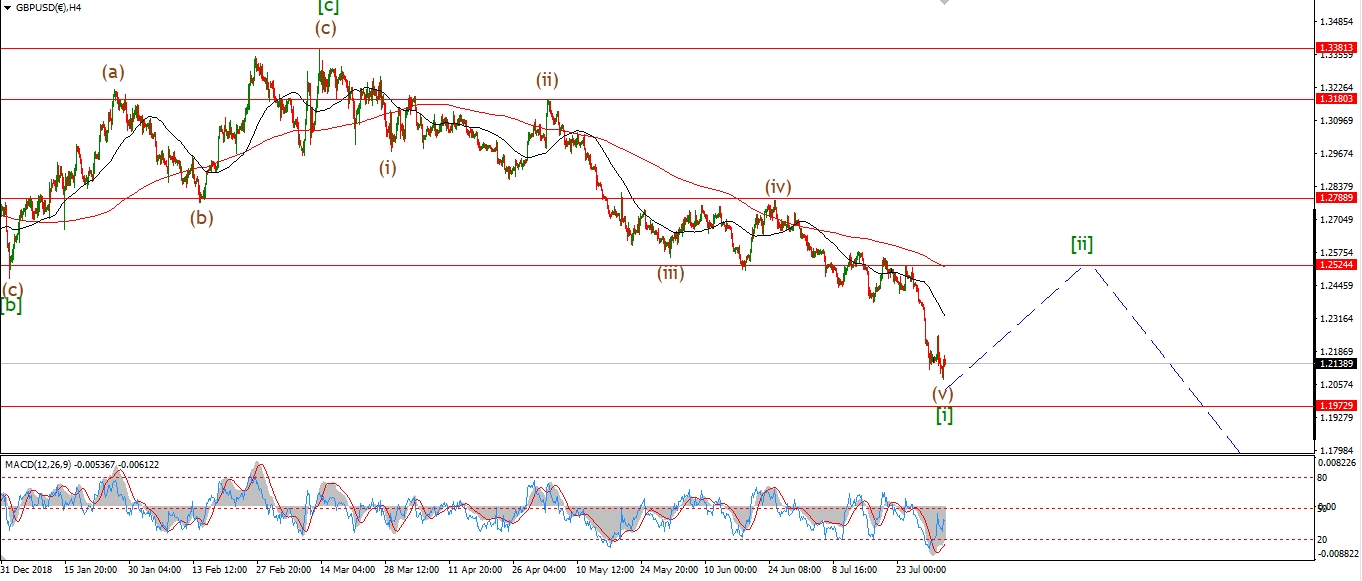 [/vc_column_text][vc_custom_heading text=”Daily” use_theme_fonts=”yes”][vc_column_text]
 [/vc_column_text][/vc_column][/vc_row]
[vc_row][vc_column][vc_column_text]
The trade in cable is horrible corrective at the moment,
so it is hard to discern what pattern is developing in wave [ii] yet.
I have shown a possible wave ‘a’ wedge pattern.
The decline off that wave ‘a’ high is in three waves into todays lows,
so this is viewed as wave ‘b’ right now.
The pattern suggests another rise in wave ‘c’ of (a) tomorrow to about 1.2290 or so.
Wave ‘c’ will likely trace out a three wave patter again if the overall correction is a double or triple combination wave.
It sure looks that complicated at the moment.
Tomorrow;
Watch for 1.2077 to hold again.
And wave ‘c’ of (a) to rally again.
[/vc_column_text][/vc_column][/vc_row]
[vc_row][vc_column][vc_separator border_width=”5″][/vc_column][/vc_row][vc_row][vc_column][vc_column_text]
USDJPY
[/vc_column_text][/vc_column][/vc_row][vc_row][vc_column][vc_separator border_width=”5″][/vc_column][/vc_row][vc_row][vc_column width=”2/3″][vc_custom_heading text=”1 hr” use_theme_fonts=”yes”][vc_column_text]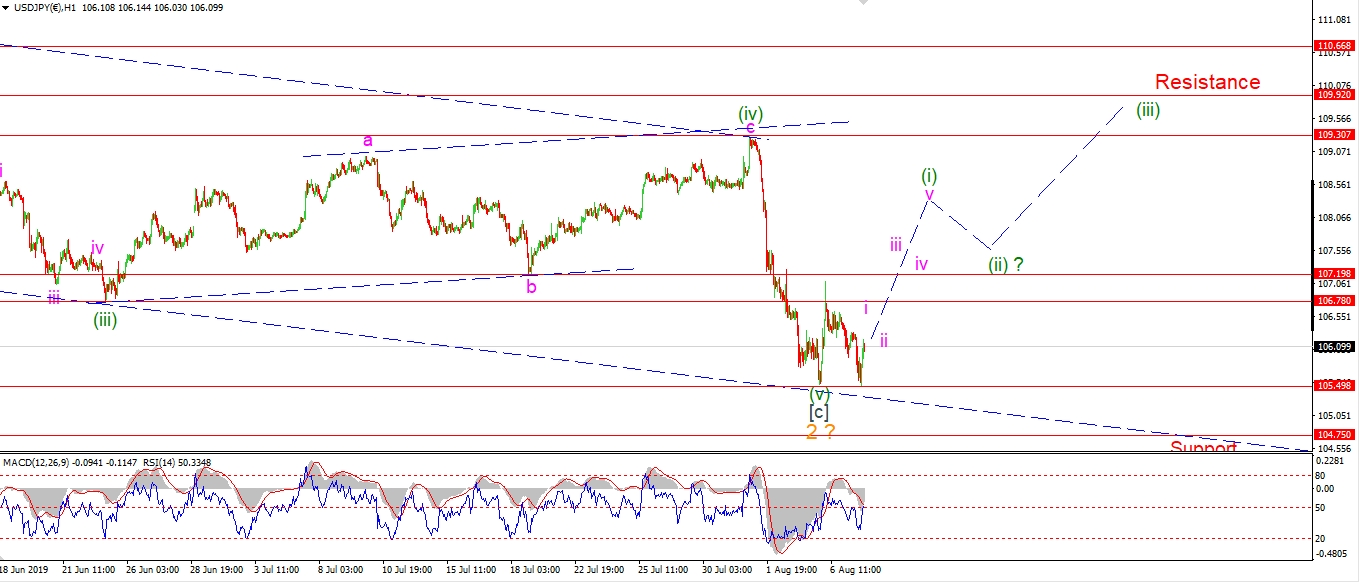 [/vc_column_text][/vc_column][vc_column width=”1/3″][vc_custom_heading text=”4 Hours” use_theme_fonts=”yes”][vc_column_text]
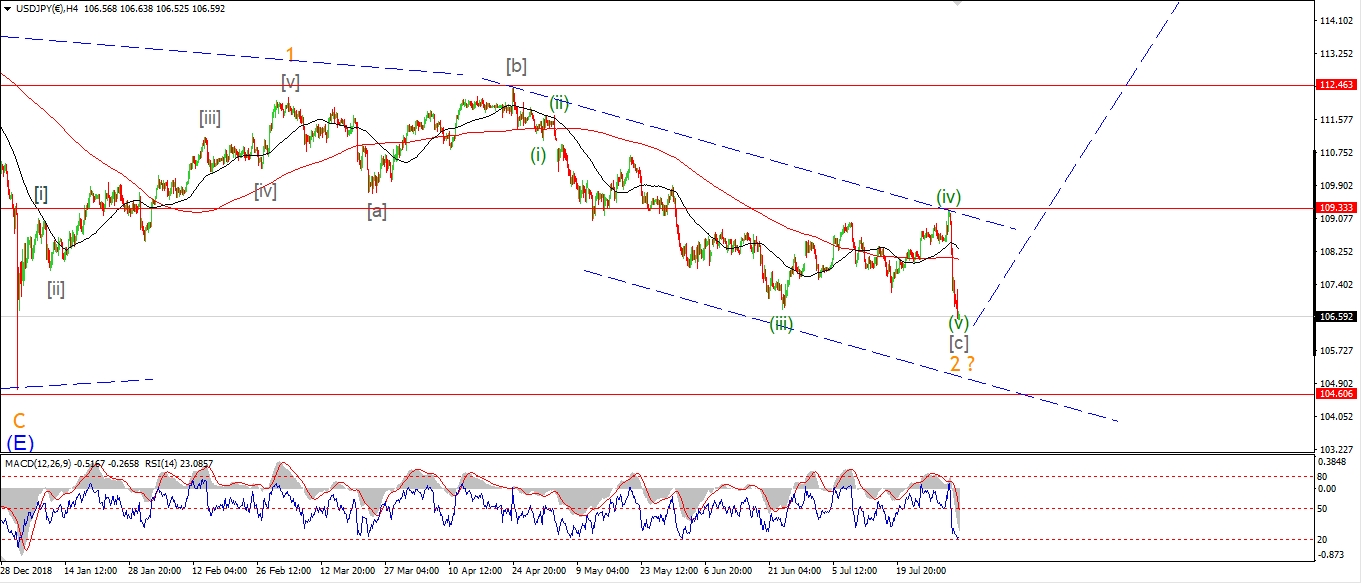 [/vc_column_text][vc_custom_heading text=”Daily” use_theme_fonts=”yes”][vc_column_text]
 [/vc_column_text][/vc_column][/vc_row]
[vc_row][vc_column][vc_column_text]
USDJPY is not playing ball at all these days.
The price is definitely finding some support at the lower trend channel line.
We have seen 2 separate spikes higher off that level over the last few days.
But as yet there is now five wave rally to signal a turn is in.
For the moment I am waiting for the correction price action to develop off these lows.
Tomorrow;
Watch for a five wave move higher to begin overnight.
[/vc_column_text][/vc_column][/vc_row]
[vc_row][vc_column][vc_separator border_width=”5″][/vc_column][/vc_row][vc_row][vc_column][vc_column_text]
DOW JONES INDUSTRIALS
[/vc_column_text][/vc_column][/vc_row][vc_row][vc_column][vc_separator border_width=”5″][/vc_column][/vc_row][vc_row][vc_column width=”2/3″][vc_custom_heading text=”1 hr” use_theme_fonts=”yes”][vc_column_text] [/vc_column_text][/vc_column][vc_column width=”1/3″][vc_custom_heading text=”4 Hours” use_theme_fonts=”yes”][vc_column_text]
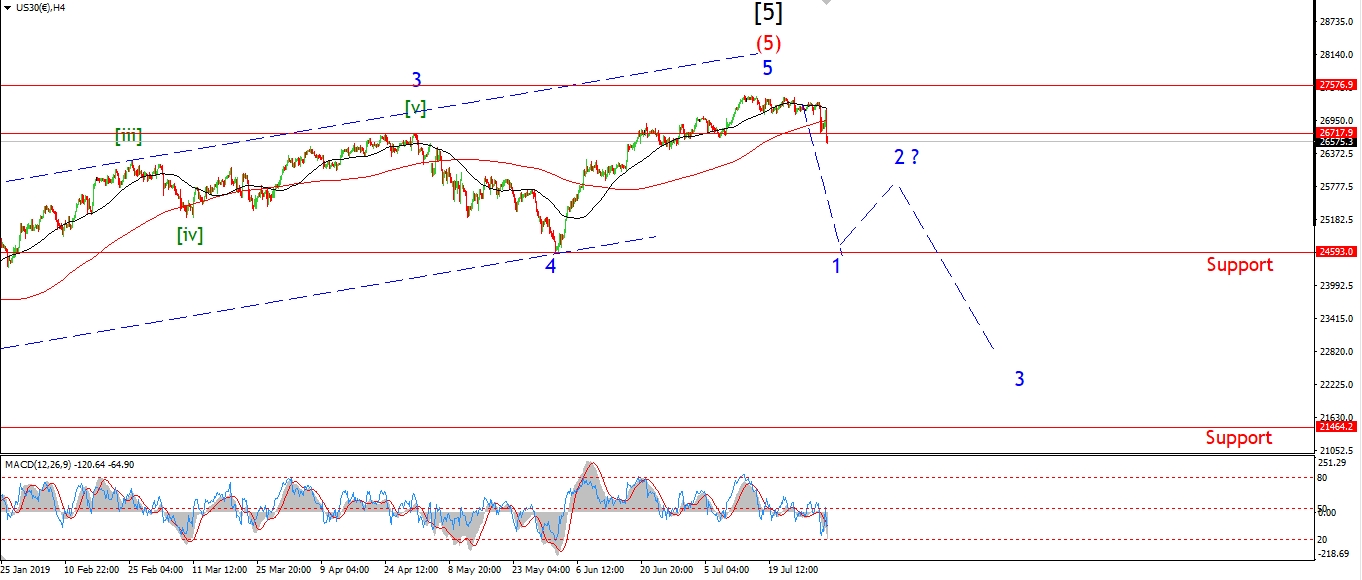 [/vc_column_text][vc_custom_heading text=”Daily” use_theme_fonts=”yes”][vc_column_text]
 [/vc_column_text][/vc_column][/vc_row]
[vc_row][vc_column][vc_column_text]
The market continue to push higher this evening after an early selloff.
The price pattern that is developing is starting to lean towards the alternate count,
but I see no real reason to change right now.
Both counts called for this corrective rally to happen.
And both counts call for further weakness to begin once this correction is over.
So we are on track now either way.
This evenings rally is viewed as wave ‘c’ of (iv),
or wave (c) of [ii] depending on which count we use.
So this is a terminal rally within a correction.
We should see a selloff begin by Friday in wave (v) as shown.
Tomorrow;
Watch for wave ‘c’ to complete in the area of 26300.
A decline back below 25500 again will signal that wave (v) has begun.
[/vc_column_text][/vc_column][/vc_row]
[vc_row][vc_column][vc_separator border_width=”5″][/vc_column][/vc_row][vc_row][vc_column][vc_column_text]
GOLD
[/vc_column_text][/vc_column][/vc_row][vc_row][vc_column][vc_separator border_width=”5″][/vc_column][/vc_row][vc_row][vc_column width=”2/3″][vc_custom_heading text=”1 hr” use_theme_fonts=”yes”][vc_column_text]
 [/vc_column_text][/vc_column][vc_column width=”1/3″][vc_custom_heading text=”4 Hours” use_theme_fonts=”yes”][vc_column_text]
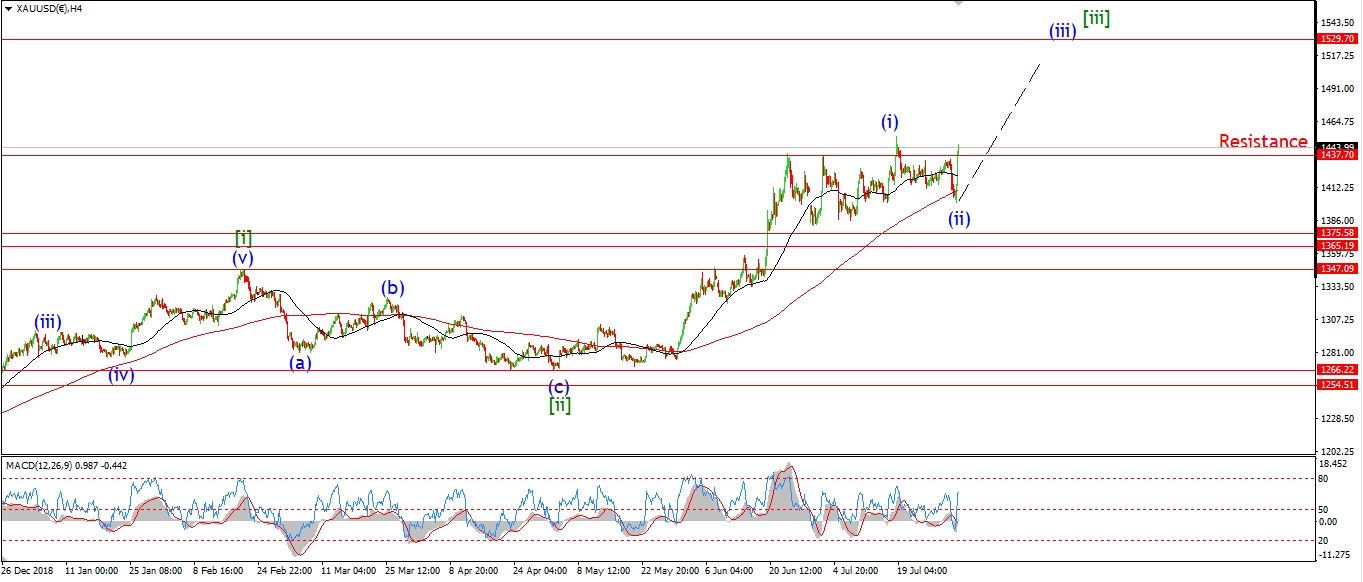 [/vc_column_text][vc_custom_heading text=”Daily” use_theme_fonts=”yes”][vc_column_text]
 [/vc_column_text][/vc_column][/vc_row]
[vc_row][vc_column][vc_column_text]
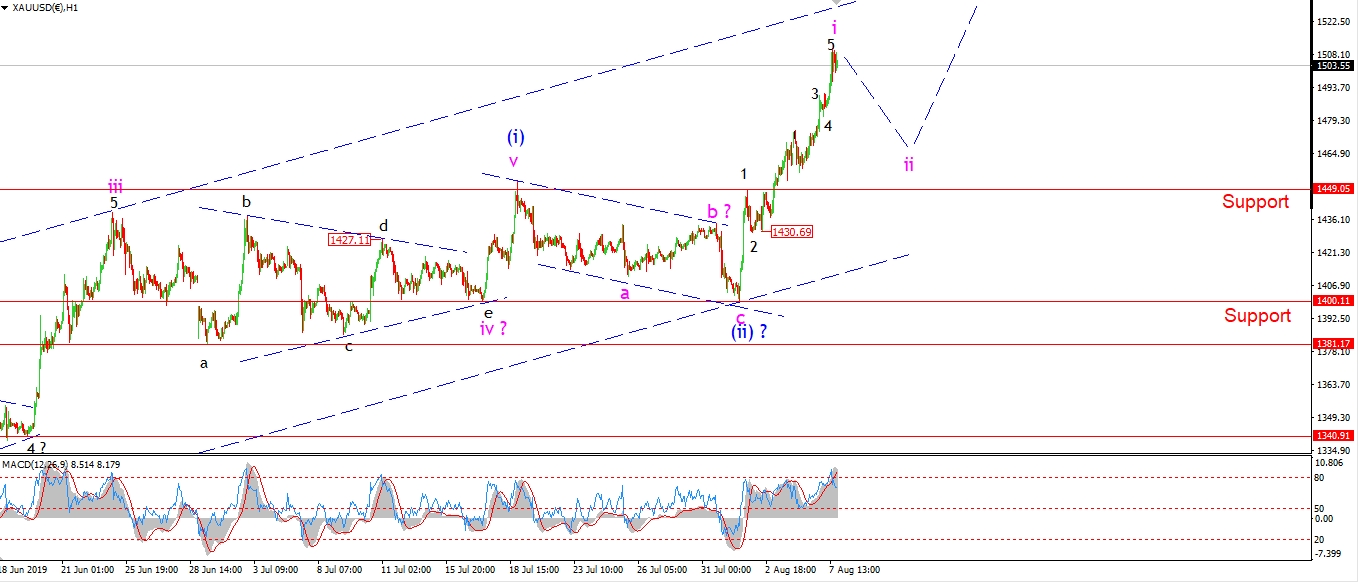
Gold put is a strong day today to complete wave ‘i’ of (iii).
The price is now back above 1500 again for the first time in 6 years!
If the larger daily wave count is correct,
then this rally should continue in wave ‘3’ red for the rest of the year.
We have reached an extreme overbought level on the short term charts now.
And the price is close to hitting the upper trend channel line again.
So I think it is time for a correction again.
Possibly in wave ‘ii’ of (iii).
Tomorrow;
Watch for wave ‘ii’ to begin off the current highs.
This should be a three wave decline and should complete above 1400 again.
But we should find support at 1450.
[/vc_column_text][/vc_column][/vc_row]
[vc_row][vc_column][vc_separator border_width=”5″][/vc_column][/vc_row][vc_row][vc_column][vc_column_text]
U.S CRUDE OIL
[/vc_column_text][/vc_column][/vc_row][vc_row][vc_column][vc_separator border_width=”5″][/vc_column][/vc_row][vc_row][vc_column width=”2/3″][vc_custom_heading text=”1 hr” use_theme_fonts=”yes”][vc_column_text]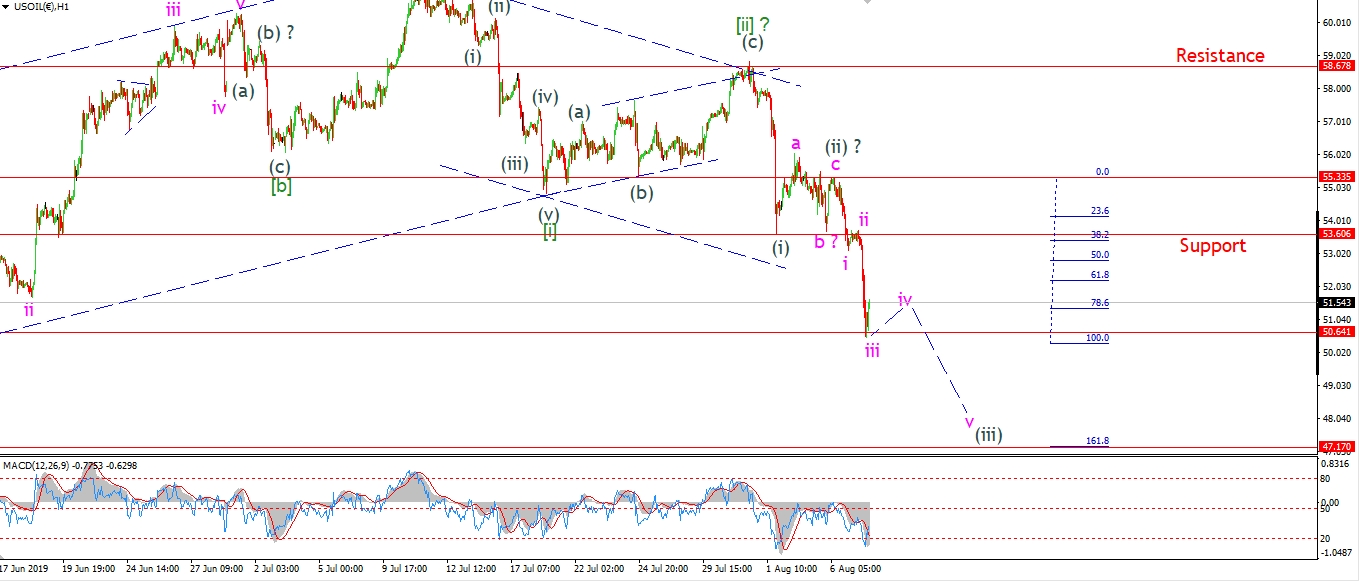 [/vc_column_text][/vc_column][vc_column width=”1/3″][vc_custom_heading text=”4 Hours” use_theme_fonts=”yes”][vc_column_text]
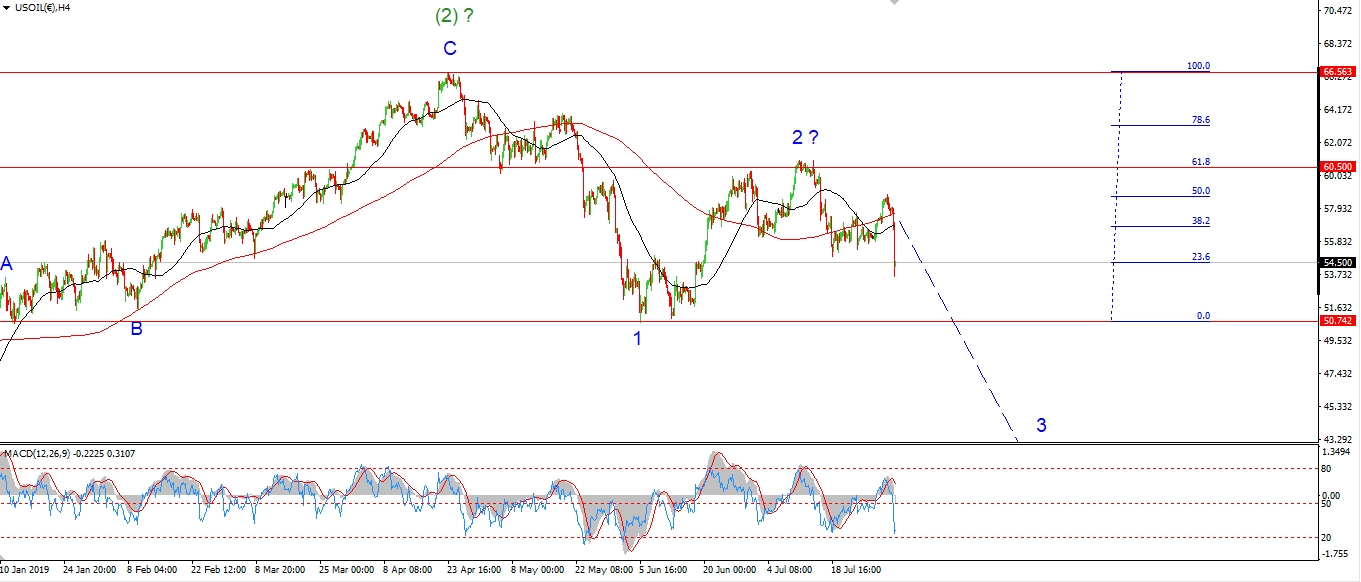 [/vc_column_text][vc_custom_heading text=”Daily” use_theme_fonts=”yes”][vc_column_text]
 [/vc_column_text][/vc_column][/vc_row]
[vc_row][vc_column][vc_column_text]
The correction in wave (ii) did not complete as I expected.
The price rose overnight but did not reach above the previous wave ‘a’.
The pattern in wave (ii) seems to be a running flat.
Todays selloff is labelled as wave (iii) down.
And this should continue lower towards the 47.00 area as shown.
this is where wave (iii) will reach 162% of wave (i).
Tomorrow;
Price should now hold below the wave (i) low at 53.60.
Wave ‘iv’ of (iii) is set to correct sideways soon
and then wave ‘v’ will decline again towards the target.
[/vc_column_text][/vc_column][/vc_row]
[vc_row][vc_column][vc_separator border_width=”5″][/vc_column][/vc_row][vc_row][vc_column][vc_column_text]
US 10 yr Treasuries.
[/vc_column_text][/vc_column][/vc_row][vc_row][vc_column][vc_separator border_width=”5″][/vc_column][/vc_row][vc_row][vc_column width=”2/3″][vc_custom_heading text=”1 hr” use_theme_fonts=”yes”][vc_column_text] [/vc_column_text][/vc_column][vc_column width=”1/3″][vc_custom_heading text=”4 Hours” use_theme_fonts=”yes”][vc_column_text]
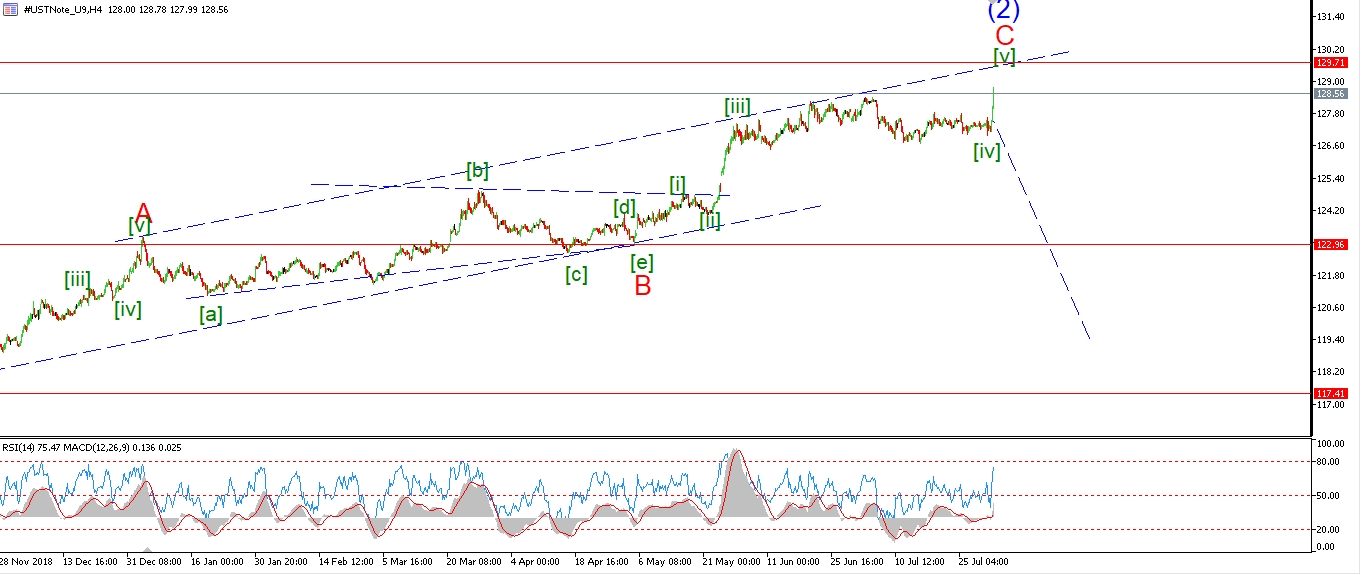 [/vc_column_text][vc_custom_heading text=”Daily” use_theme_fonts=”yes”][vc_column_text]
 [/vc_column_text][/vc_column][/vc_row]
[vc_row][vc_column][vc_column_text]
Bonds did push out to a new high this morning in an extended wave (v) of [v].
but those gains have evaporated again this evening,
as we move lower into a possible five wave down scenario to end this wave (3) rally.
If the top is in,
then we should see a five wave move lower develop over the coming weeks.
Wave (i) down should complete by the end of trading on Friday all going well.
Tomorrow;
Watch for wave (i) of [i] to continue lower and hit 129.00 again beofe wave (ii) begins.
[/vc_column_text][/vc_column][/vc_row]
[vc_row][vc_column][vc_separator border_width=”5″][/vc_column][/vc_row][vc_row][vc_column][vc_column_text]
SILVER
[/vc_column_text][/vc_column][/vc_row][vc_row][vc_column][vc_separator border_width=”5″][/vc_column][/vc_row][vc_row][vc_column width=”2/3″][vc_custom_heading text=”1 hr” use_theme_fonts=”yes”][vc_column_text]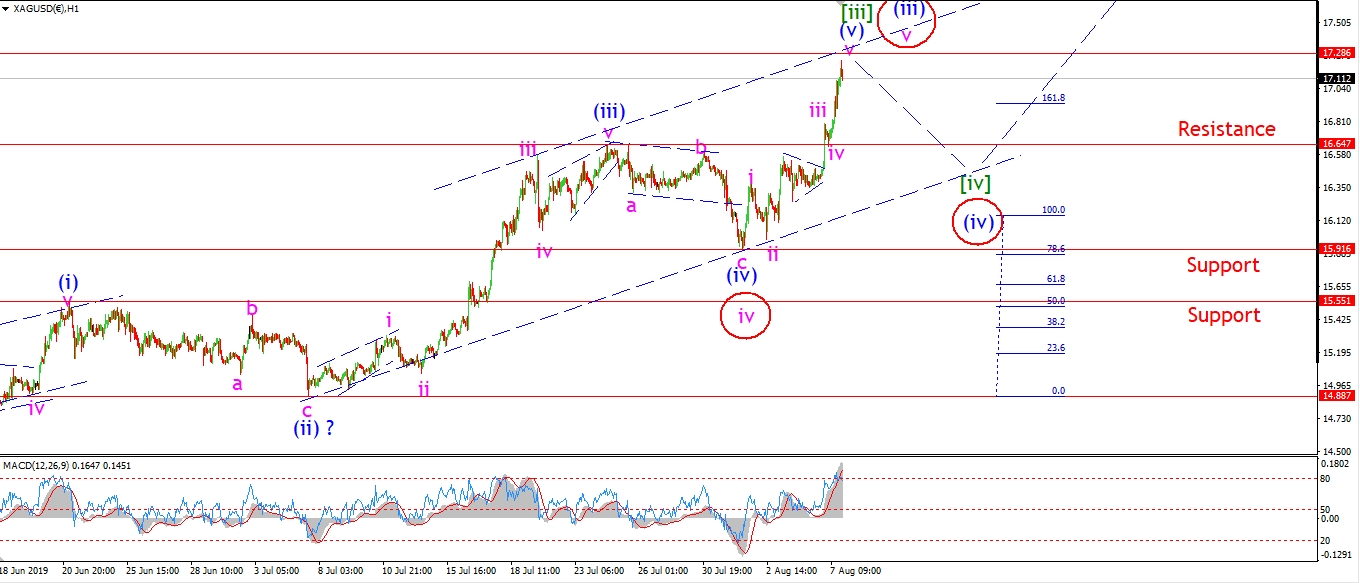 [/vc_column_text][/vc_column][vc_column width=”1/3″][vc_custom_heading text=”4 Hours” use_theme_fonts=”yes”][vc_column_text]
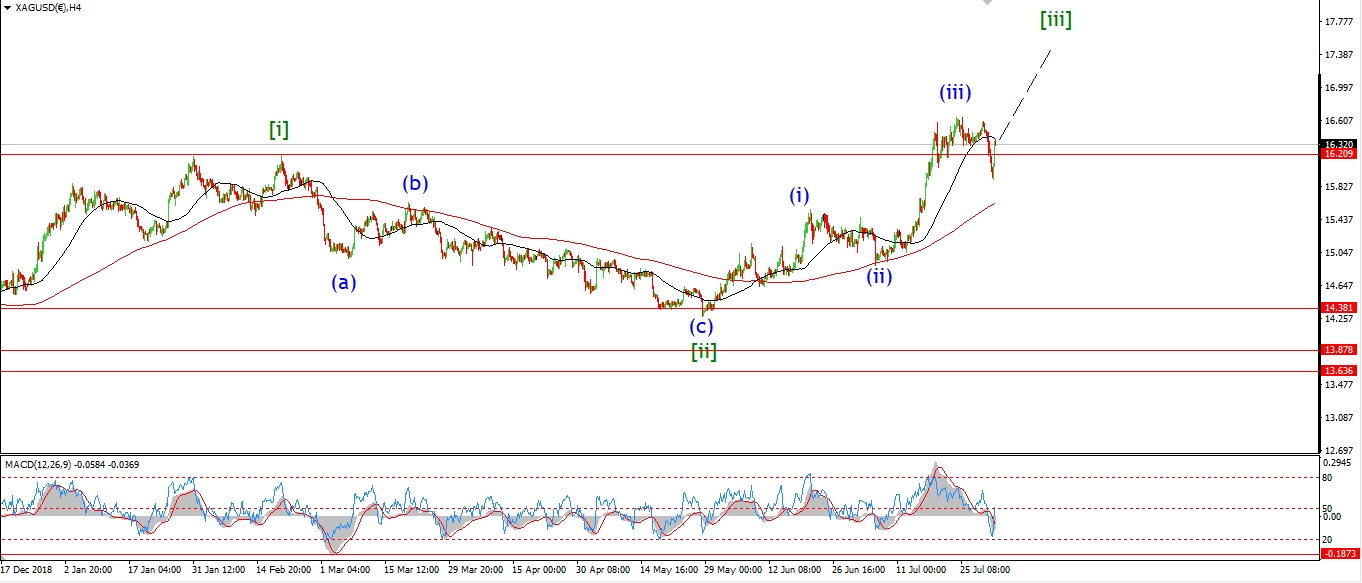 [/vc_column_text][vc_custom_heading text=”Daily” use_theme_fonts=”yes”][vc_column_text]
 [/vc_column_text][/vc_column][/vc_row]
[vc_row][vc_column][vc_column_text]
Silver rallied out of the triangle overnight and continued higher today.
As with gold,
I think we have now exhausted this particular rally in wave (v) of [iii].
And it is time to correction lower again in wave [iv] green.
the alternate count still stands also,
And I may even switch to this count soon if depending on the correction that is coming.
The alternate count calls for a decline in wave (iv) blue at one lower degree than the main count.
Either way,
I think we are due another cool off period soon.
Tomorrow;
Watch for wave [iii] to top out soon.
A drop below 16.64 again will signal that wave [iv] has begun.
[/vc_column_text][/vc_column][/vc_row]
[vc_row][vc_column][vc_separator border_width=”5″][/vc_column][/vc_row][vc_row][vc_column][vc_column_text]
S&P 500.
[/vc_column_text][/vc_column][/vc_row][vc_row][vc_column][vc_separator border_width=”5″][/vc_column][/vc_row][vc_row][vc_column width=”2/3″][vc_custom_heading text=”1 hr” use_theme_fonts=”yes”][vc_column_text]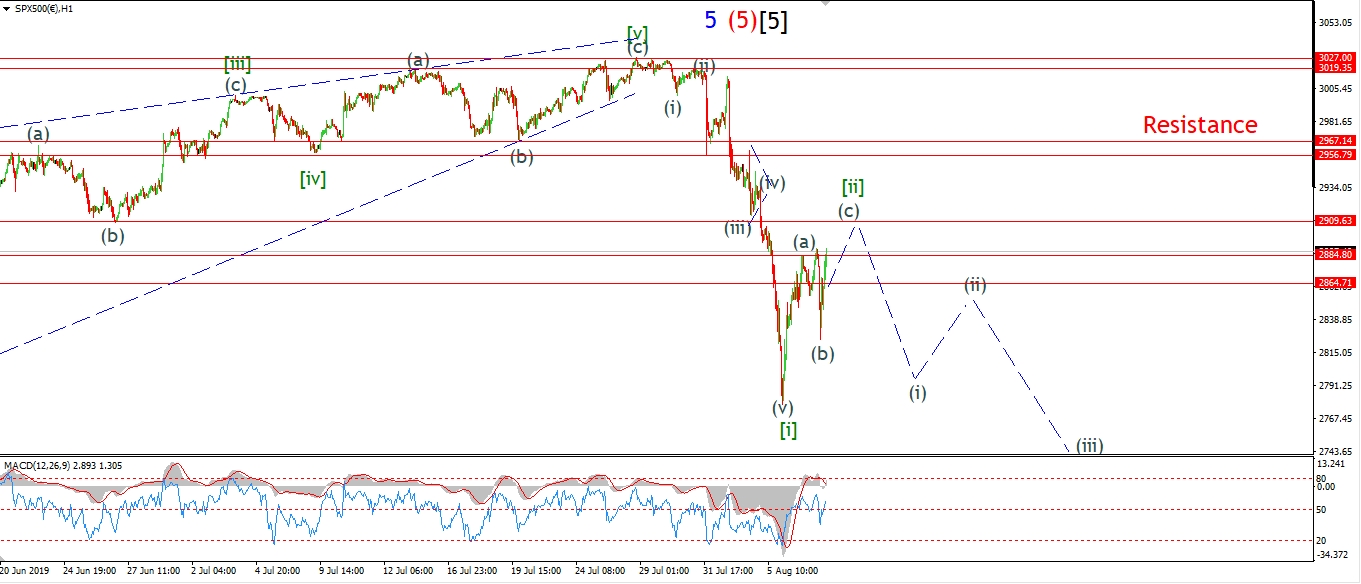 [/vc_column_text][/vc_column][vc_column width=”1/3″][vc_custom_heading text=”4 Hours” use_theme_fonts=”yes”][vc_column_text]
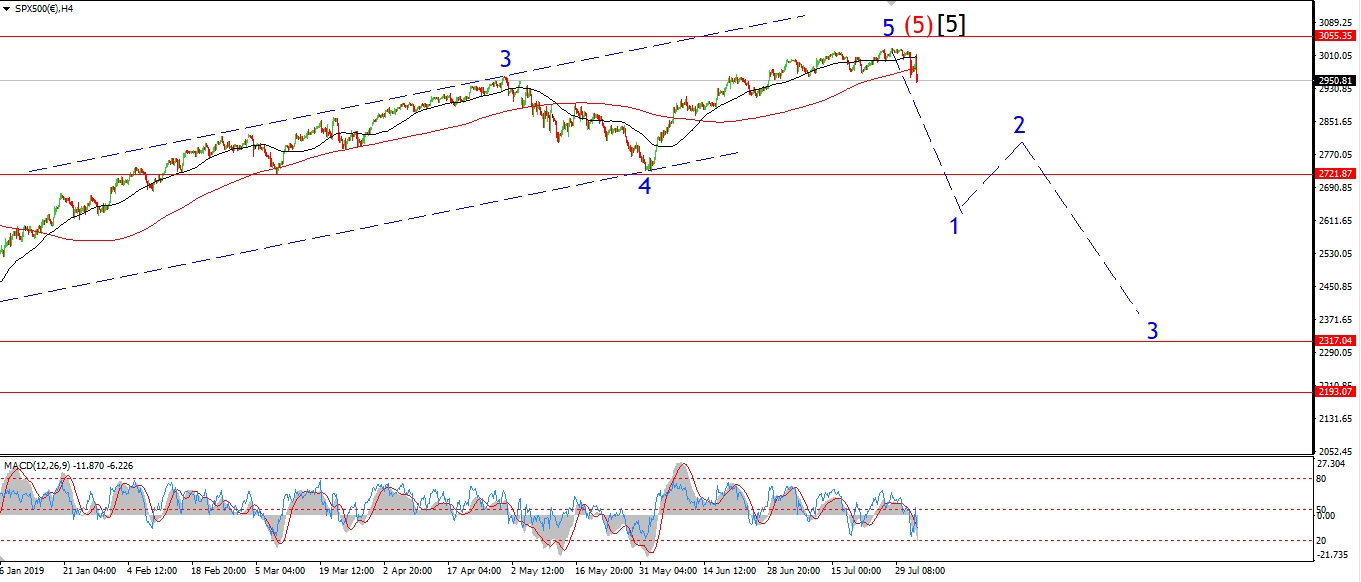 [/vc_column_text][vc_custom_heading text=”Daily” use_theme_fonts=”yes”][vc_column_text]
 [/vc_column_text][/vc_column][/vc_row]
[vc_row][vc_column][vc_column_text]
The S&P corrected in a three wave expanded flat pattern in wave (b) into todays lows.
The market has bounced again this evening,
And this is labelled as wave (c) of [ii].
The market should break clear above the wave (a) high at 2885 before completing.
Although prices did hit that level this hour,
the pattern looks incomplete just yet.
I would expect wave (c) to hit above 2900 to complete tomorrow;
Tomorrow;
This week is going to plan so far.
The market is rallying in three waves to a corrective lower high in wave [ii].
When wave [ii] completes,
we will be in serious danger of crashing lower in wave [iii] next week.
Watch for wave (c) of [ii] to hit 2900 before turning lower into wave [iii] again.
[/vc_column_text][/vc_column][/vc_row]
[vc_row][vc_column][vc_separator border_width=”5″][/vc_column][/vc_row]