
Hello again,
and good evening to you all.
Its been a a few days and I hope you are all well and happy!
Back into it again thanks be to God, so here we go!
EURUSD.
EURUSD 1hr.
EURUSD 4hr.
EURUSD daily.
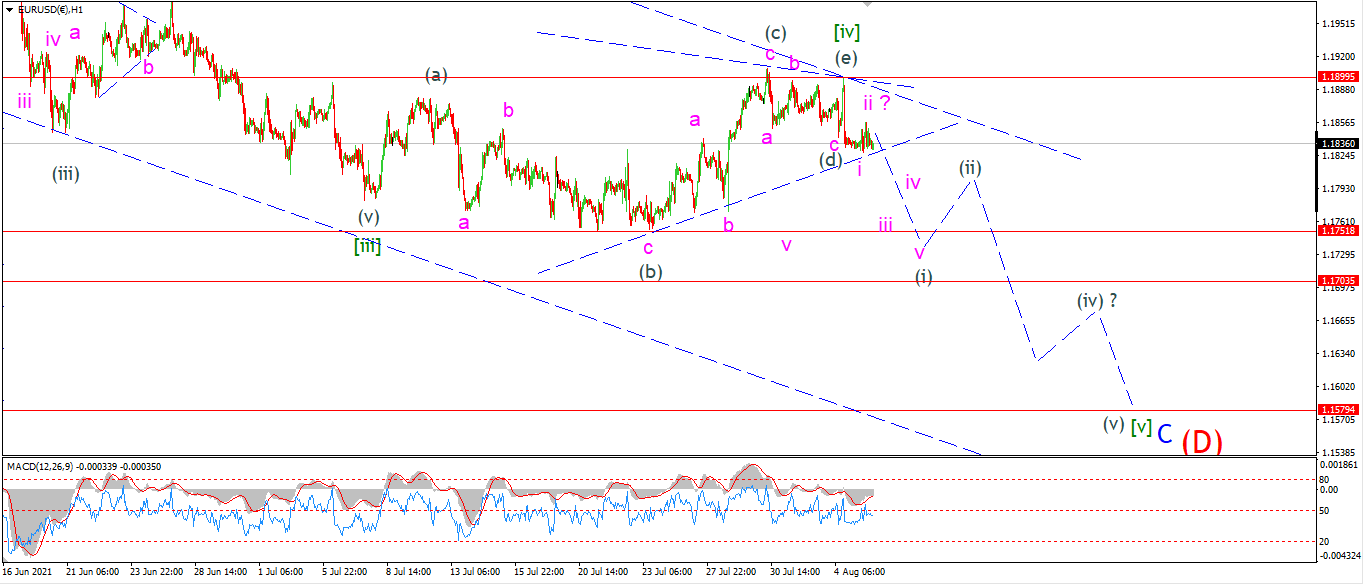
This weeks action has opened up the possibility for a triangle wave [iv] green complete at 1.1899.
The spike lower off that high is now viewed as wave ‘i’ of (i) of [v].
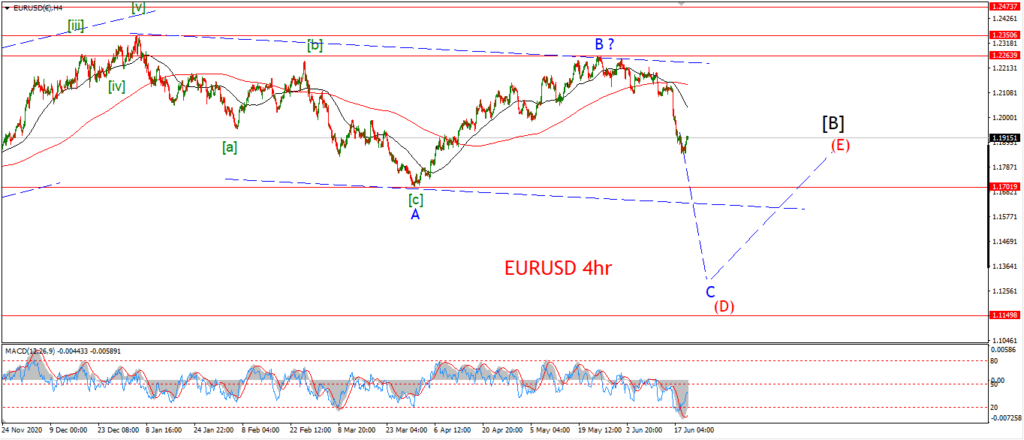
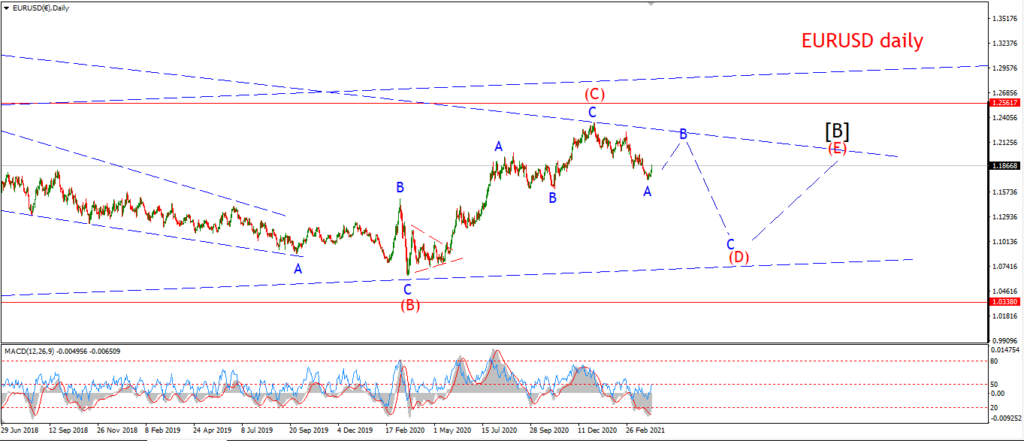
This count calls for more downside over the next week as a five wave pattern develops in wave [v].
Tomorrow;
The wave [iv] high at 1.1899 must hold for this triangle pattern to remain valid.
Watch for wave (i) of [v] to continue lower tomorrow and break 1.1750 again to confirm that wave [v] has begun.
GBPUSD
GBPUSD 1hr.
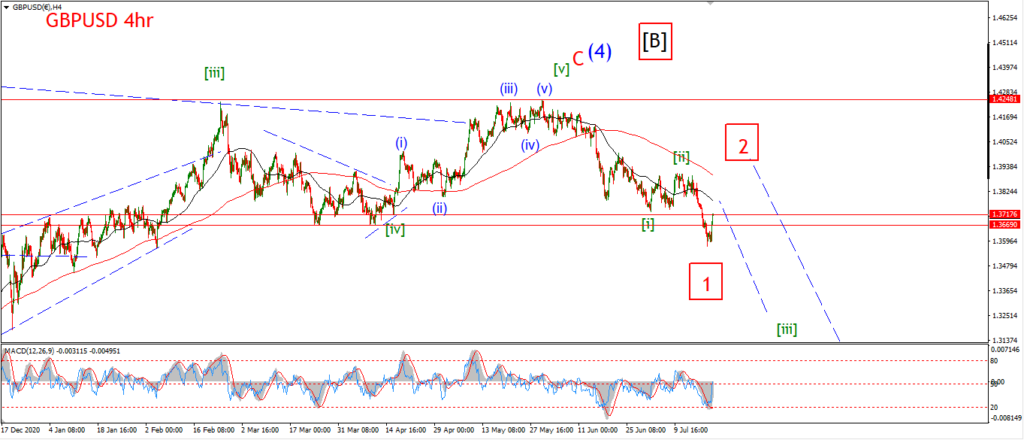
GBPUSD 4hr.
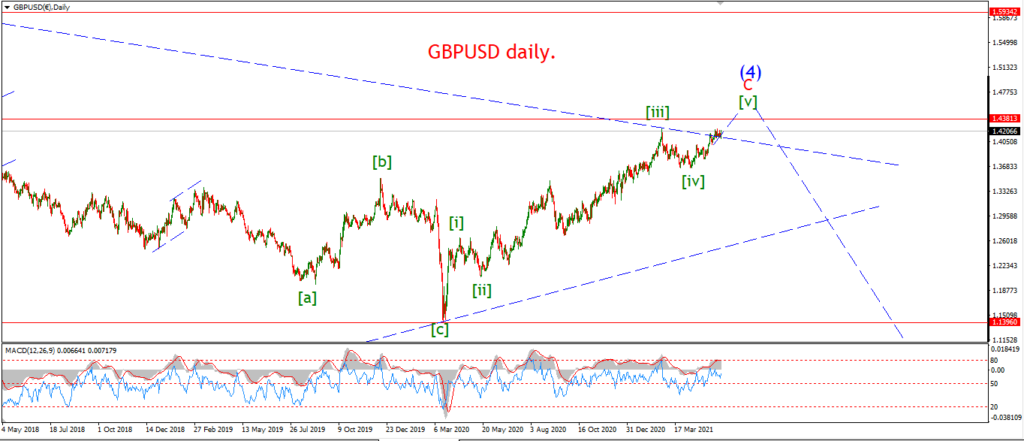
GBPUSD daily.
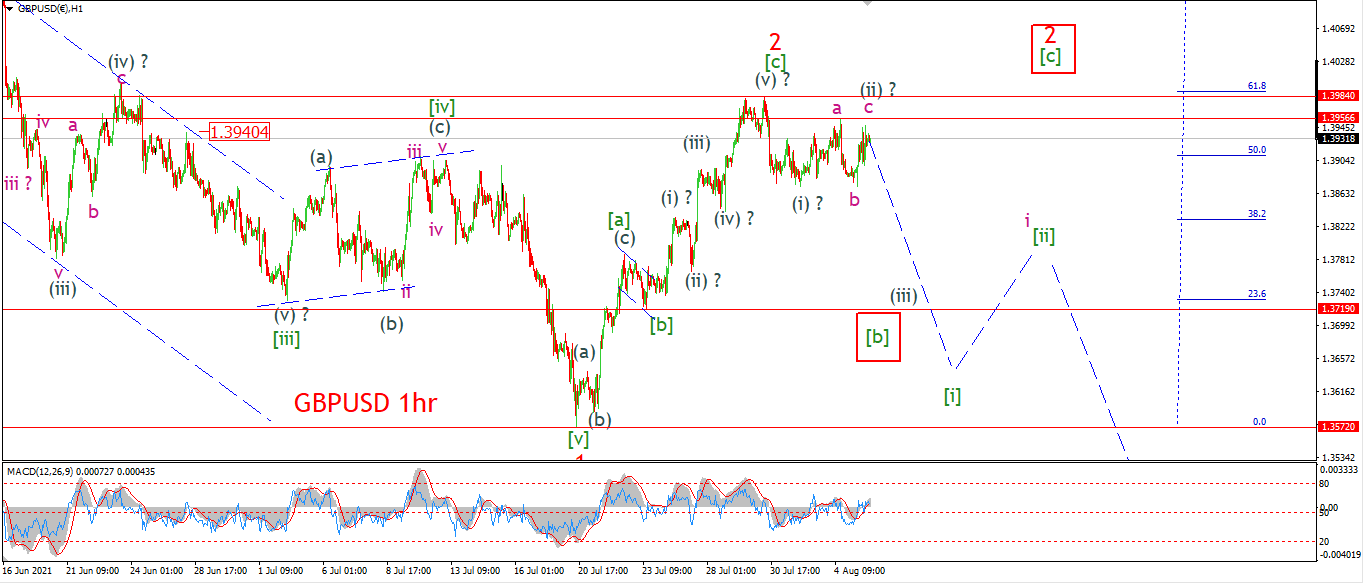
Nothing has happened in Cable over the last few days to warrant any change of the outlook.
The price has basically drifted sideways below last Fridays high.
The initial drop off the high can be viewed as impulsive to the downside,
in that case we have a (i) (ii) pattern in play here.
This requires another drop into wave (iii) over the coming days.
The main alternate count here involves a three wave decline into wave [b],
followed by another rally in wave [c] to complete a larger wave ‘2’ as shown.
Tomorrow;
Watch for wave (ii) to hold below 1.3984.
Wave (iii) down should continue lower towards 1.37.
USDJPY.
USDJPY 1hr.
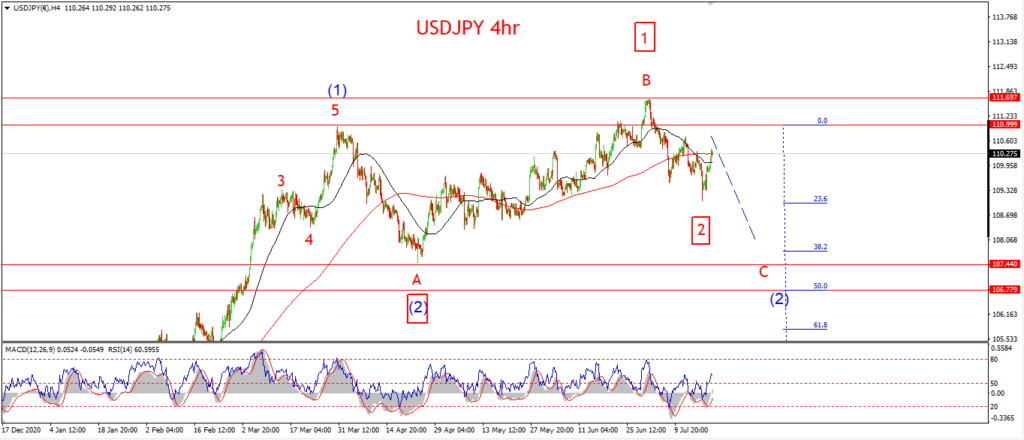
USDJPY 4hr.
USDJPY daily.
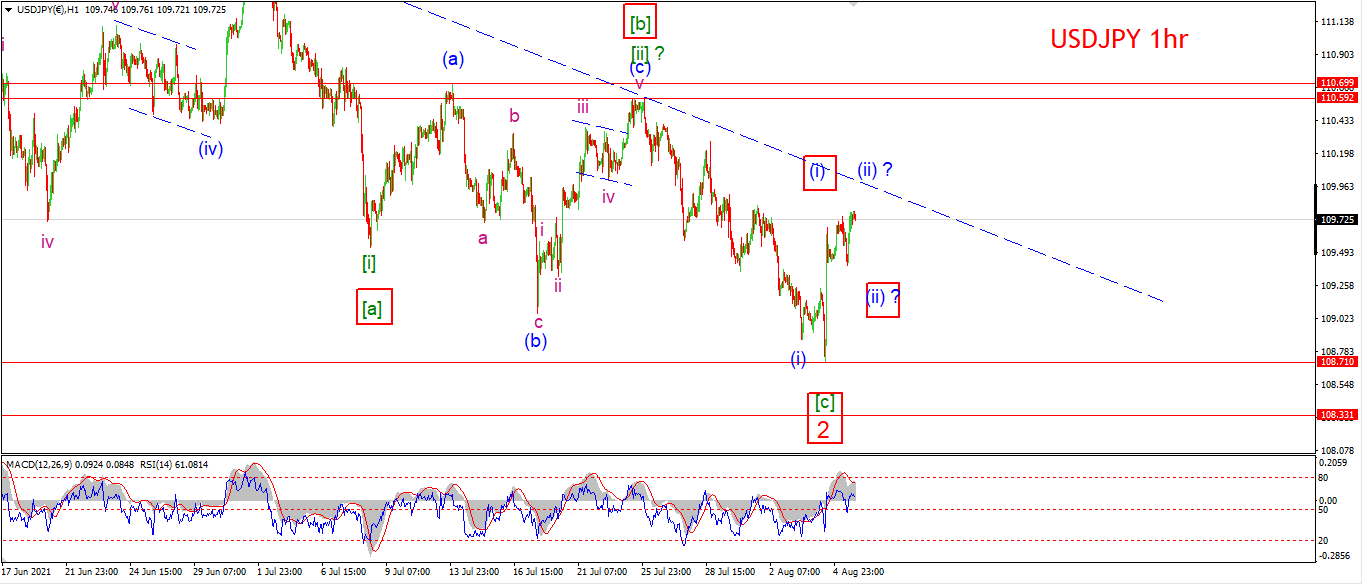
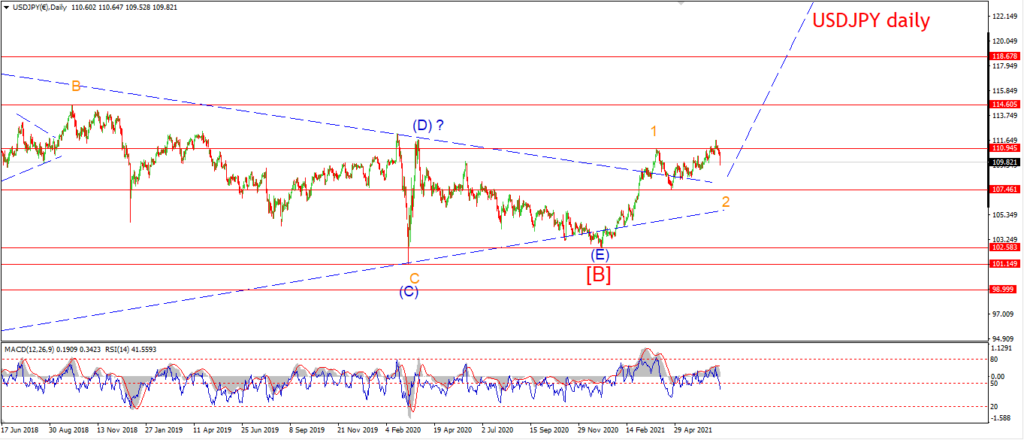
I have fleshed out the alternate count this evening and that is what I will be commenting on.
The price has spiked higher this week off a low at 108.71.
This action does increase the probability of that alternate count somewhat.
So,
If we view the recent high at 111.66 as wave ‘1’ red.
then wave ‘2’ completed a three wave decline this week at 108.71.
The impulsive nature of the rally off that level can be viewed as a (i) of [i] of ‘3’ to the upside.
If that count is correct,
then we are at the beginning of a long run higher in USDJPY.
AS for the main count – I cannot rule it out just yet.
Tomorrow;
Watch for a corrective lower high to form in wave (ii) of [iii] and then a return lower into wave (iii) of [iii] should begin.
110.59 is the critical high here,
if that level breaks then I will have to switch to the bullish alternate count.
DOW JONES.
DOW 1hr.
DOW 4hr
DOW daily.
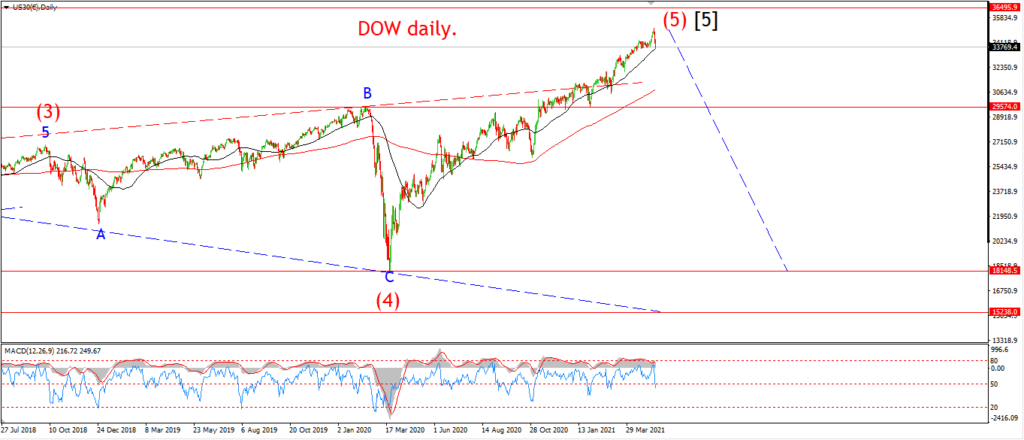
The DOW has achieved exactly nothing this week also,
apart from drawing out the wave ‘iv’ correction into the realms of the nauseating now.
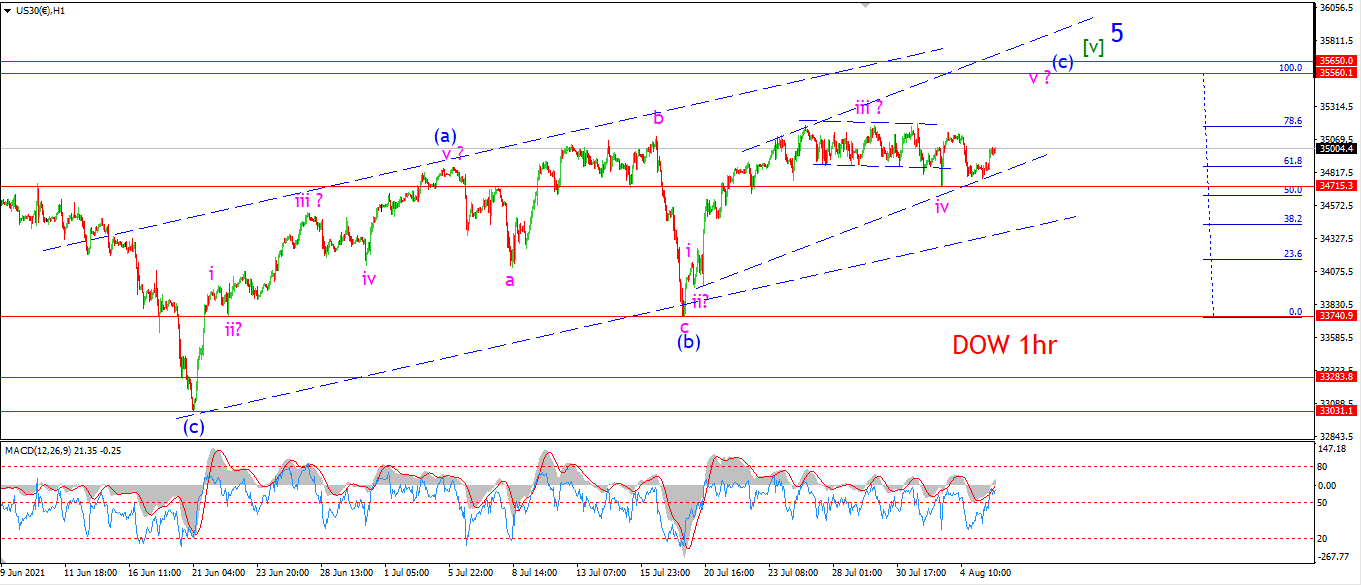
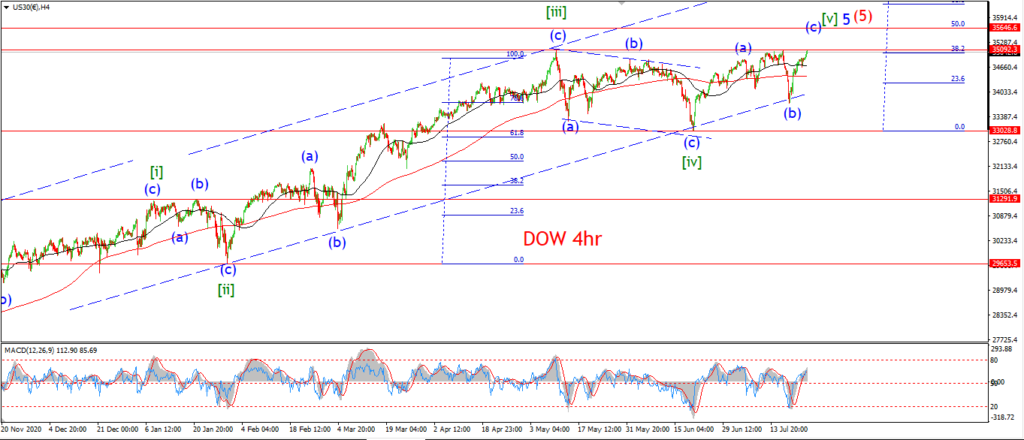
In terms of the wave (c) count that I am working on here,
I am expecting a five wave rally into that final target high at 35560.
This should be followed by an impulsive decline to begin the turn.
So if wave ‘iv’ of (c) is in,
then wave ‘v’ of (c) must be underway with the small higher low that formed this morning.
Wave ‘v’ itself should trace out a five wave rally from here to hit that target area.
If we see a large impulsive decline before hitting that target area,
especially if we see a break of 33740 again,
then I will just accept that wave (c) ran out of steam and the bear market will have a chance to begin again.
Tomorrow;
Watch for wave ‘iv’ to hold at 34715.
Wave ‘v’ of (c) of [c] should set a new all time high before the end of the session.
GOLD
GOLD 1hr.
GOLD 4hr.
GOLD daily.
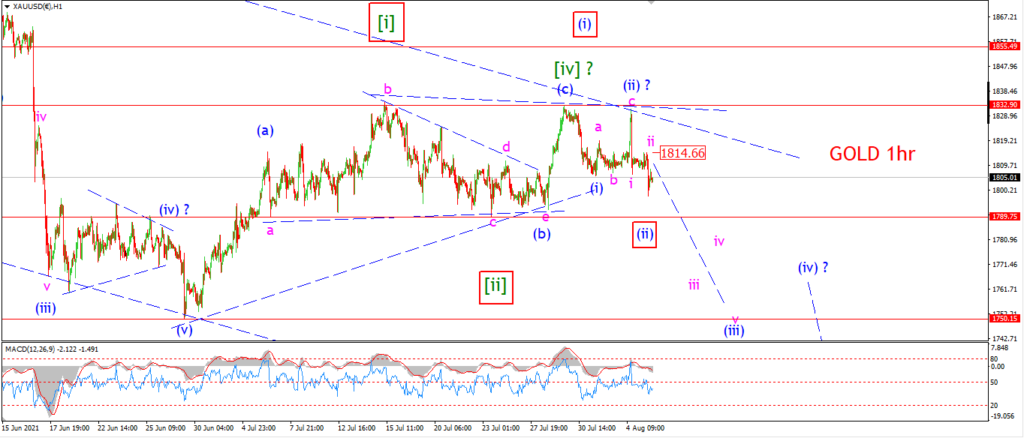
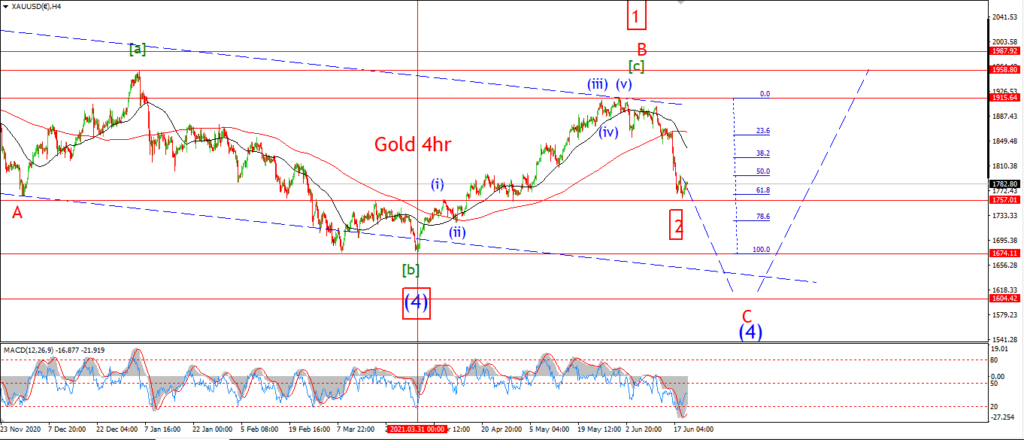
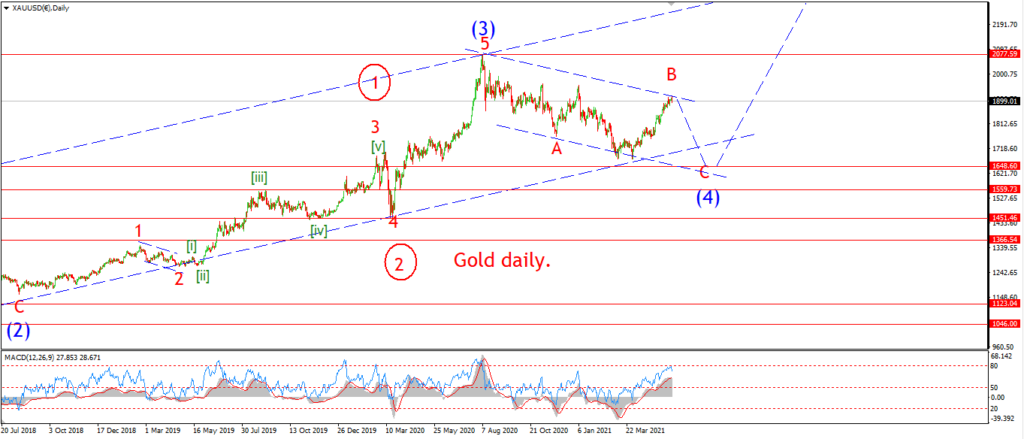
It is possible wave [iv] did complete that triangle I spoke about at 1832 last week.
Since that high we have a series of 1,2 declines building.
and todays move could be a decline into wave (iii) now underway.
If wave ‘i’ and ‘ii’ of (iii) is underway,
then we should see todays high hold at 1814,
and wave ‘iii’ of (iii) of [v] should fall back into 1750 again quite quickly.
Tomorrow;
Watch for wave ‘iii’ of break 1789 again to signal the bearish count is underway.
Although this count will not be validated until we see a break of that 1750 low.
CRUDE OIL.
CRUDE OIL 1hr.
CRUDE OIL 4hr.
CRUDE OIL daily.
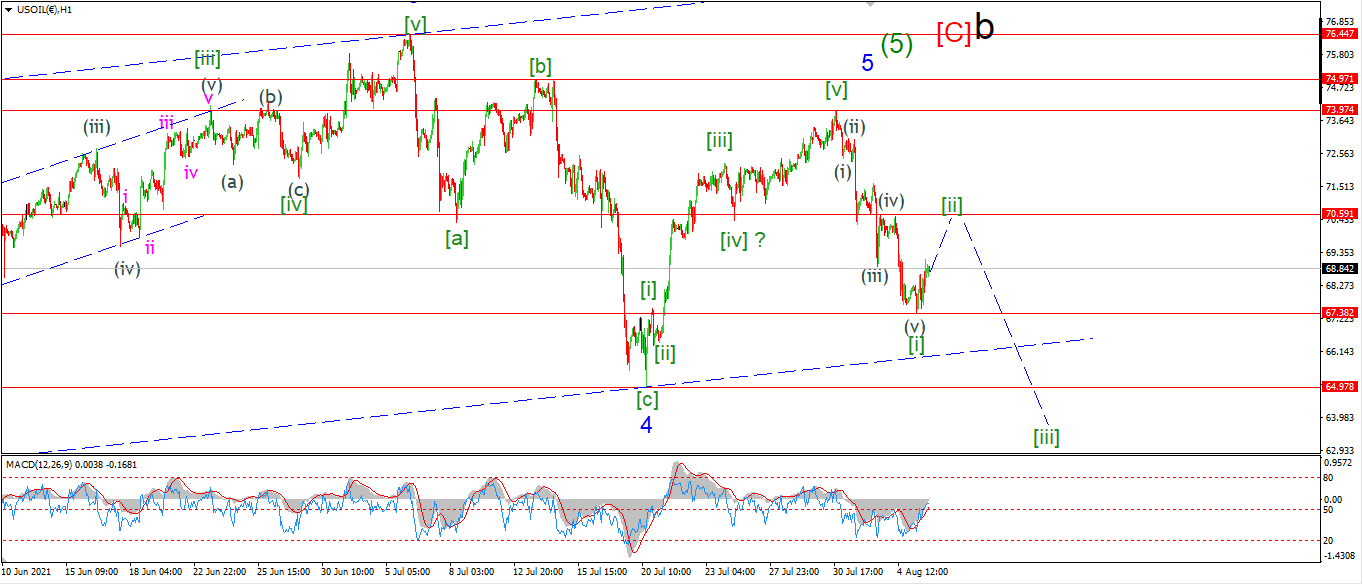
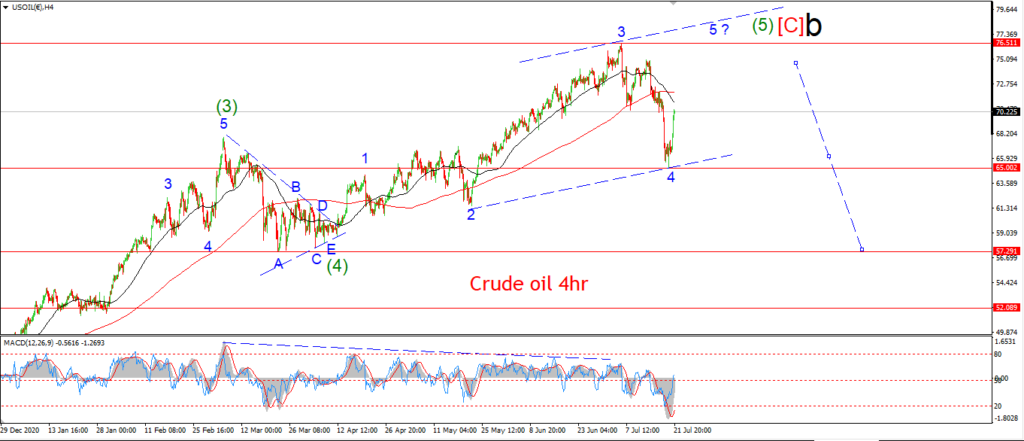
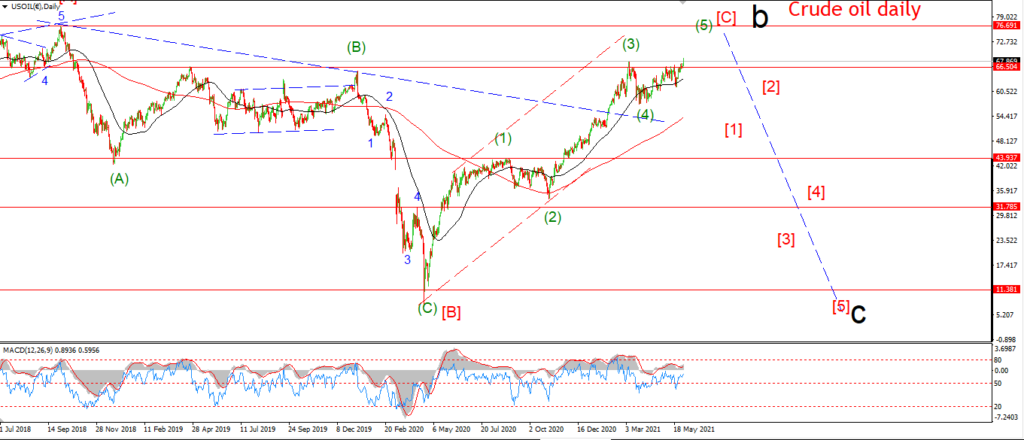
Do we have a failed fifth wave in play for crude oil??
It certainly seems possible given this weeks action.
While last weeks high did not break above the 76.44 high of wave ‘3’,
then pattern into last weeks high did complete five waves up.
And now,
the low of the week so far printed a 67.38 after a possible five wave decline labelled wave [i] green.
While this pattern is not ideal for sure,
it is definitely lining up as a real possibility here.
Tomorrow;
A clear corrective lower high in wave [ii] green tomorrow will add weight to this idea.
Watch for wave [ii] to complete near the previous fourth wave high at 70.60.
S&P 500.
S&P 500 1hr
S&P 500 4hr
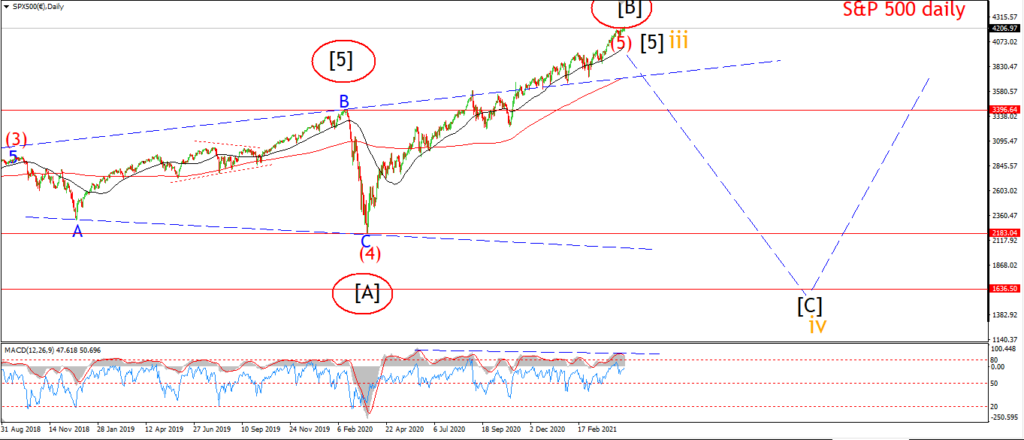
S&P 500 daily.
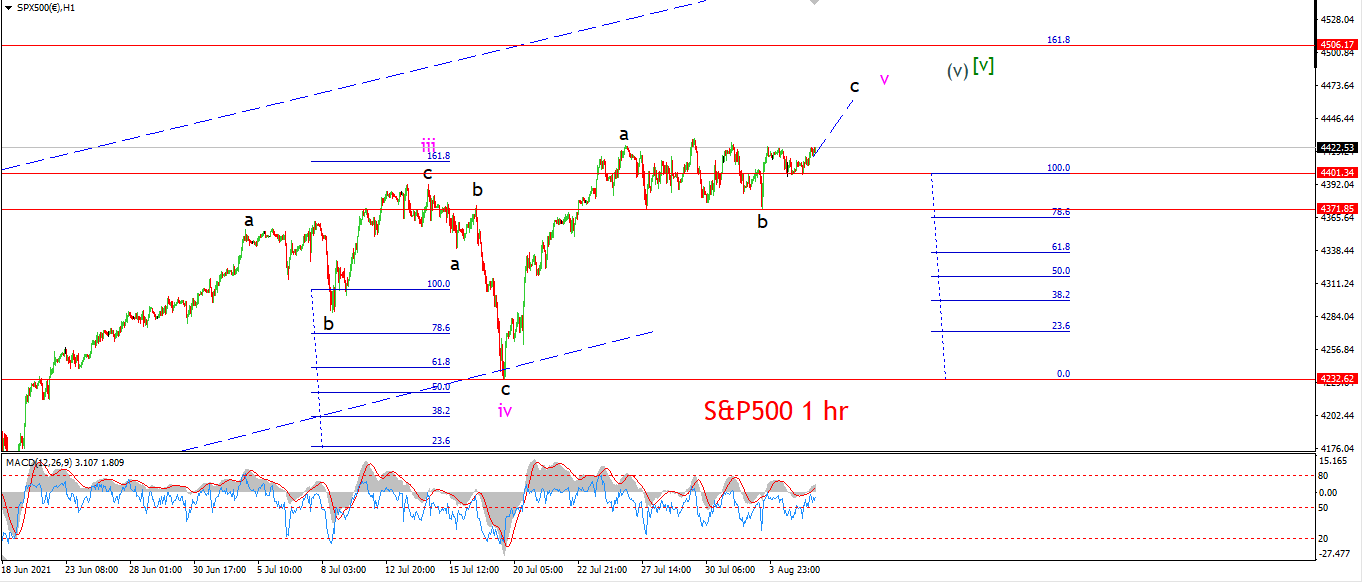
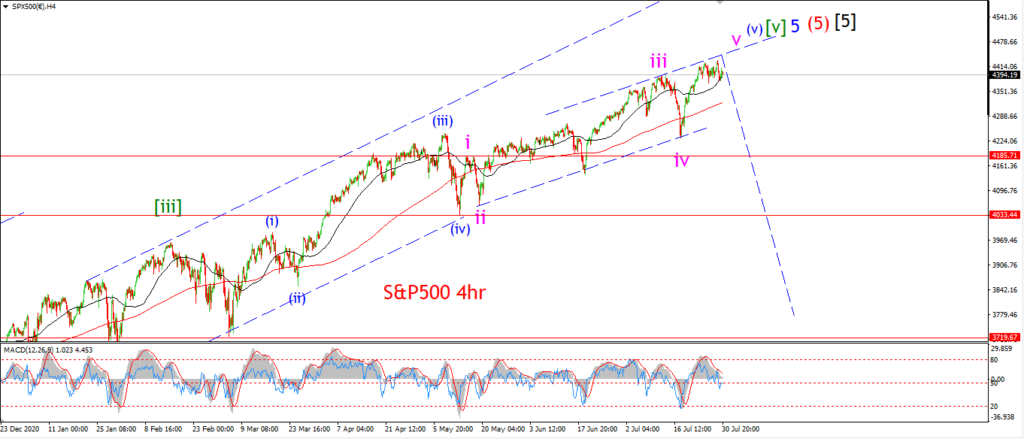
WAve ‘v’ continues to hold onto the price this week.
The diagonal pattern is still the best interpretation in my mind for this action.
and in this pattern,
we should see wave ‘v’ create a three wave rise into a final high as shown.
Wave ‘c’ of ‘v’ is expected to trace out a five wave pattern into that final top.
And that can easily be achieved by Monday evening even at this pace.
There is a reasonable target area for wave ‘v’ between 4401 and 4506.
wave ‘v’ = 100% of wave ‘i’ at 4401.
That target has already been met.
So the next target is where wave ‘v’ will hit 162% of wave ‘i’ at 4506.
We will see how far towards that level wave ‘c’ of ‘v’ hits in the end.
Tomorrow;
Watch for wave ‘c’ to continue higher in five waves.
4370 should hold for now.
SILVER.
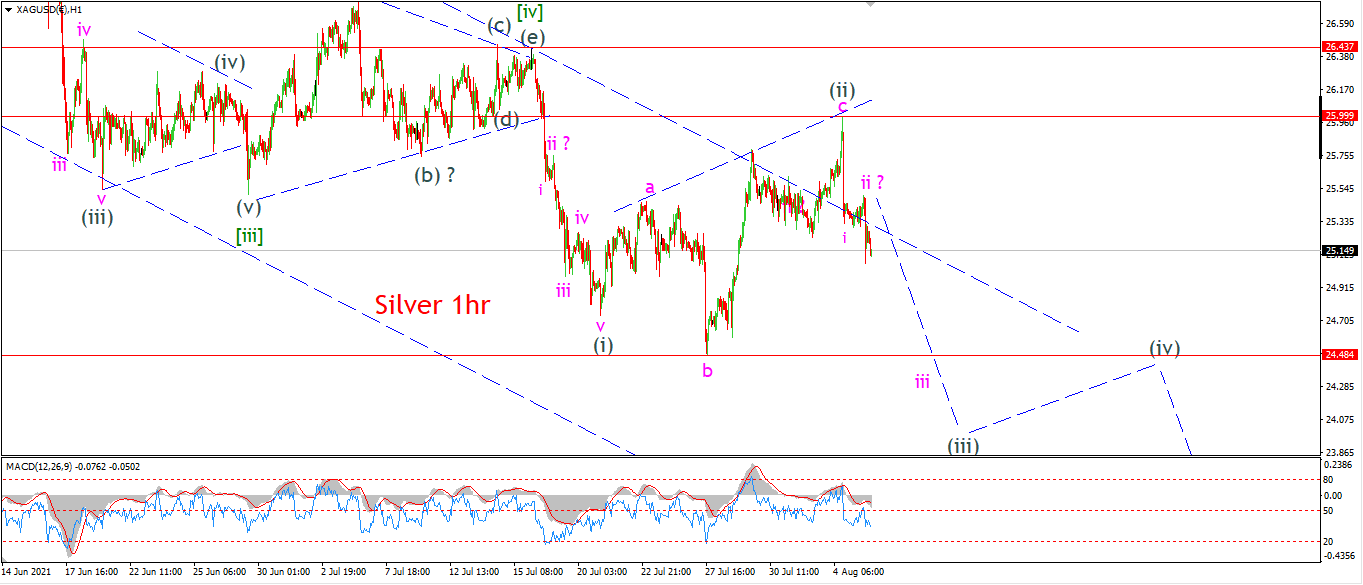
SILVER 1hr
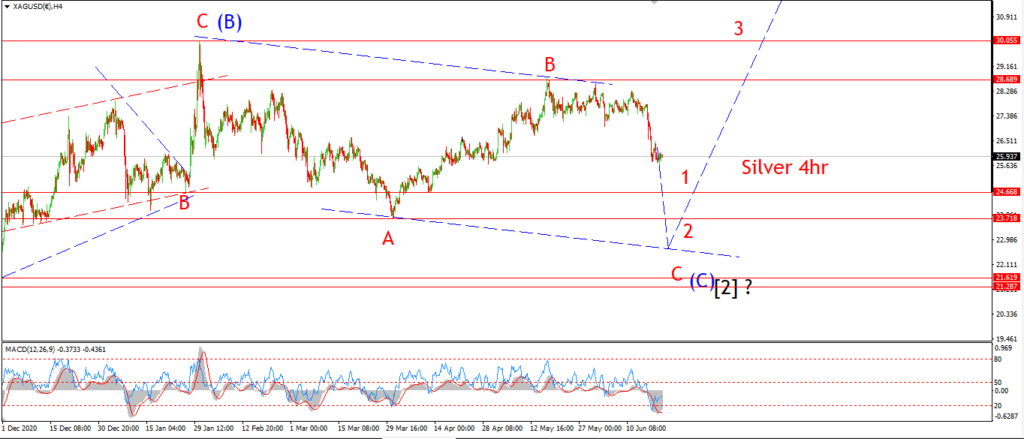
SILVER 4hr.
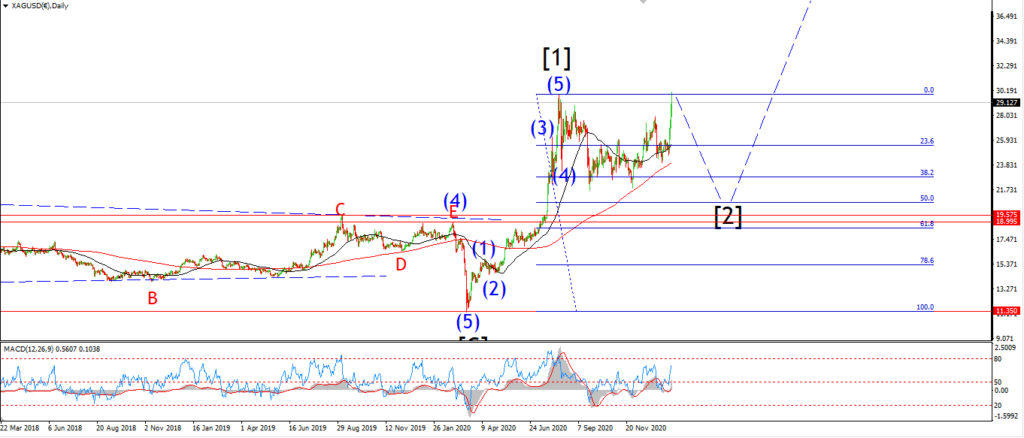
SILVER daily.
If wave (ii) is complete at this weeks high of 25.99,
then wave (iii) of [v] is now underway with the decline off that level.
There is a case to be made here that wave ‘iii’ of (iii) started today.
If so,
then we should se continued declines for the next few days trading at least.
Ans a break below 24.48 again will confirm the larger pattern for wave (iii) grey.
Tomorrow;
watch for wave (ii) to hold at 25.99.
Wave ‘iii’ of (iii) should head lower in five waves again.
BITCOIN
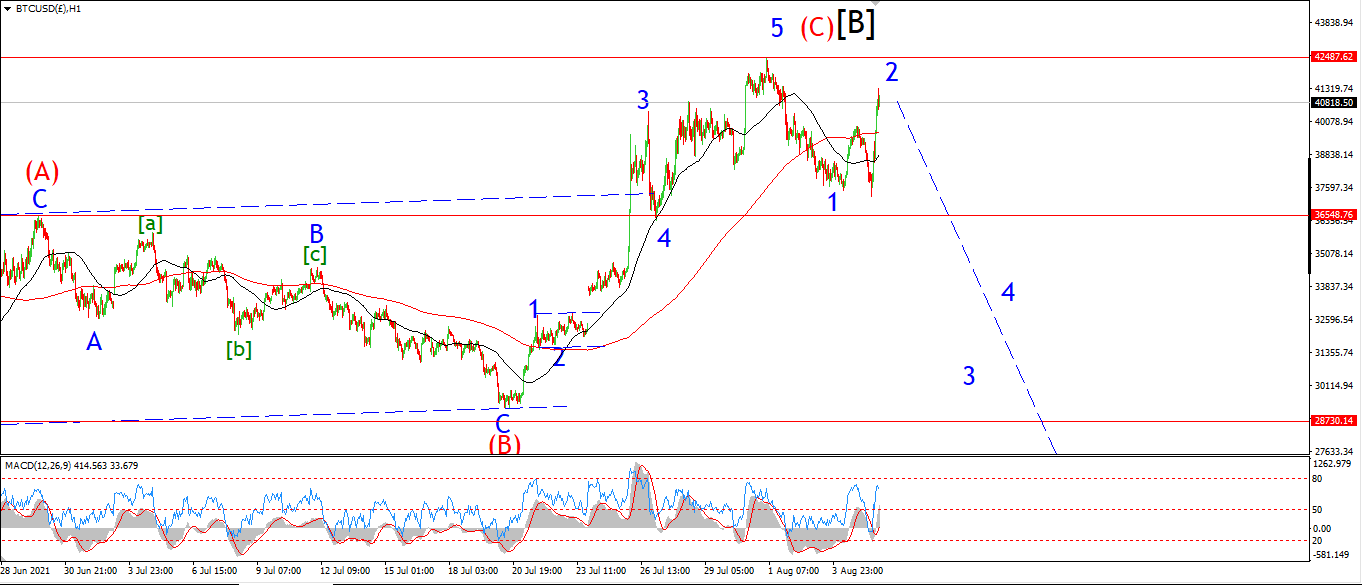
BITCOIN 1hr.
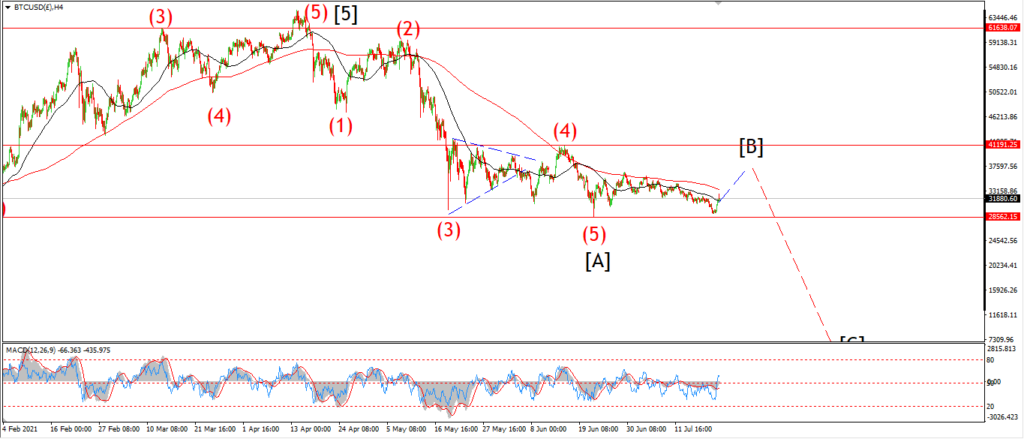
BITCOIN 4hr.
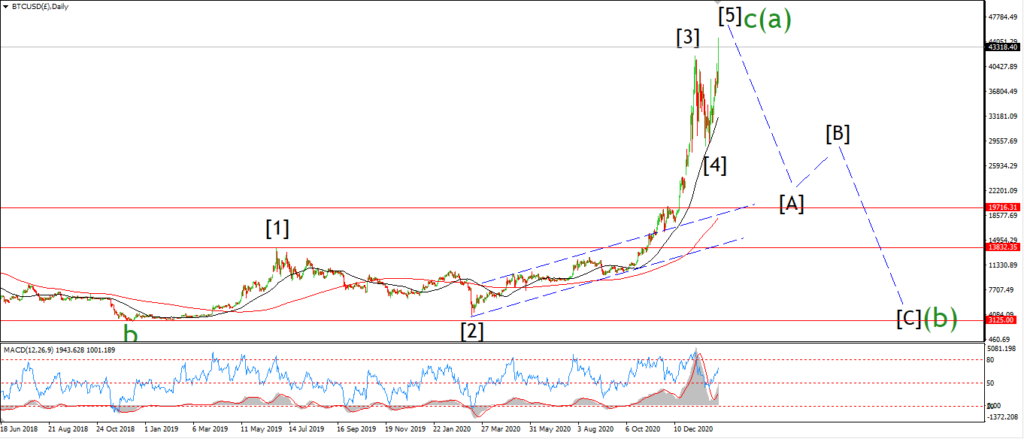
BITCOIN daily.
Topping in wave (a).
FTSE 100.
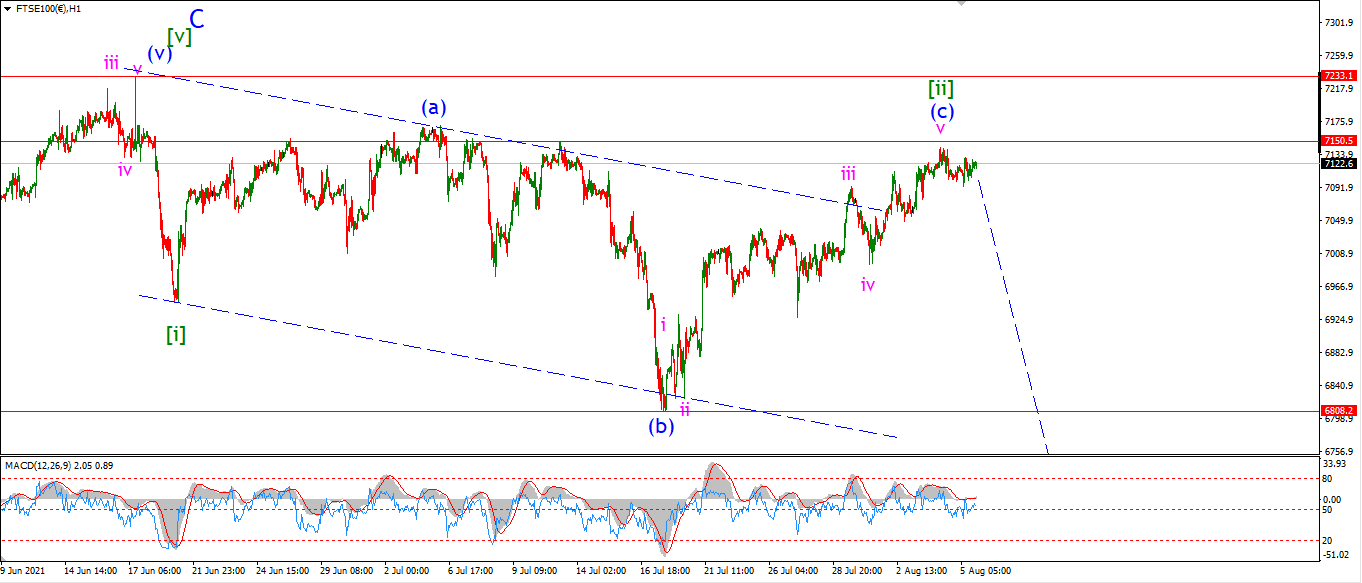
FTSE 100 1hr.
FTSE 100 4hr.

FTSE 100 daily.
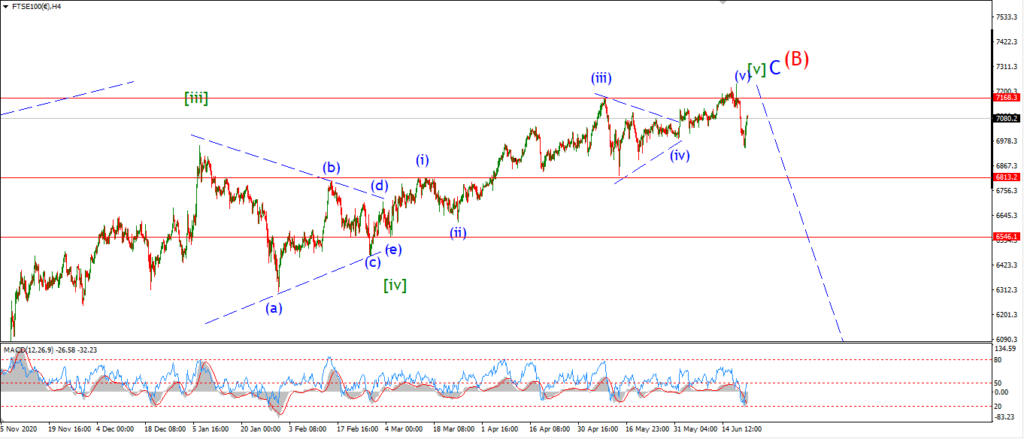
Complete wave (B).
DAX.
DAX 1hr
DAX 4hr
DAX daily.
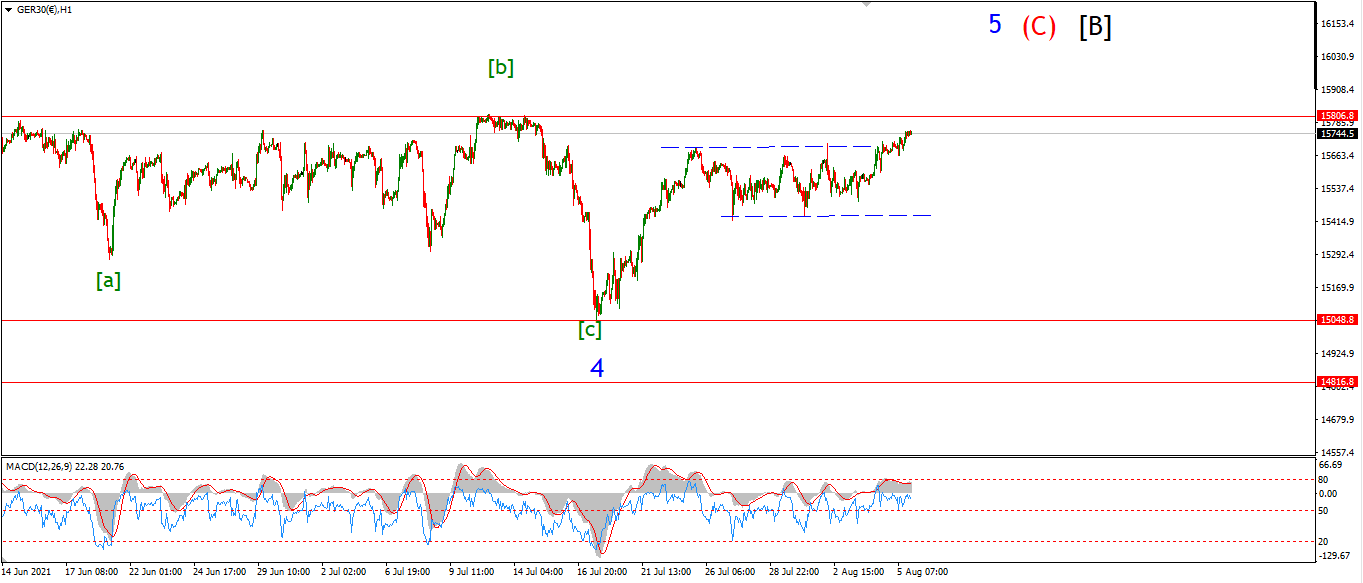
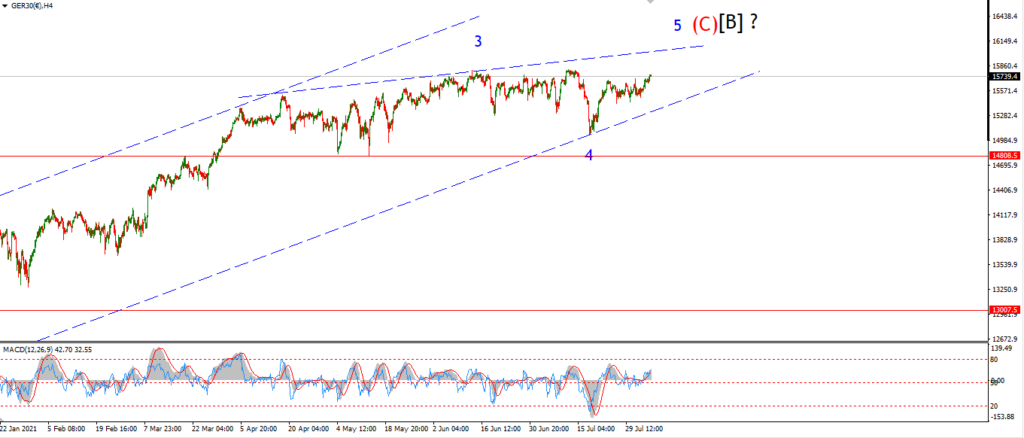
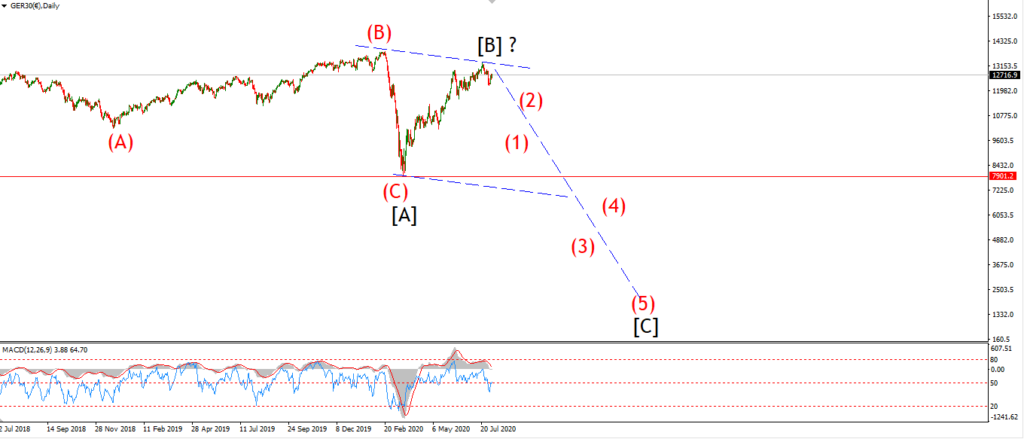
Topping out in wave [B].
NASDAQ 100.
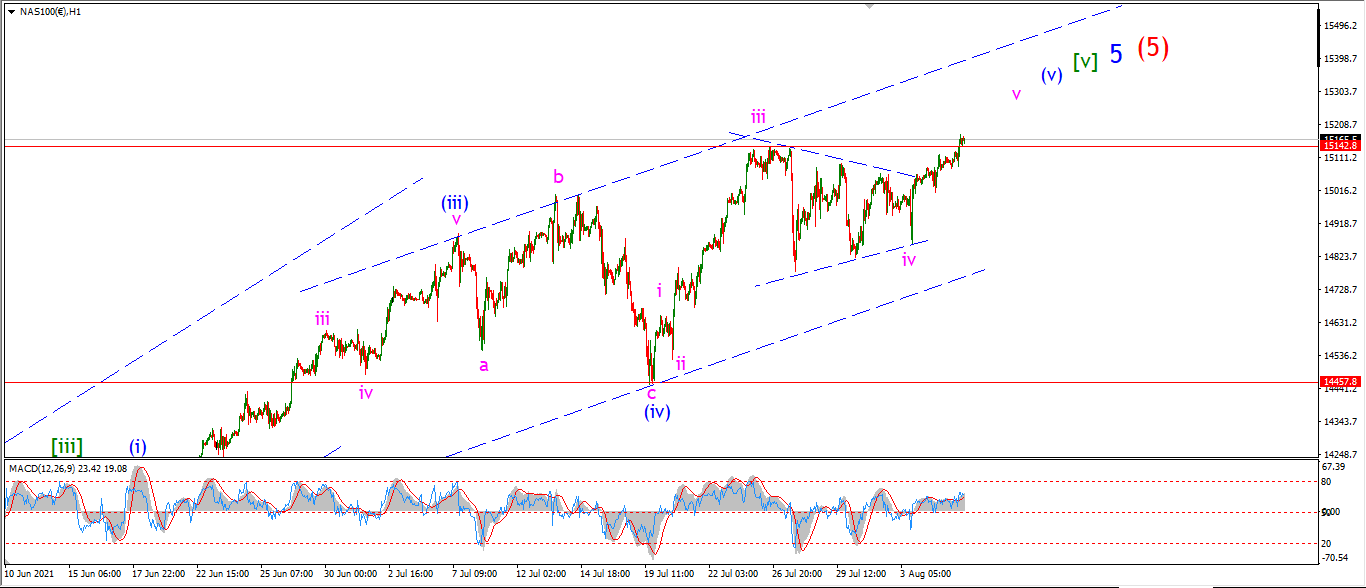
NASDAQ 1hr
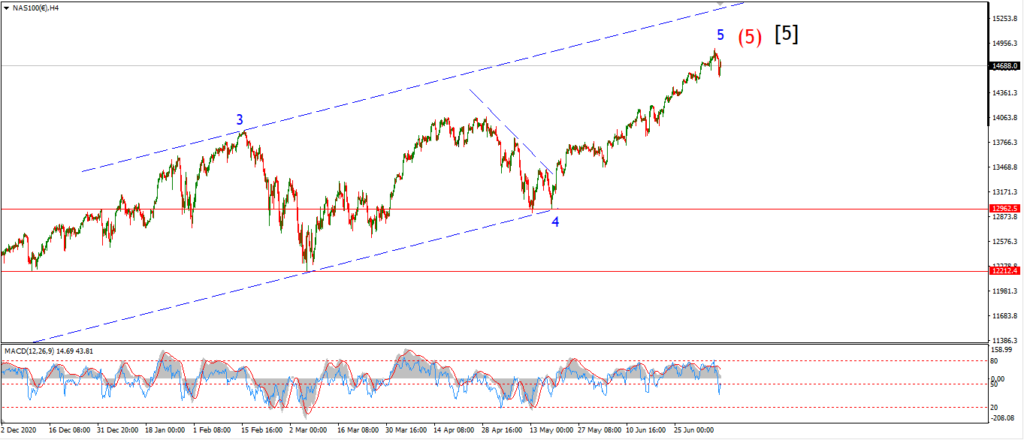
NASDAQ 4hr.
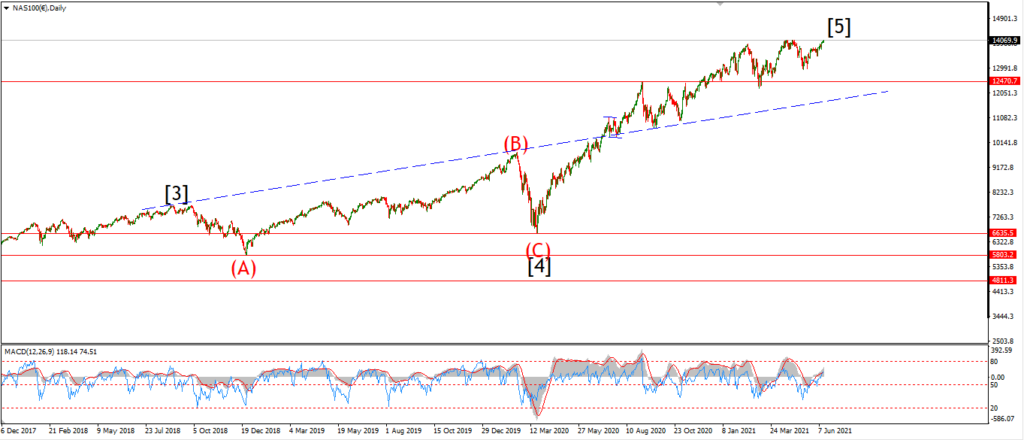
NASDAQ daily.
Is this it for the Nasdaq??