
[vc_row][vc_column][vc_separator border_width=”5″][/vc_column][/vc_row]
[vc_row][vc_column][vc_column_text]
Boy oh boy, what a day!
Well, this bearish week just got off to a great start eh?
the selling came thick and fast early in the NY session.
And with that single days trade,
we have managed to bring to the fore the potential for a big bear market dead ahead.
We are drawing close to a full five waves down on the short term chart now.
So we should see a corrective bounce begin soon.
And then things will get very interesting.
more on this later.
Here we go.
[/vc_column_text][/vc_column][/vc_row]
[vc_row][vc_column][vc_separator border_width=”5″][/vc_column][/vc_row]
[vc_row][vc_column][vc_column_text]
EURUSD
[/vc_column_text][/vc_column][/vc_row]
[vc_row][vc_column][vc_separator border_width=”5″][/vc_column][/vc_row][vc_row][vc_column width=”2/3″][vc_custom_heading text=”1 hr” use_theme_fonts=”yes”][vc_column_text]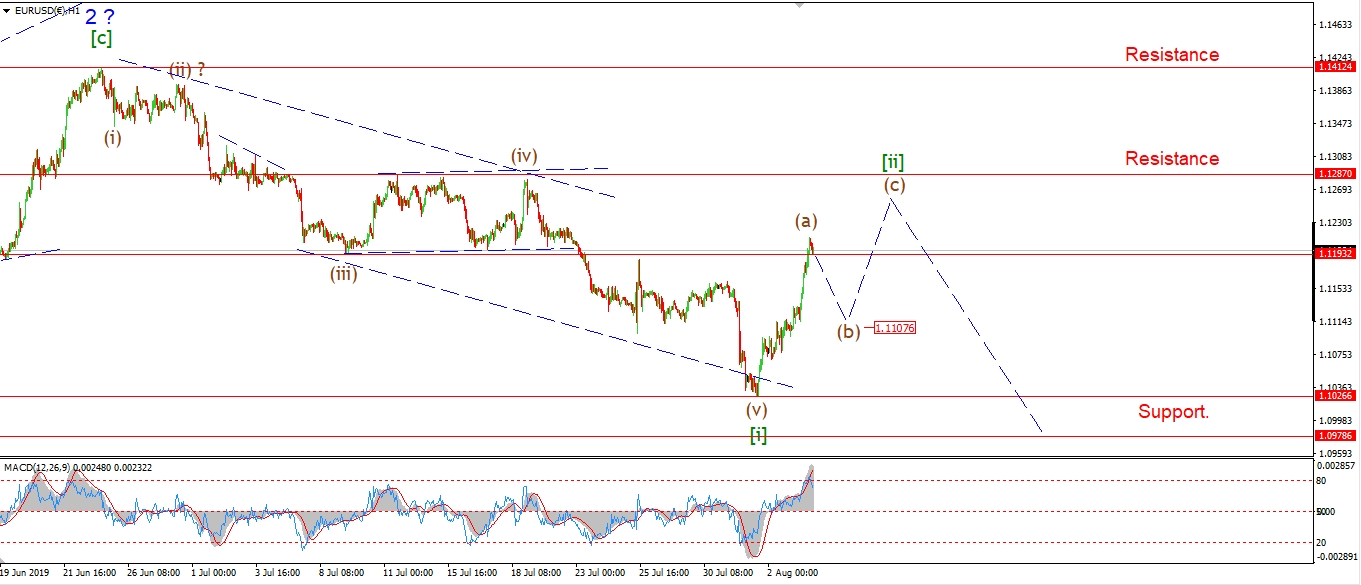 [/vc_column_text][/vc_column][vc_column width=”1/3″][vc_custom_heading text=”4 Hours” use_theme_fonts=”yes”][vc_column_text]
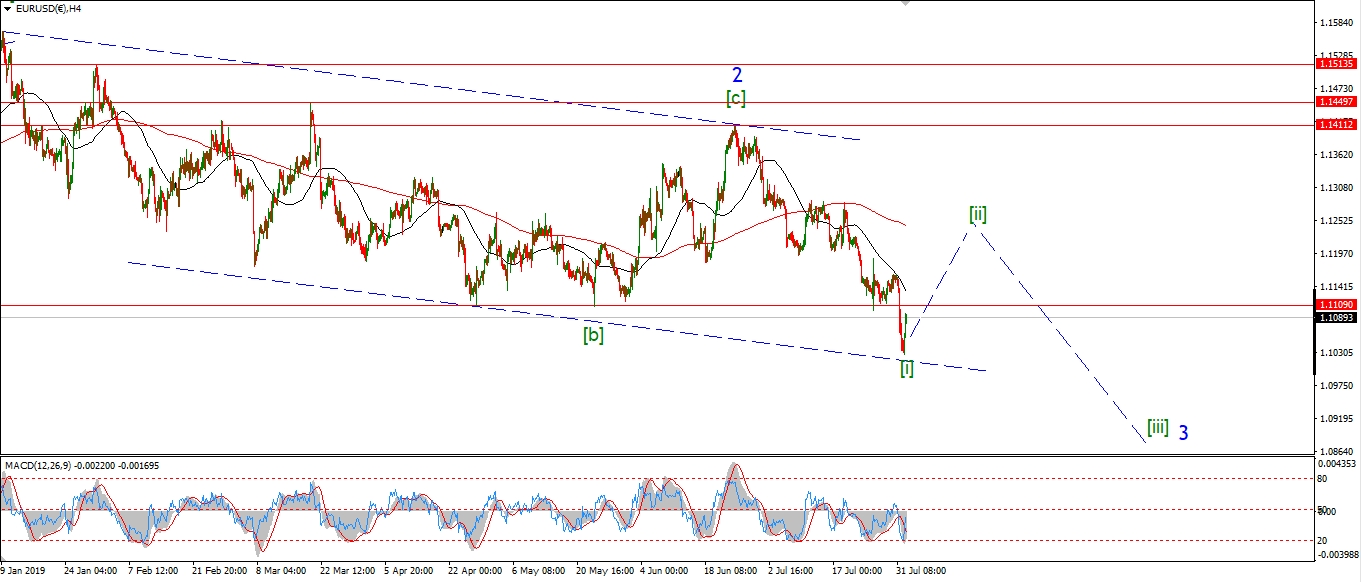 [/vc_column_text][vc_custom_heading text=”Daily” use_theme_fonts=”yes”][vc_column_text]
 [/vc_column_text][/vc_column][/vc_row]
[vc_row][vc_column][vc_column_text]
EURUSD has continued Fridays rally today,
and we now have a break above the initial resistance at 1.1190.
The action today has carried right into the target area for wave (a).
So we should see a corrective three wave decline in wave (b) begin tomorrow.
Wave (b) will likely find support at the 1.1100 handle where the previous correction completed.
And then wave (c) should again rally towards resistance at 1.1280 towards the end of the week.
All going well,
we will have a bearish lower high in place by the end of the week at wave [ii].
Tomorrow,
Watch for wave (b) to begin,
price should fall in three waves and complete above 1.1026.
[/vc_column_text][/vc_column][/vc_row]
[vc_row][vc_column][vc_separator border_width=”5″][/vc_column][/vc_row][vc_row][vc_column][vc_column_text]
GBPUSD
[/vc_column_text][/vc_column][/vc_row][vc_row][vc_column][vc_separator border_width=”5″][/vc_column][/vc_row][vc_row][vc_column width=”2/3″][vc_custom_heading text=”1 hr” use_theme_fonts=”yes”][vc_column_text]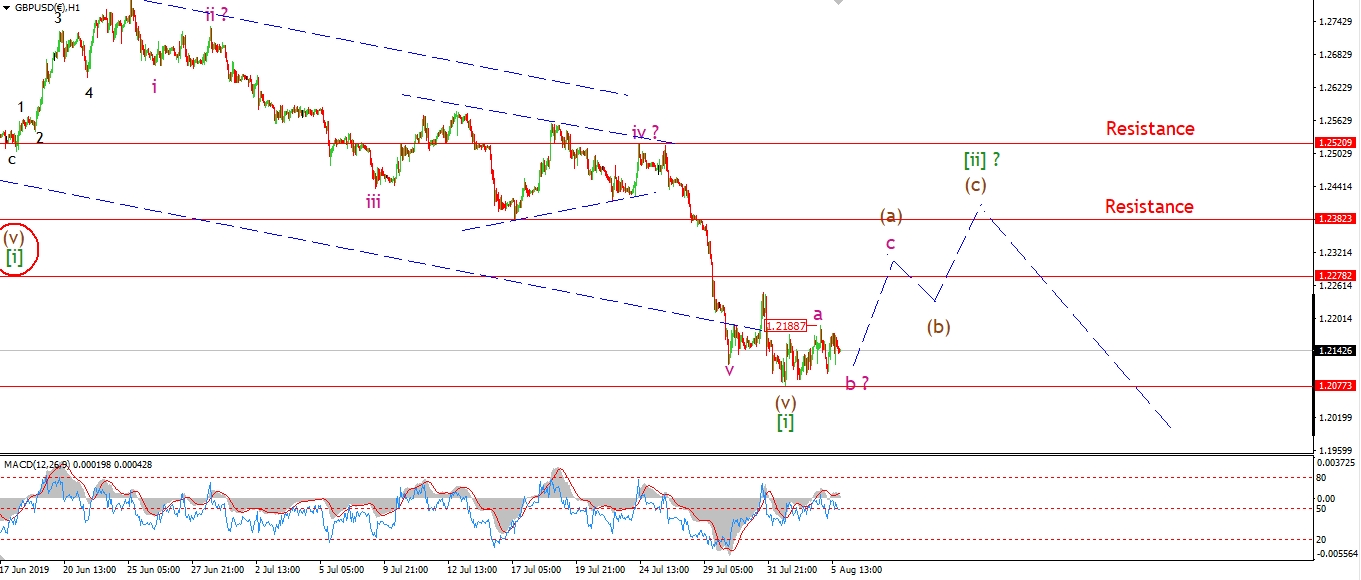 [/vc_column_text][/vc_column][vc_column width=”1/3″][vc_custom_heading text=”4 Hours” use_theme_fonts=”yes”][vc_column_text]
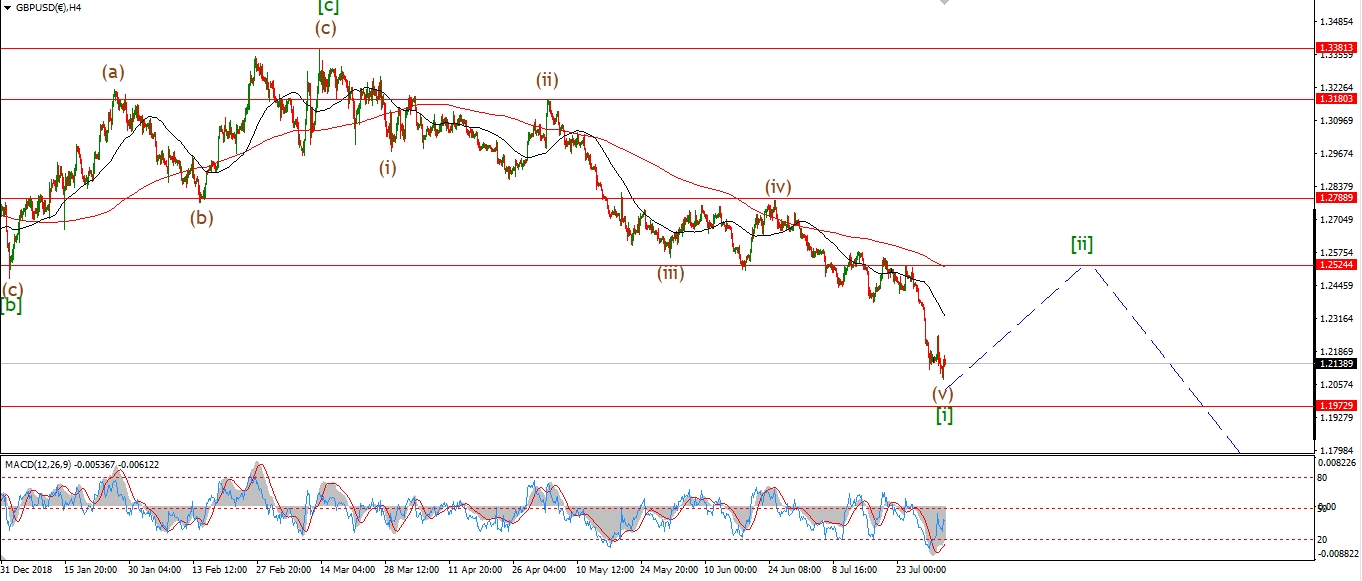 [/vc_column_text][vc_custom_heading text=”Daily” use_theme_fonts=”yes”][vc_column_text]
 [/vc_column_text][/vc_column][/vc_row]
[vc_row][vc_column][vc_column_text]
Cable rose in three waves into the overnight high at 1.2188.
I am viewing this rise as wave ‘a’ of (a).
the price must hold above 1.2077 in wave ‘b’.
and the price must rally tomorrow to complete three waves in wave (a).
I do believe the decline has gone too far without a corrective reaction now,
so wave [ii] is due to begin this week.
Tomorrow;
Watch for wave (a) of [ii] to hold above 1.2077 and continue higher towards initial resistance.
[/vc_column_text][/vc_column][/vc_row]
[vc_row][vc_column][vc_separator border_width=”5″][/vc_column][/vc_row][vc_row][vc_column][vc_column_text]
USDJPY
[/vc_column_text][/vc_column][/vc_row][vc_row][vc_column][vc_separator border_width=”5″][/vc_column][/vc_row][vc_row][vc_column width=”2/3″][vc_custom_heading text=”1 hr” use_theme_fonts=”yes”][vc_column_text]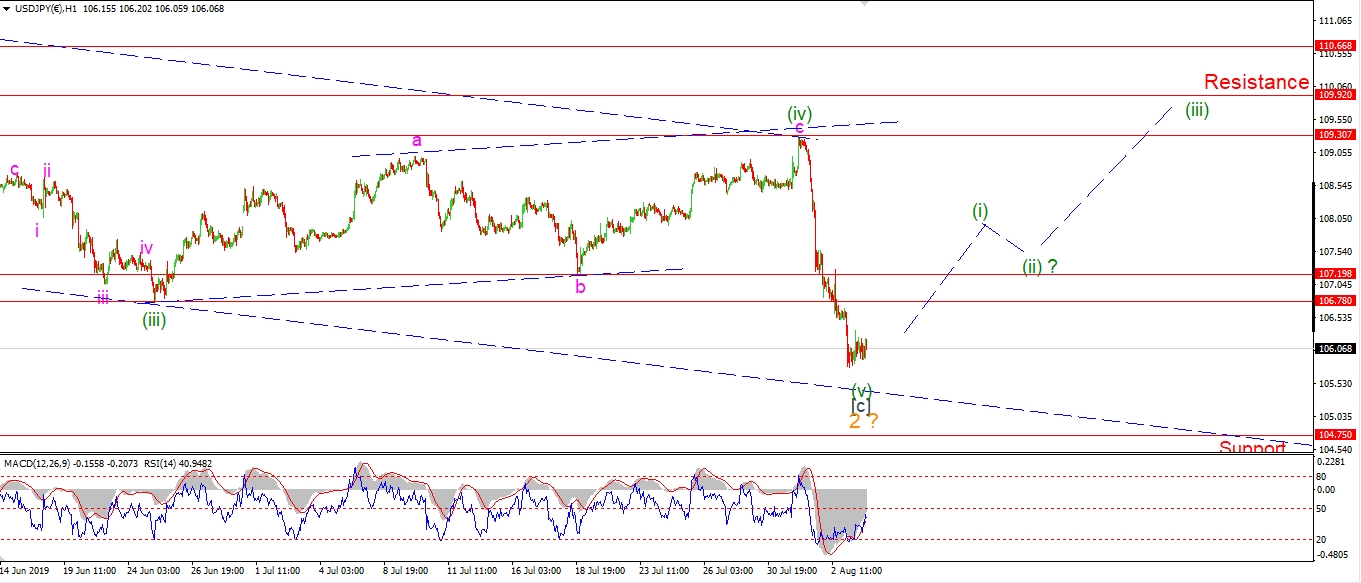 [/vc_column_text][/vc_column][vc_column width=”1/3″][vc_custom_heading text=”4 Hours” use_theme_fonts=”yes”][vc_column_text]
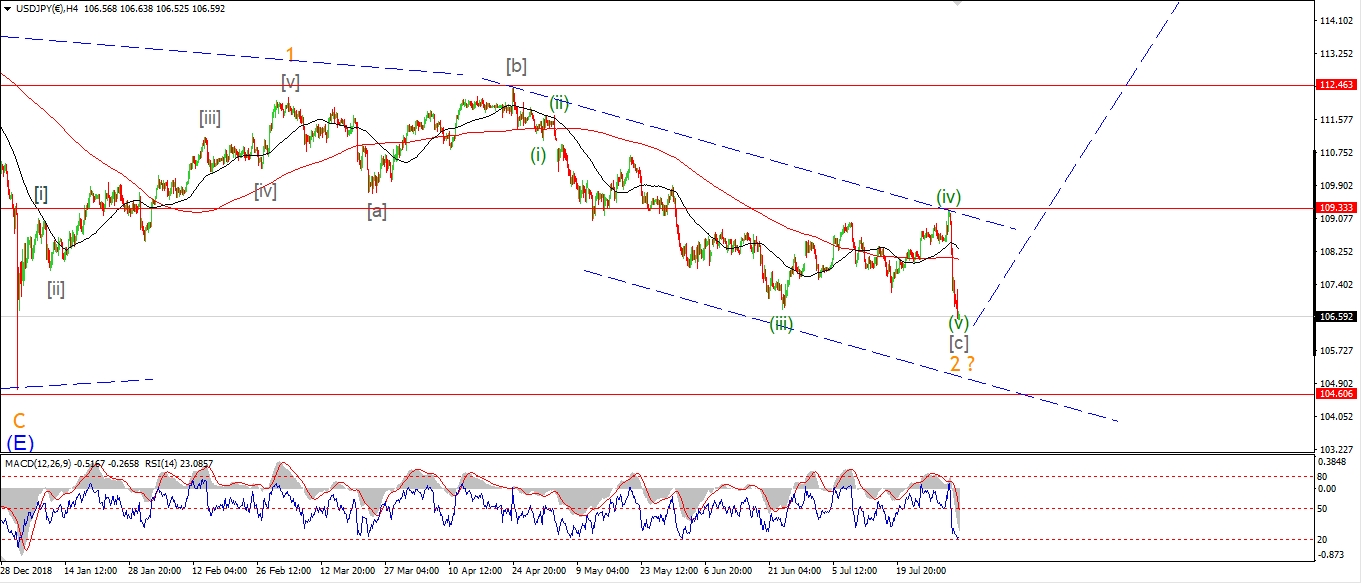 [/vc_column_text][vc_custom_heading text=”Daily” use_theme_fonts=”yes”][vc_column_text]
 [/vc_column_text][/vc_column][/vc_row]
[vc_row][vc_column][vc_column_text]
USDJPY has reached a temporary low today,
it looks like the price is holding before dropping once more to compete wave (v).
Although if the price does drop any further,
we will be awfully close to the 104.75 invalidation line for the current count.
Price simply must hold above 104.75 and rally back above 109.30 over the coming weeks to save this bullish count.
Its a real critical time for USDJPY now.
The short term action will define a much larger time frame in this pair.
Wait and see for now.
Tomorrow;
Price must hold above 104.75.
[/vc_column_text][/vc_column][/vc_row]
[vc_row][vc_column][vc_separator border_width=”5″][/vc_column][/vc_row][vc_row][vc_column][vc_column_text]
DOW JONES INDUSTRIALS
[/vc_column_text][/vc_column][/vc_row][vc_row][vc_column][vc_separator border_width=”5″][/vc_column][/vc_row][vc_row][vc_column width=”2/3″][vc_custom_heading text=”1 hr” use_theme_fonts=”yes”][vc_column_text]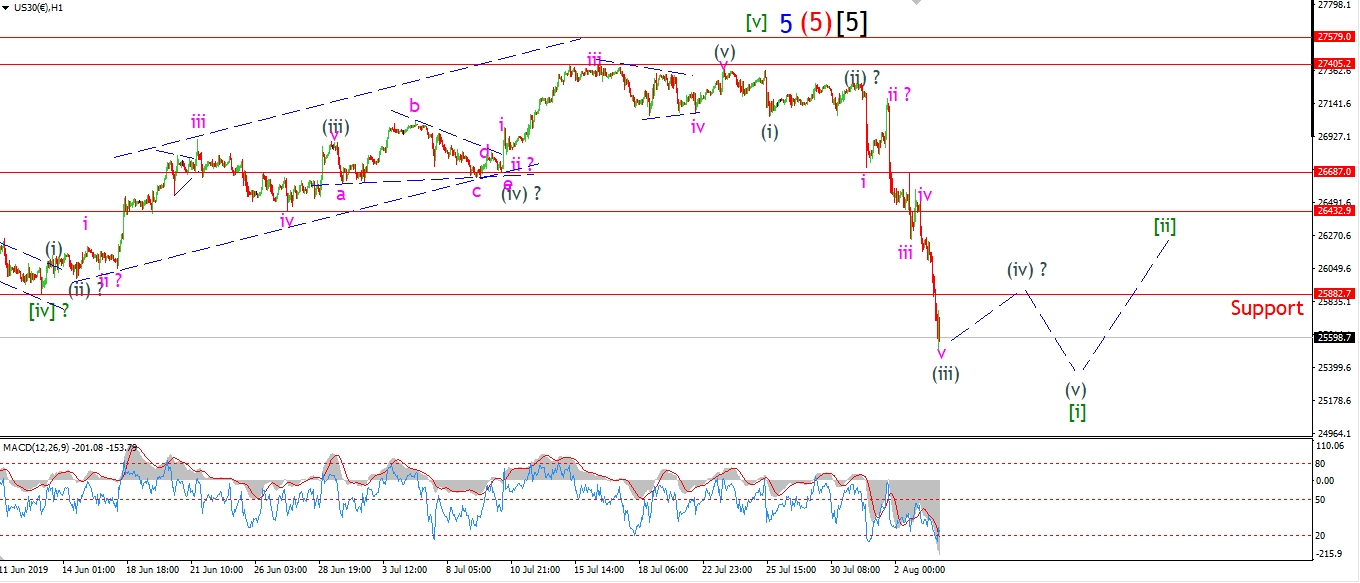 [/vc_column_text][/vc_column][vc_column width=”1/3″][vc_custom_heading text=”4 Hours” use_theme_fonts=”yes”][vc_column_text]
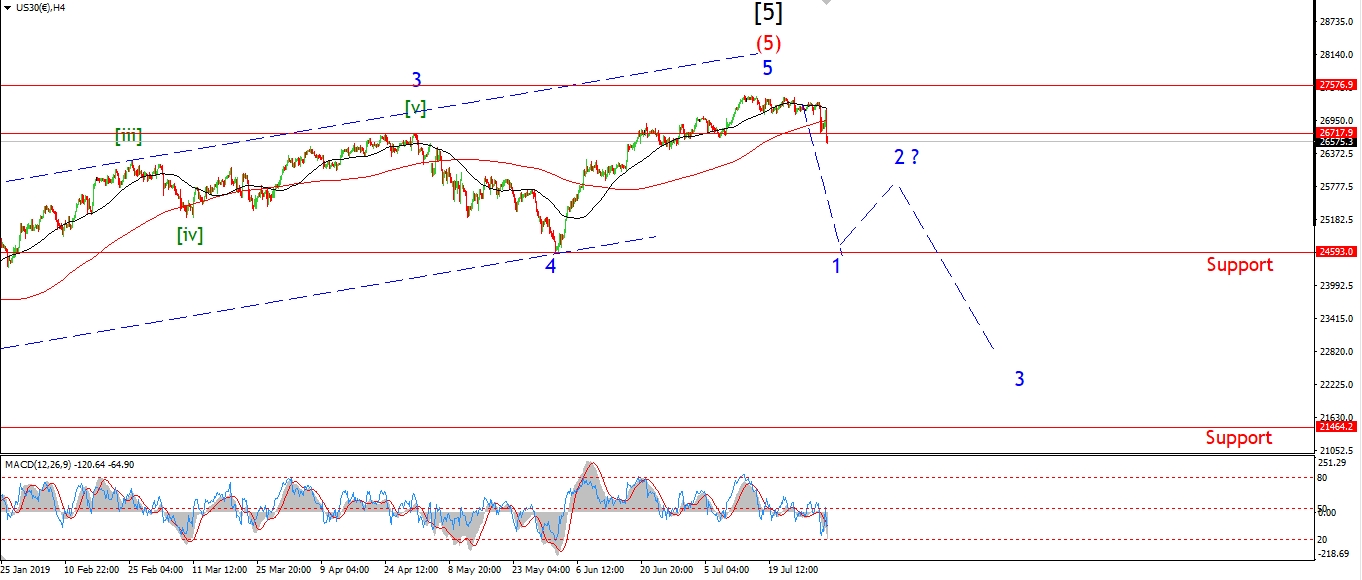 [/vc_column_text][vc_custom_heading text=”Daily” use_theme_fonts=”yes”][vc_column_text]
 [/vc_column_text][/vc_column][/vc_row]
[vc_row][vc_column][vc_column_text]
The DOW has plunged by 820 points so far today!
This decline is up there with some of the biggest declines in the indexes history.
Stocks are fast falling from grace now,
but if I am correct,
this is just the tip of the iceberg.
It is hard to know if we have a complete five wave structure to the downside just yet.
But we are getting close now.
I am allowing for a correction in wave (iv)
and then a decline again in wave (v) over the coming days.
This should complete wave [i] down.
And then we can concentrate on the inevitable dead cat bounce in wave [ii].
Wave [ii] should trace out a three wave rally.
And the high of wave [ii] will complete a large bearish signal in the DOW.
Wave [iii] down should prove fatal for the bull market.
Tomorrow;
Watch for a possible correction in wave (iv) to begin.
[/vc_column_text][/vc_column][/vc_row]
[vc_row][vc_column][vc_separator border_width=”5″][/vc_column][/vc_row][vc_row][vc_column][vc_column_text]
GOLD
[/vc_column_text][/vc_column][/vc_row][vc_row][vc_column][vc_separator border_width=”5″][/vc_column][/vc_row][vc_row][vc_column width=”2/3″][vc_custom_heading text=”1 hr” use_theme_fonts=”yes”][vc_column_text]
 [/vc_column_text][/vc_column][vc_column width=”1/3″][vc_custom_heading text=”4 Hours” use_theme_fonts=”yes”][vc_column_text]
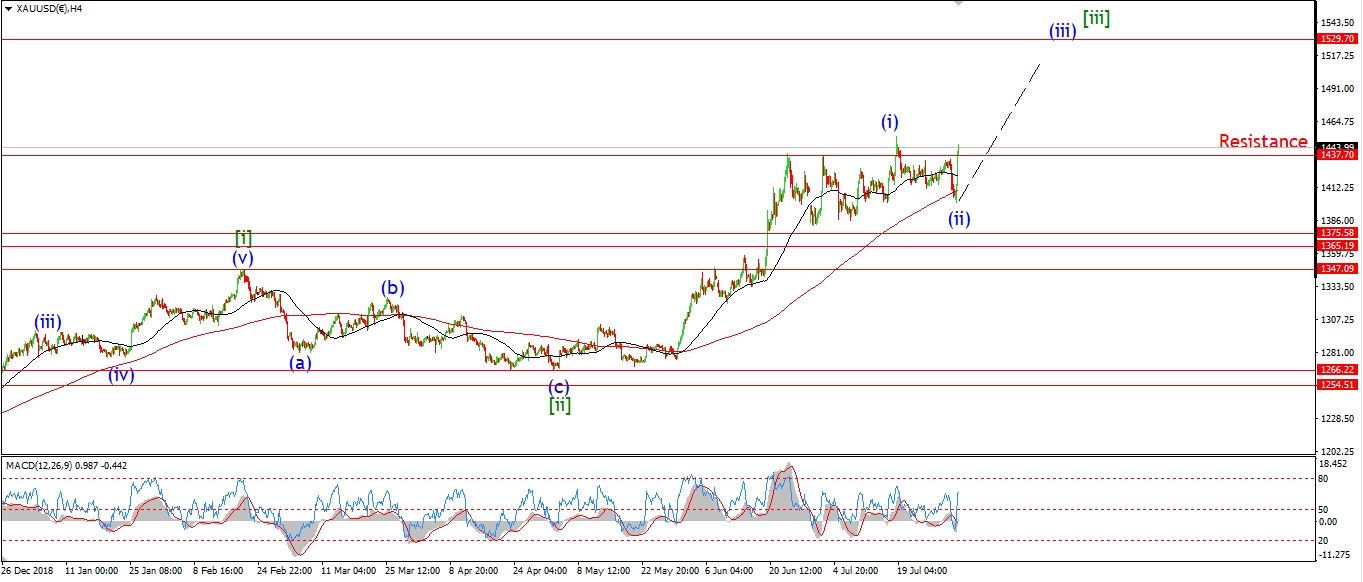 [/vc_column_text][vc_custom_heading text=”Daily” use_theme_fonts=”yes”][vc_column_text]
 [/vc_column_text][/vc_column][/vc_row]
[vc_row][vc_column][vc_column_text]
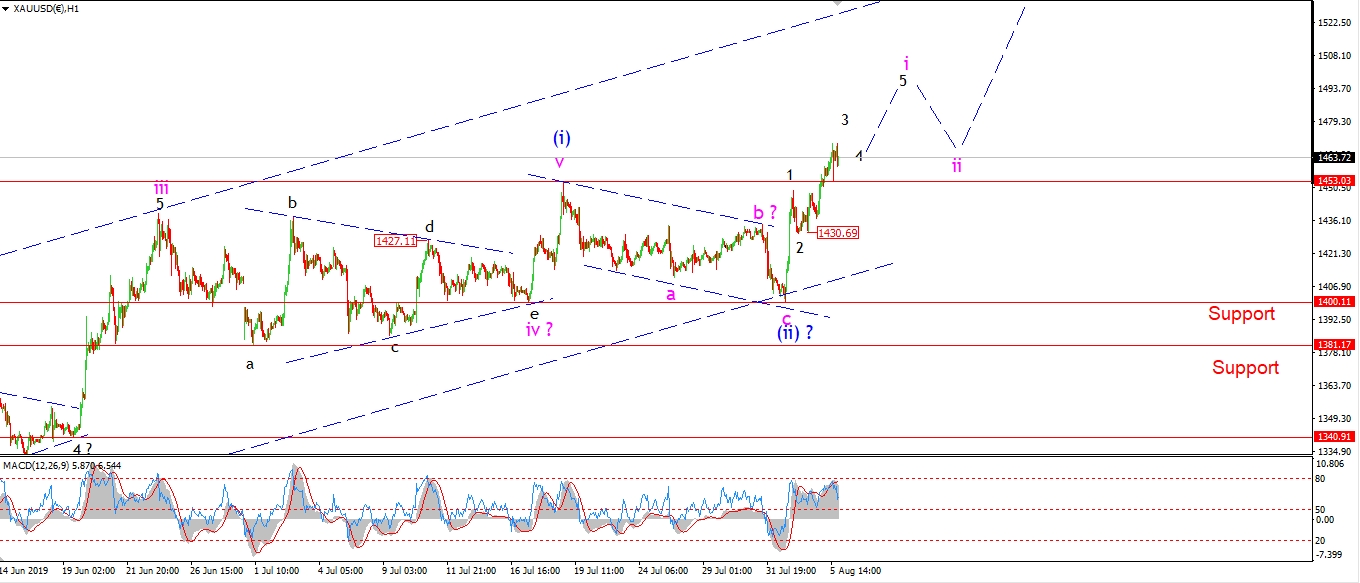
Gold is pushing higher again today to begin wave ‘i’ of (iii).
I don’t think we have five waves up complete yet in wave ‘i’,
so I have shown a smaller degree labeling on tonight’s chart,
with wave ‘3’ of ‘i’ now carrying price higher.
Wave ‘i’ of (iii) should push up to about 1500,
before wave ‘ii’ turns lower again later in the week.
Tomorrow;
Watch for wave ‘i’ pink to hold above 1430 as a five wave rally continues.
[/vc_column_text][/vc_column][/vc_row]
[vc_row][vc_column][vc_separator border_width=”5″][/vc_column][/vc_row][vc_row][vc_column][vc_column_text]
U.S CRUDE OIL
[/vc_column_text][/vc_column][/vc_row][vc_row][vc_column][vc_separator border_width=”5″][/vc_column][/vc_row][vc_row][vc_column width=”2/3″][vc_custom_heading text=”1 hr” use_theme_fonts=”yes”][vc_column_text]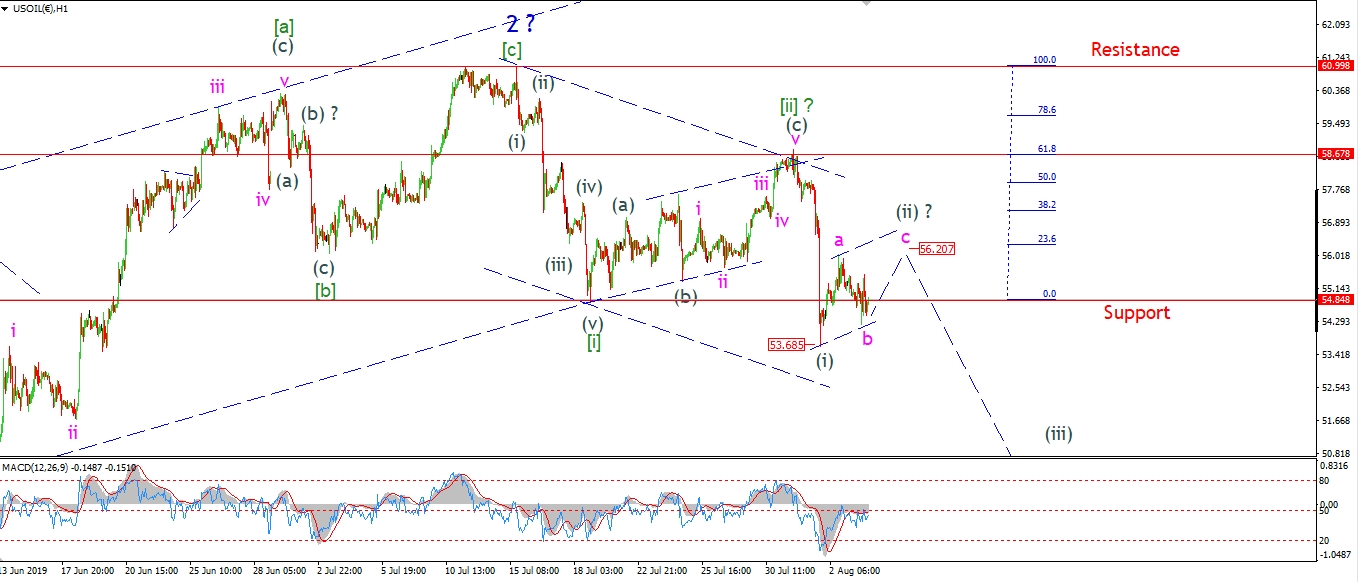 [/vc_column_text][/vc_column][vc_column width=”1/3″][vc_custom_heading text=”4 Hours” use_theme_fonts=”yes”][vc_column_text]
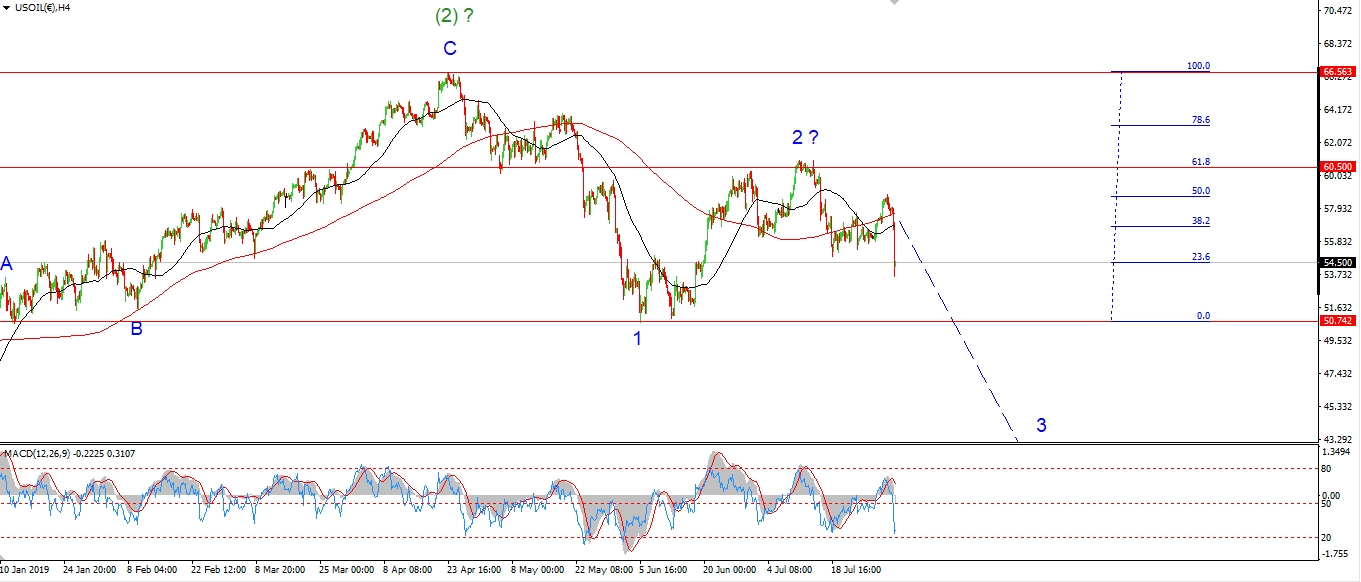 [/vc_column_text][vc_custom_heading text=”Daily” use_theme_fonts=”yes”][vc_column_text]
 [/vc_column_text][/vc_column][/vc_row]
[vc_row][vc_column][vc_column_text]
Crude was very stable today given the action in stocks.
This does suggest todays decline is only wave ‘b’ of (ii) as shown.
The price has drifted corrective lower rather than accelerating into a third wave.
So I think we can allow for a larger three wave correction in wave (ii) to develop this week,
before looking lower into wave (iii) again.
Tomorrow;
Watch for wave (i) to hold at 53.70.
wave ‘c’ of (ii) should rise towards the upper trendline at 56.20 over the coming days.
[/vc_column_text][/vc_column][/vc_row]
[vc_row][vc_column][vc_separator border_width=”5″][/vc_column][/vc_row][vc_row][vc_column][vc_column_text]
US 10 yr Treasuries.
[/vc_column_text][/vc_column][/vc_row][vc_row][vc_column][vc_separator border_width=”5″][/vc_column][/vc_row][vc_row][vc_column width=”2/3″][vc_custom_heading text=”1 hr” use_theme_fonts=”yes”][vc_column_text]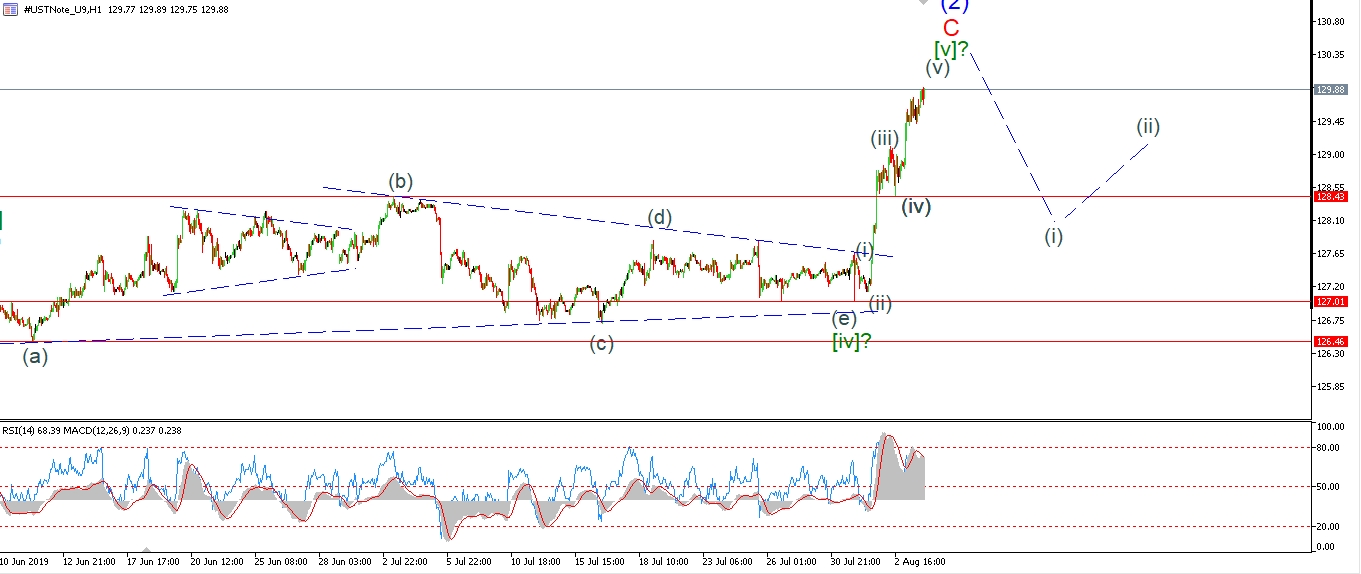 [/vc_column_text][/vc_column][vc_column width=”1/3″][vc_custom_heading text=”4 Hours” use_theme_fonts=”yes”][vc_column_text]
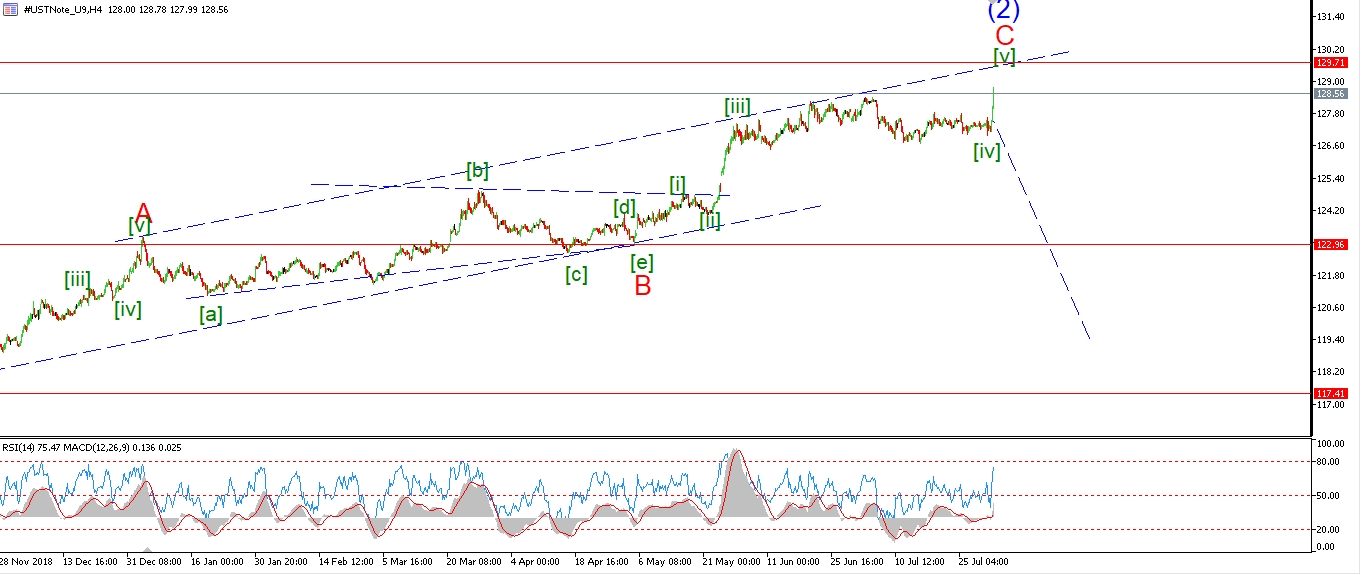 [/vc_column_text][vc_custom_heading text=”Daily” use_theme_fonts=”yes”][vc_column_text]
 [/vc_column_text][/vc_column][/vc_row]
[vc_row][vc_column][vc_column_text]
Wave [v] of ‘C’ has reached the target area at todays highs.
Wave [v] itself has traced out a five wave move out of the triangle wave [iv].
Also;
The 4hr chart shows that wave ‘C’ has now filled a large trend channel
which holds the three wave correction in wave (2).
So we now have a completed corrective pattern in place for wave (2) blue.
Once wave [v] reaches its end,
the next major move should be lower in five waves to signal the turn is in.
And wave (3) down has begun.
Tomorrow;
Watch for wave (v) of [v] to close out soon.
A decline back below 128.40 again will signal that wave [i] down has begun.
[/vc_column_text][/vc_column][/vc_row]
[vc_row][vc_column][vc_separator border_width=”5″][/vc_column][/vc_row][vc_row][vc_column][vc_column_text]
SILVER
[/vc_column_text][/vc_column][/vc_row][vc_row][vc_column][vc_separator border_width=”5″][/vc_column][/vc_row][vc_row][vc_column width=”2/3″][vc_custom_heading text=”1 hr” use_theme_fonts=”yes”][vc_column_text]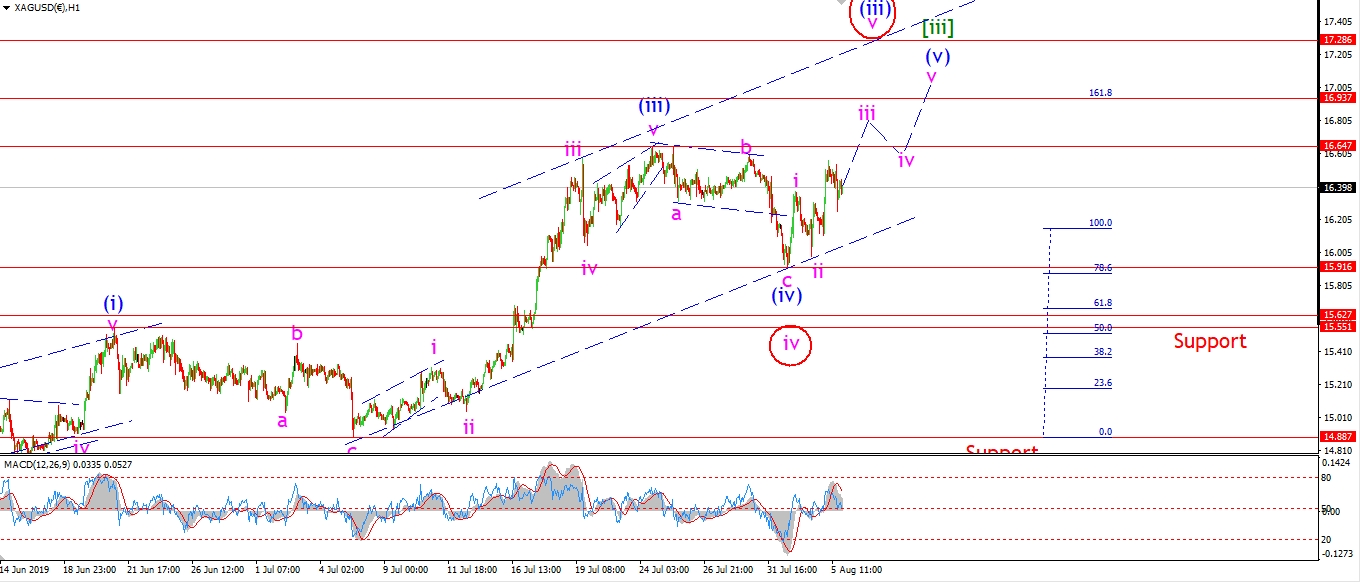 [/vc_column_text][/vc_column][vc_column width=”1/3″][vc_custom_heading text=”4 Hours” use_theme_fonts=”yes”][vc_column_text]
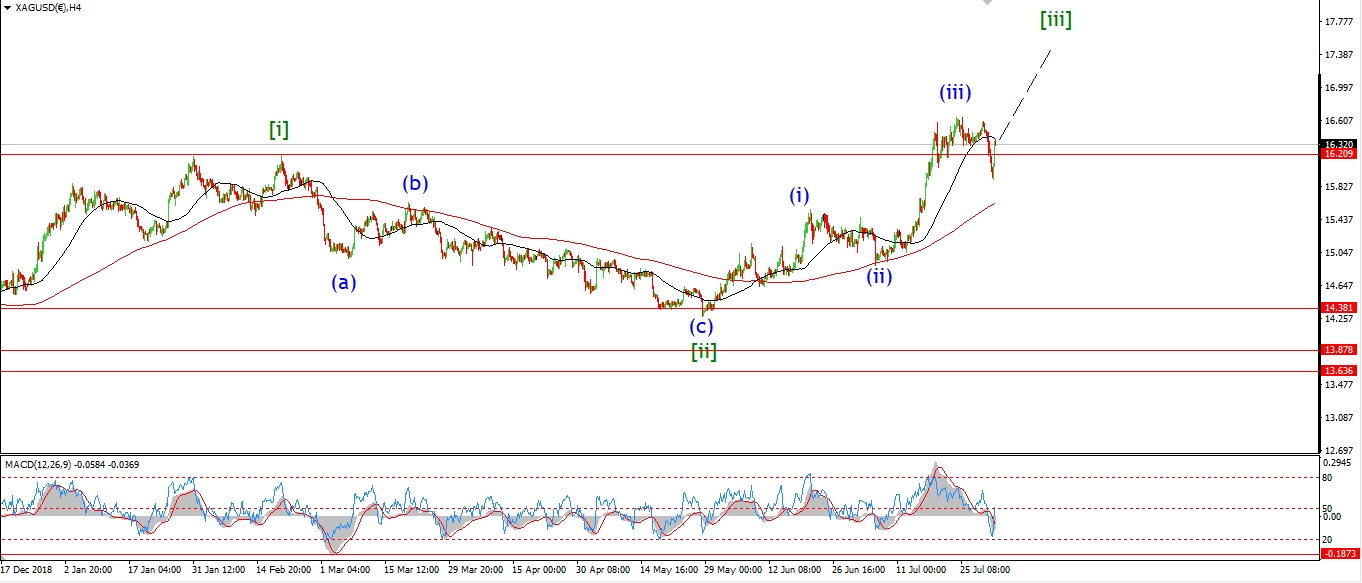 [/vc_column_text][vc_custom_heading text=”Daily” use_theme_fonts=”yes”][vc_column_text]
 [/vc_column_text][/vc_column][/vc_row]
[vc_row][vc_column][vc_column_text]
Silver is spiking higher with corrective action off the short term highs.
This action suggests that wave (v) is now underway.
We could be seeing a series of impulse wave higher,
with wave ‘iii’ of (v) creating an extension.
A break above 16.64 will confirm wave (v) blue,
That should happen tomorrow,
and wave (v) should continue higher to about 17.26 to complete the larger structure.
Tomorrow;
15.91 must hold at wave (iv).
Wave ‘iii’ of (v) should continue higher.
[/vc_column_text][/vc_column][/vc_row]
[vc_row][vc_column][vc_separator border_width=”5″][/vc_column][/vc_row][vc_row][vc_column][vc_column_text]
S&P 500.
[/vc_column_text][/vc_column][/vc_row][vc_row][vc_column][vc_separator border_width=”5″][/vc_column][/vc_row][vc_row][vc_column width=”2/3″][vc_custom_heading text=”1 hr” use_theme_fonts=”yes”][vc_column_text]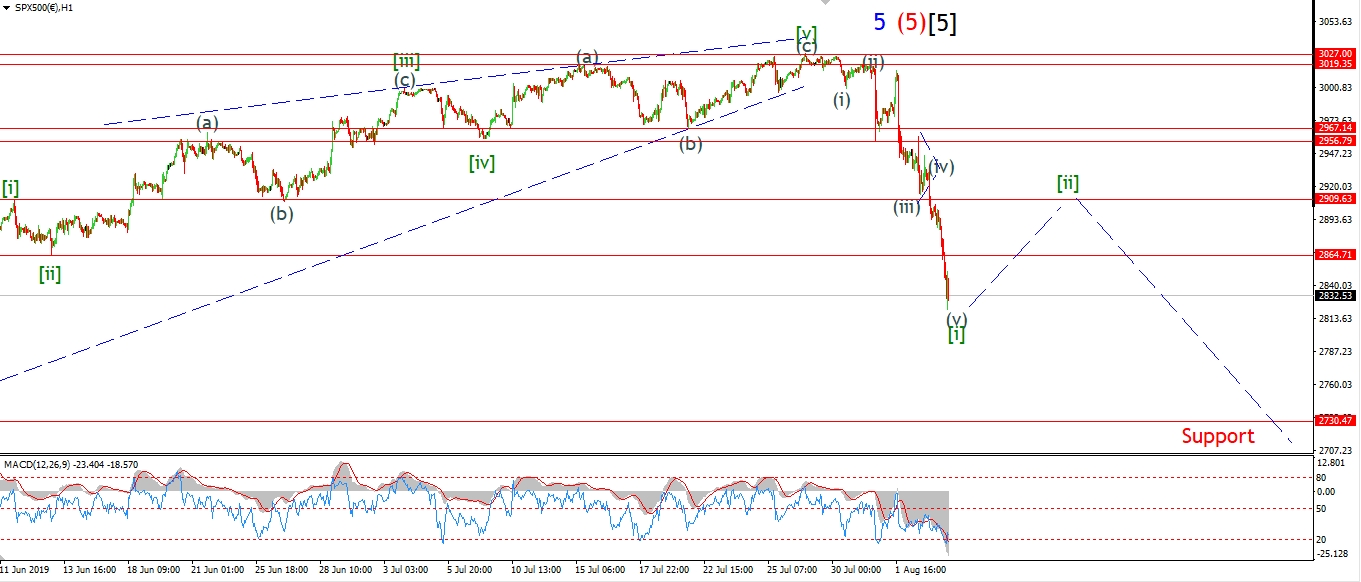 [/vc_column_text][/vc_column][vc_column width=”1/3″][vc_custom_heading text=”4 Hours” use_theme_fonts=”yes”][vc_column_text]
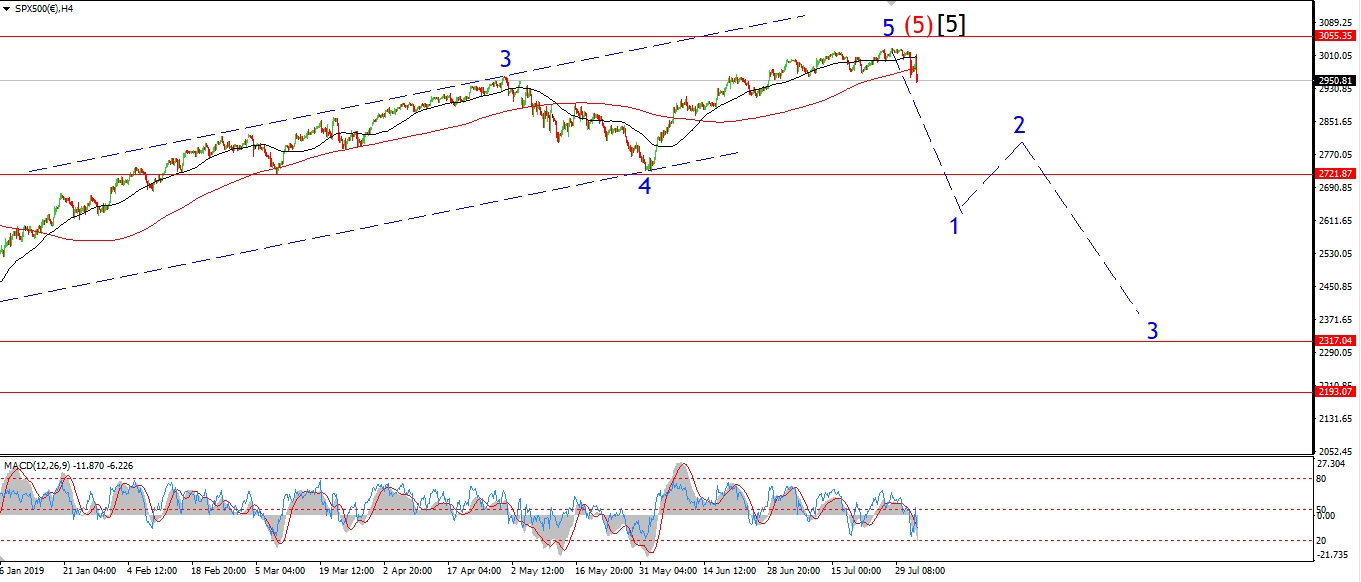 [/vc_column_text][vc_custom_heading text=”Daily” use_theme_fonts=”yes”][vc_column_text]
 [/vc_column_text][/vc_column][/vc_row]
[vc_row][vc_column][vc_column_text]
The S&P gaped lower this morning out of a possible triangle wave (iv),
as labelled on the short term chart.
The market is reaching the end of a five wave move off the all time high now.
And we have now broken through three previous support levels after todays session.
All this action is adding to a very bearish big picture which is building now.
One which views the market now turning down into a very deep bearmarket.
A bearmarket which should surpass the great recession in its effects on the economy.
The market is now hitting short term oversold levels.
So I expect we will see wave [i] down complete soon,
and a corrective rally begin by the middle of the week in wave [ii].
Tomorrow;
Major support lies at 2730 the previous wave ‘4’ blue.
Wave [i] should complete above that level.
Watch for wave (v) of [i] come to a close tomorrow.
[/vc_column_text][/vc_column][/vc_row]
[vc_row][vc_column][vc_separator border_width=”5″][/vc_column][/vc_row]